
176 days on Market
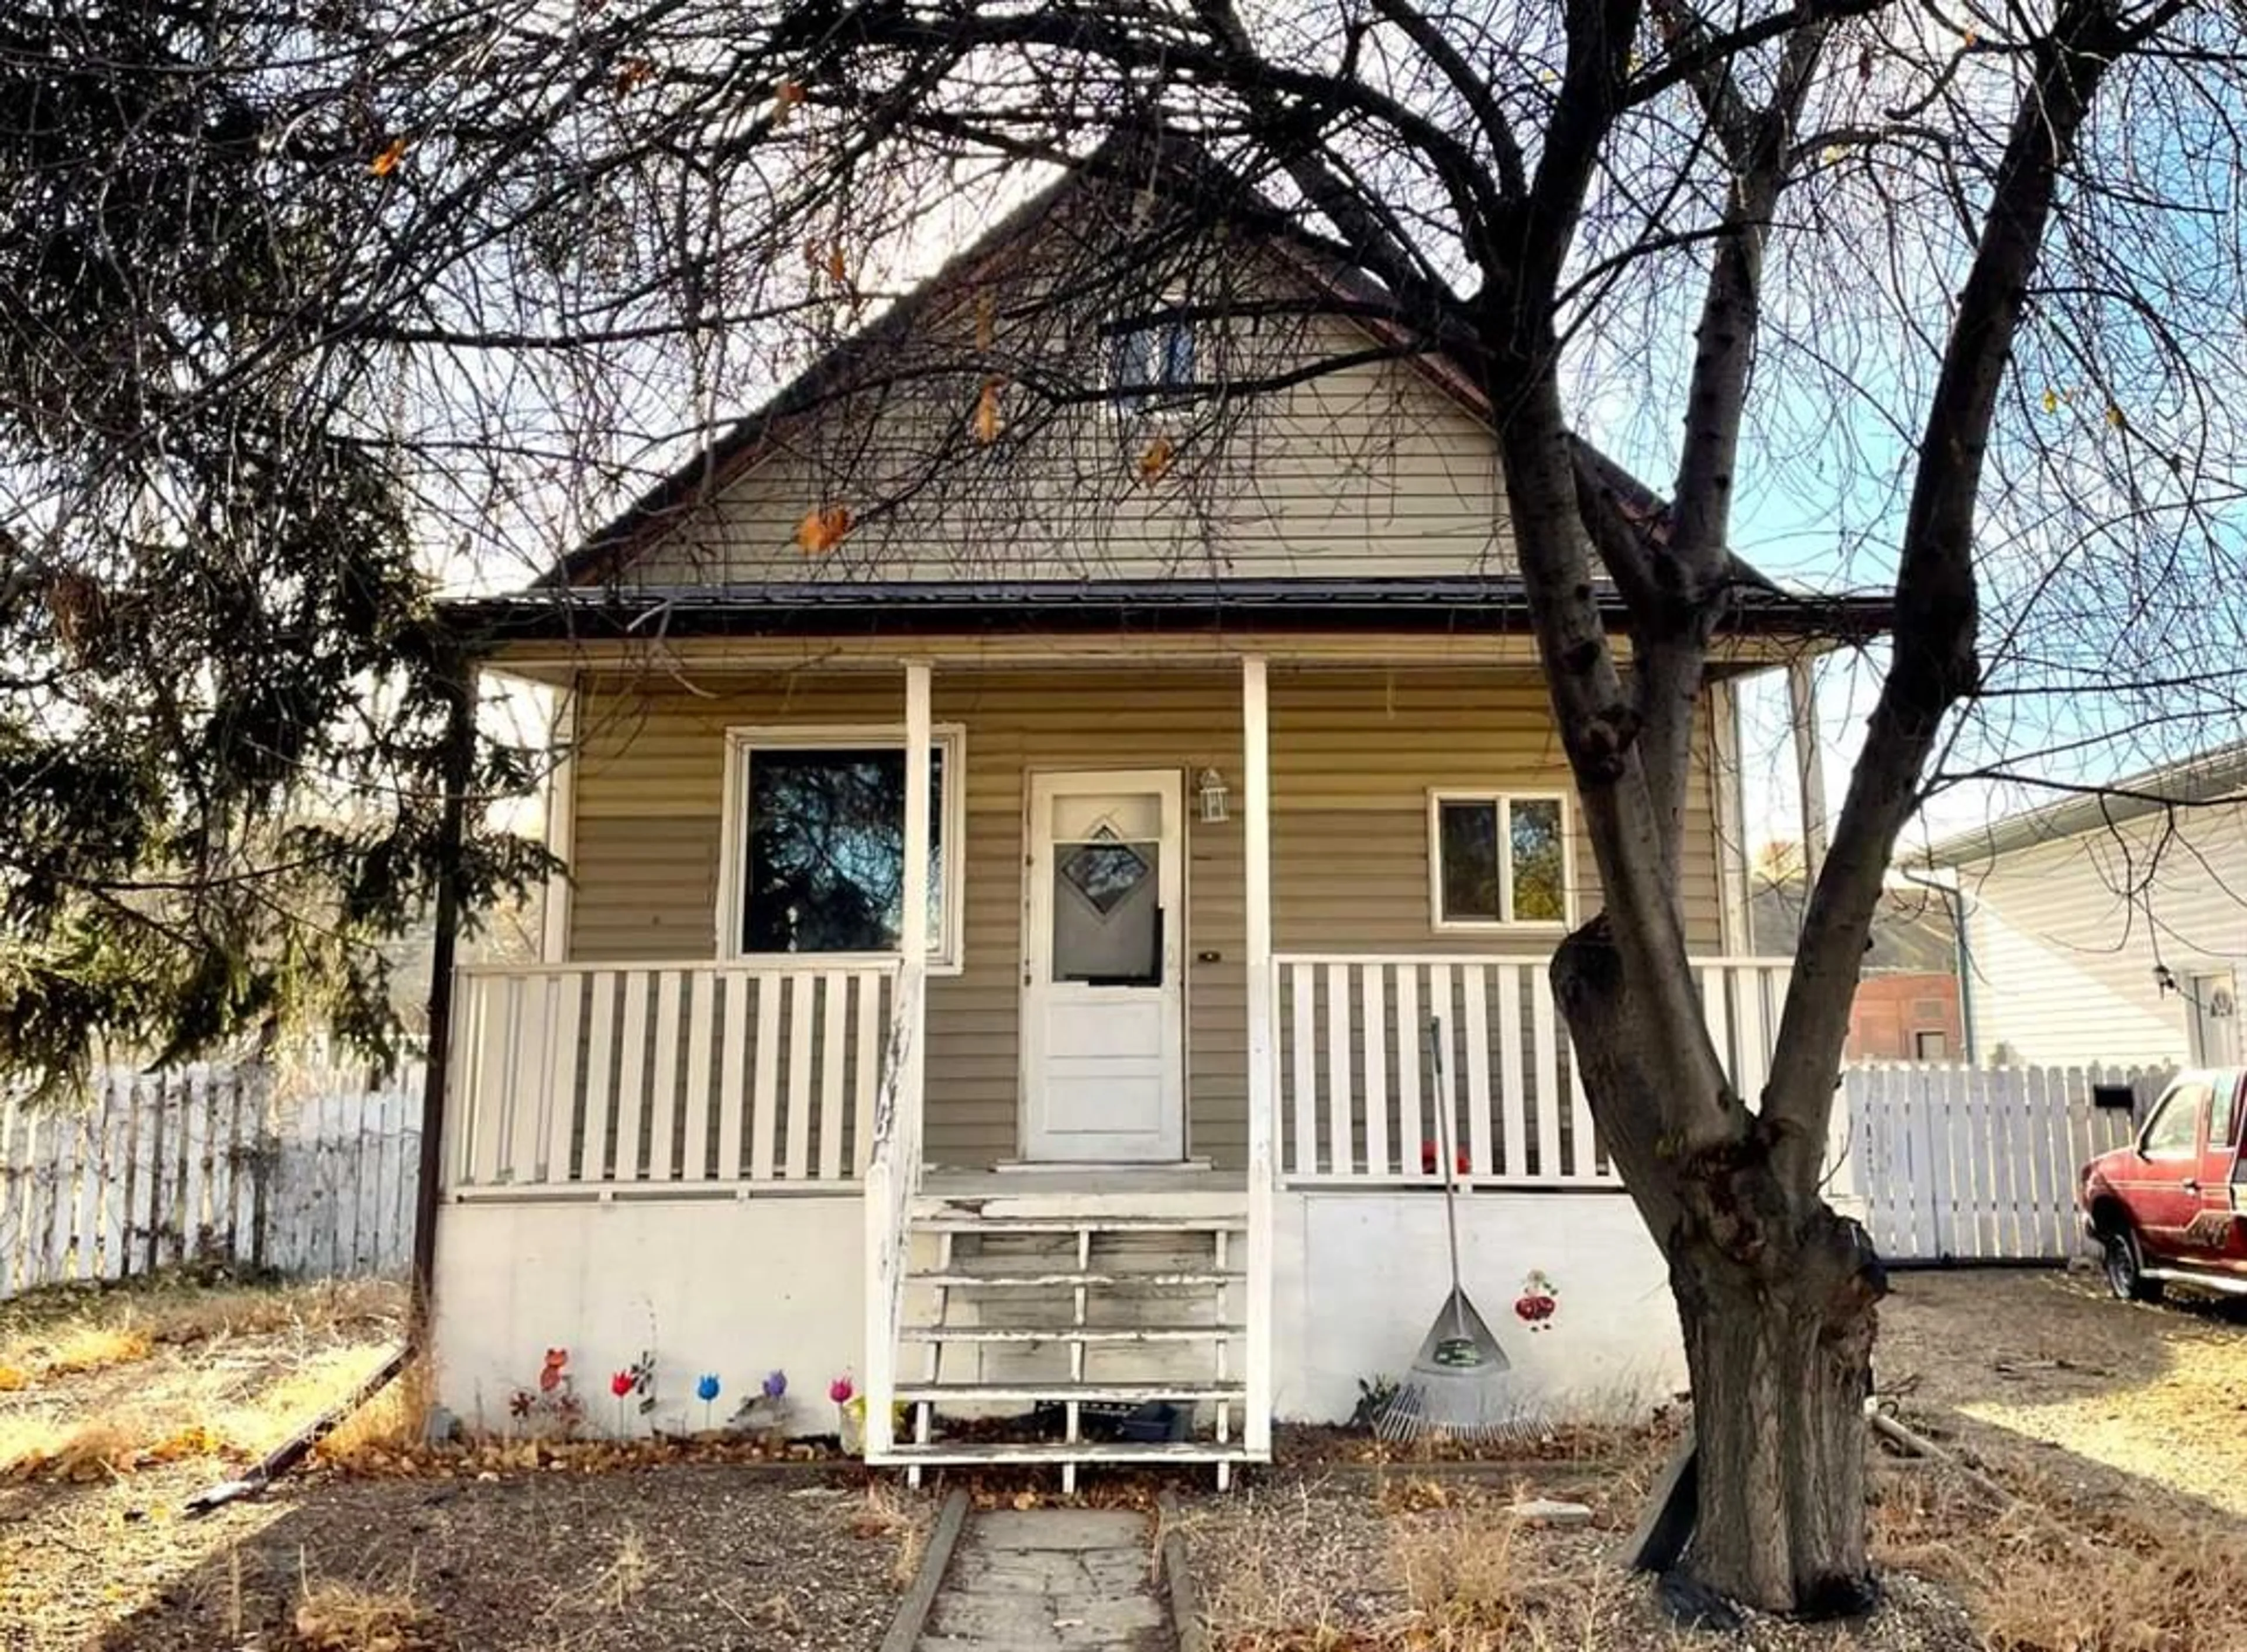
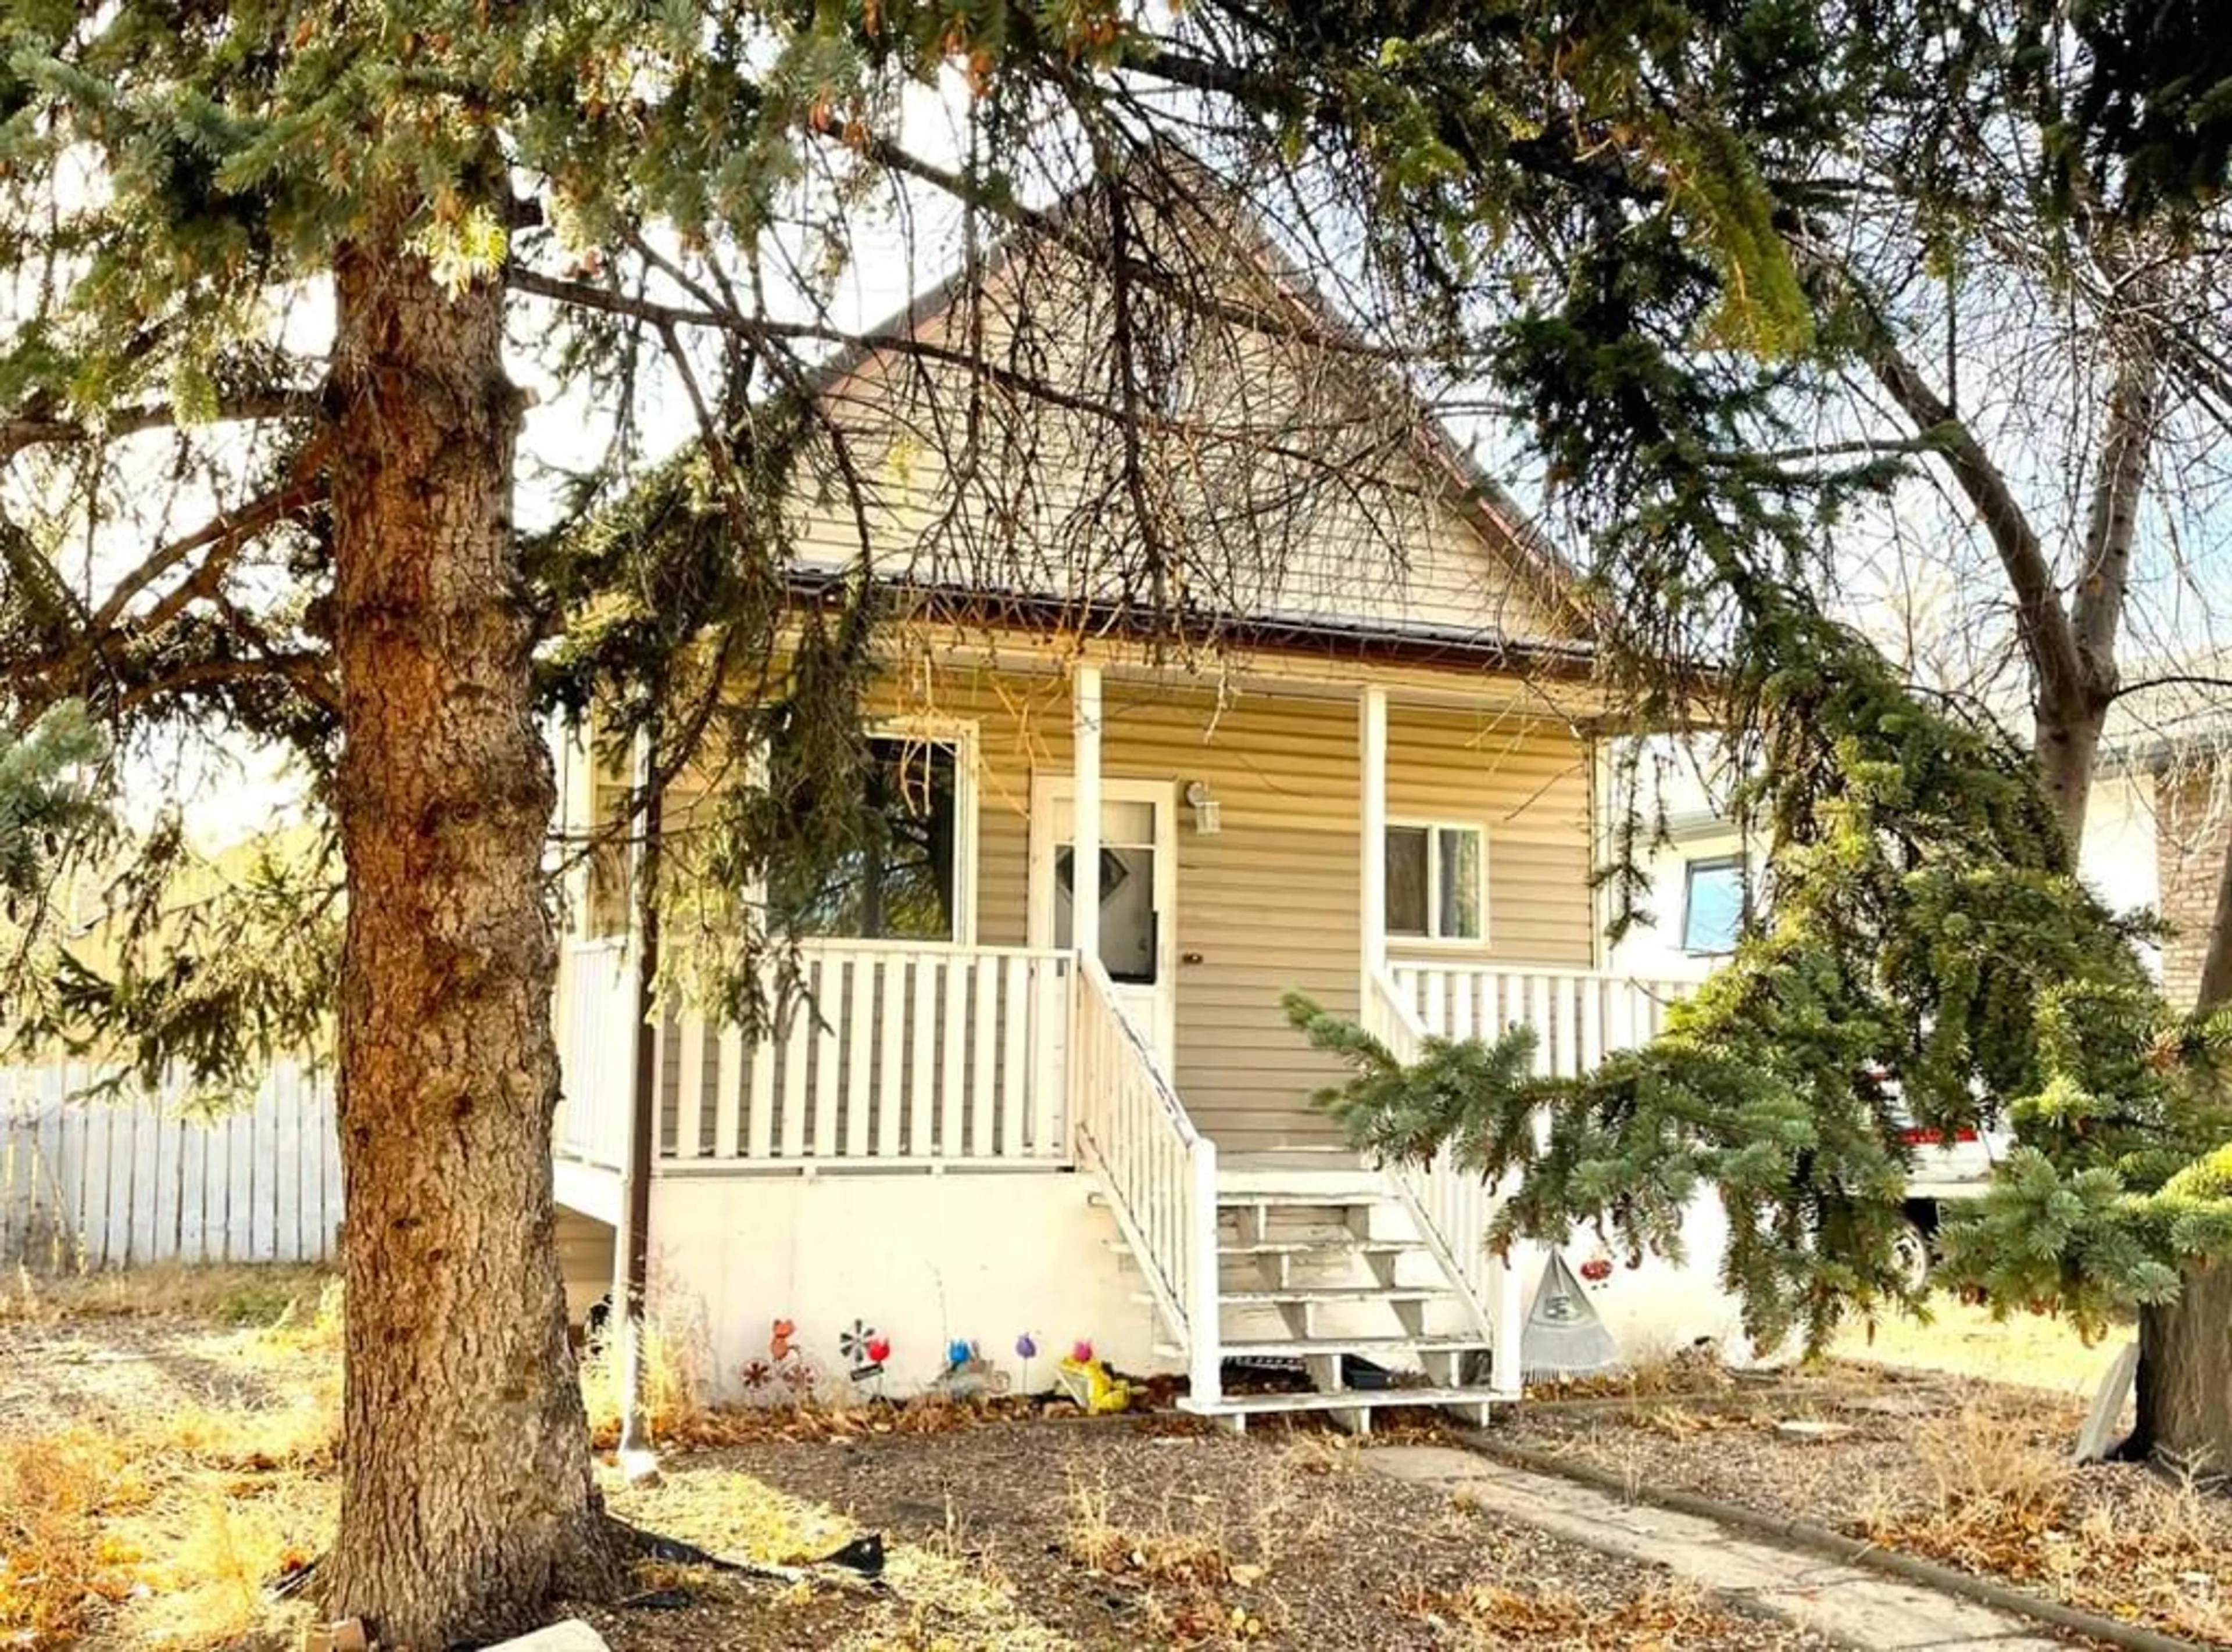
1061 Mill St, Medicine Hat, Alberta T1A 1Y2
Detached
1
1
~740.00 sqft
$•••,•••
$153,900Get pre-qualifiedPowered by Neo Mortgage
Detached
1
1
~740.00 sqft
Contact us about this property
Highlights
Estimated ValueThis is the price Wahi expects this property to sell for.
The calculation is powered by our Instant Home Value Estimate, which uses current market and property price trends to estimate your home’s value with a 90% accuracy rate.Not available
Price/Sqft$207/sqft
Est. Mortgage$661/mo
Tax Amount (2024)$1,501/yr
Days On Market176 days
Description
Storey and a half 2 bed 2 bath with lots of potential and a 36 X 60 ft greenhouse / workshop just outside the back door . 200 amp service and a 10 X 30 basement underneath . 2 overhead radiant heaters , water service and a bathroom . Seller to provide funds for title insurance in lieu of an RPR
Property Details
StyleBungalow
View-
Age of property1910
SqFt~740.00 SqFt
Lot Size-
Parking Spaces3
MLS ®NumberA2164904
Community NameSouth Flats
Data SourcePILLAR 9
Listing byMAXWELL CANYON CREEK
Interior
Features
Heating: Forced Air,Natural Gas
Basement: Full,Partially Finished
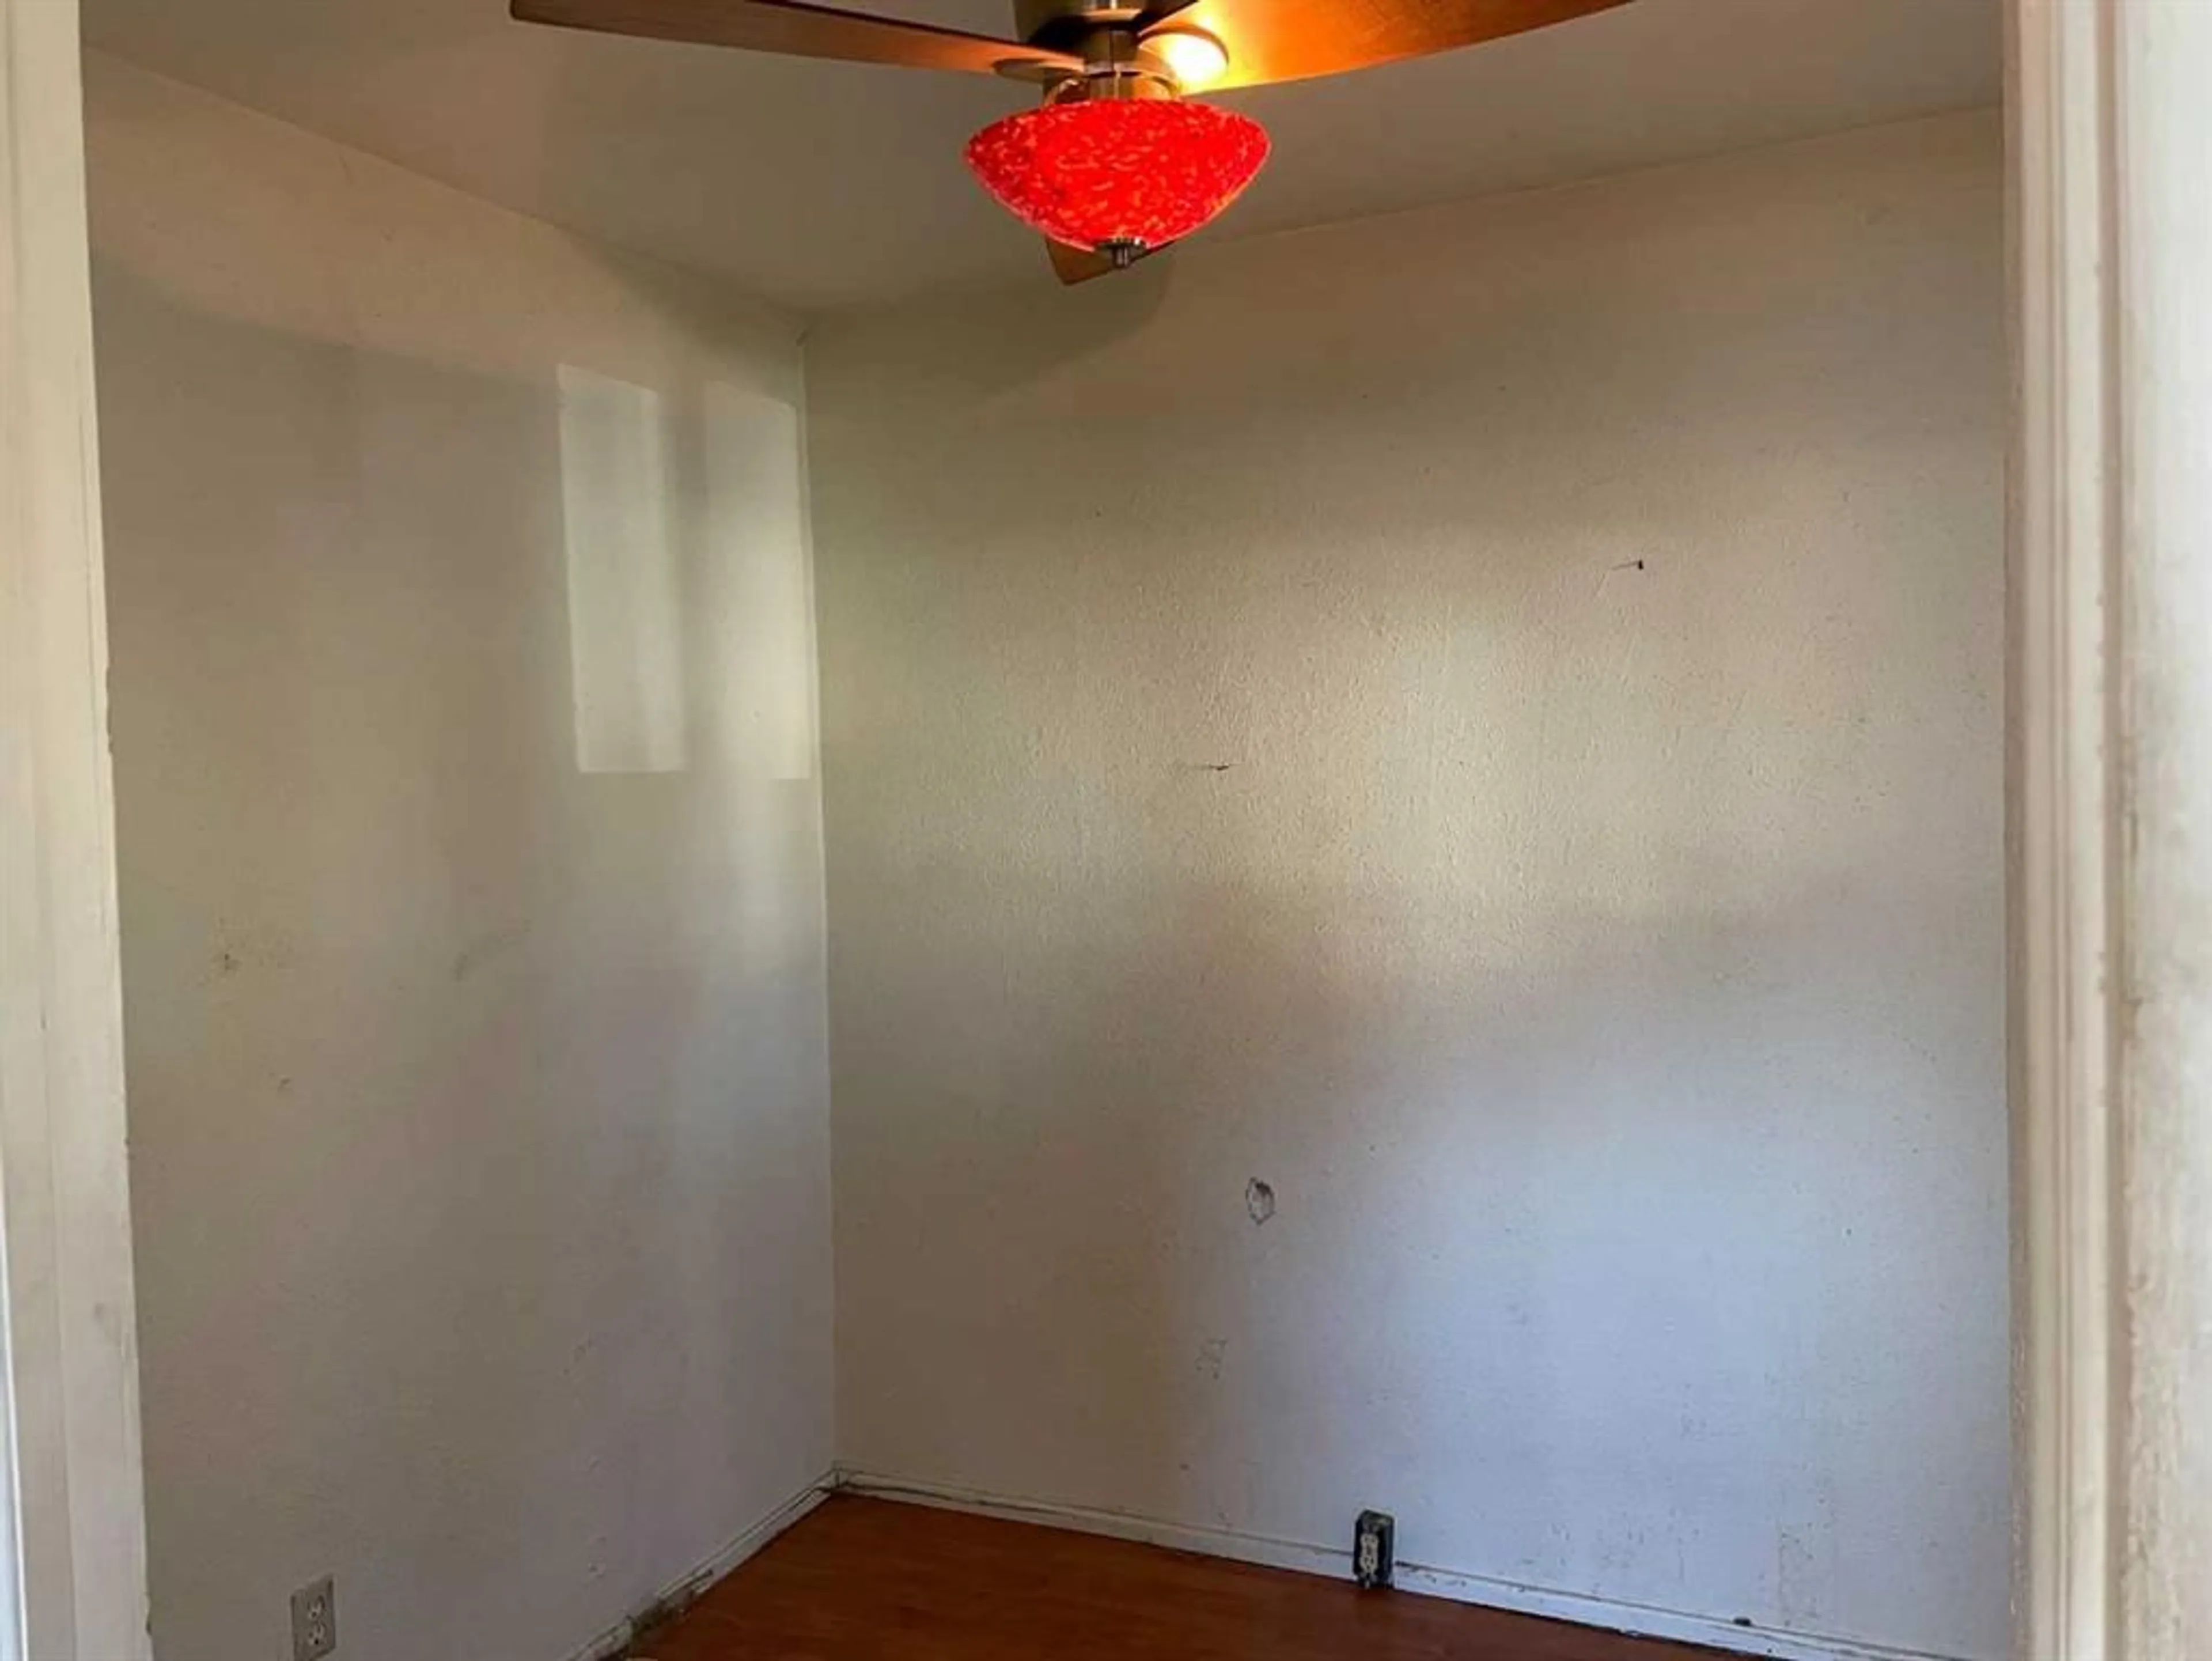
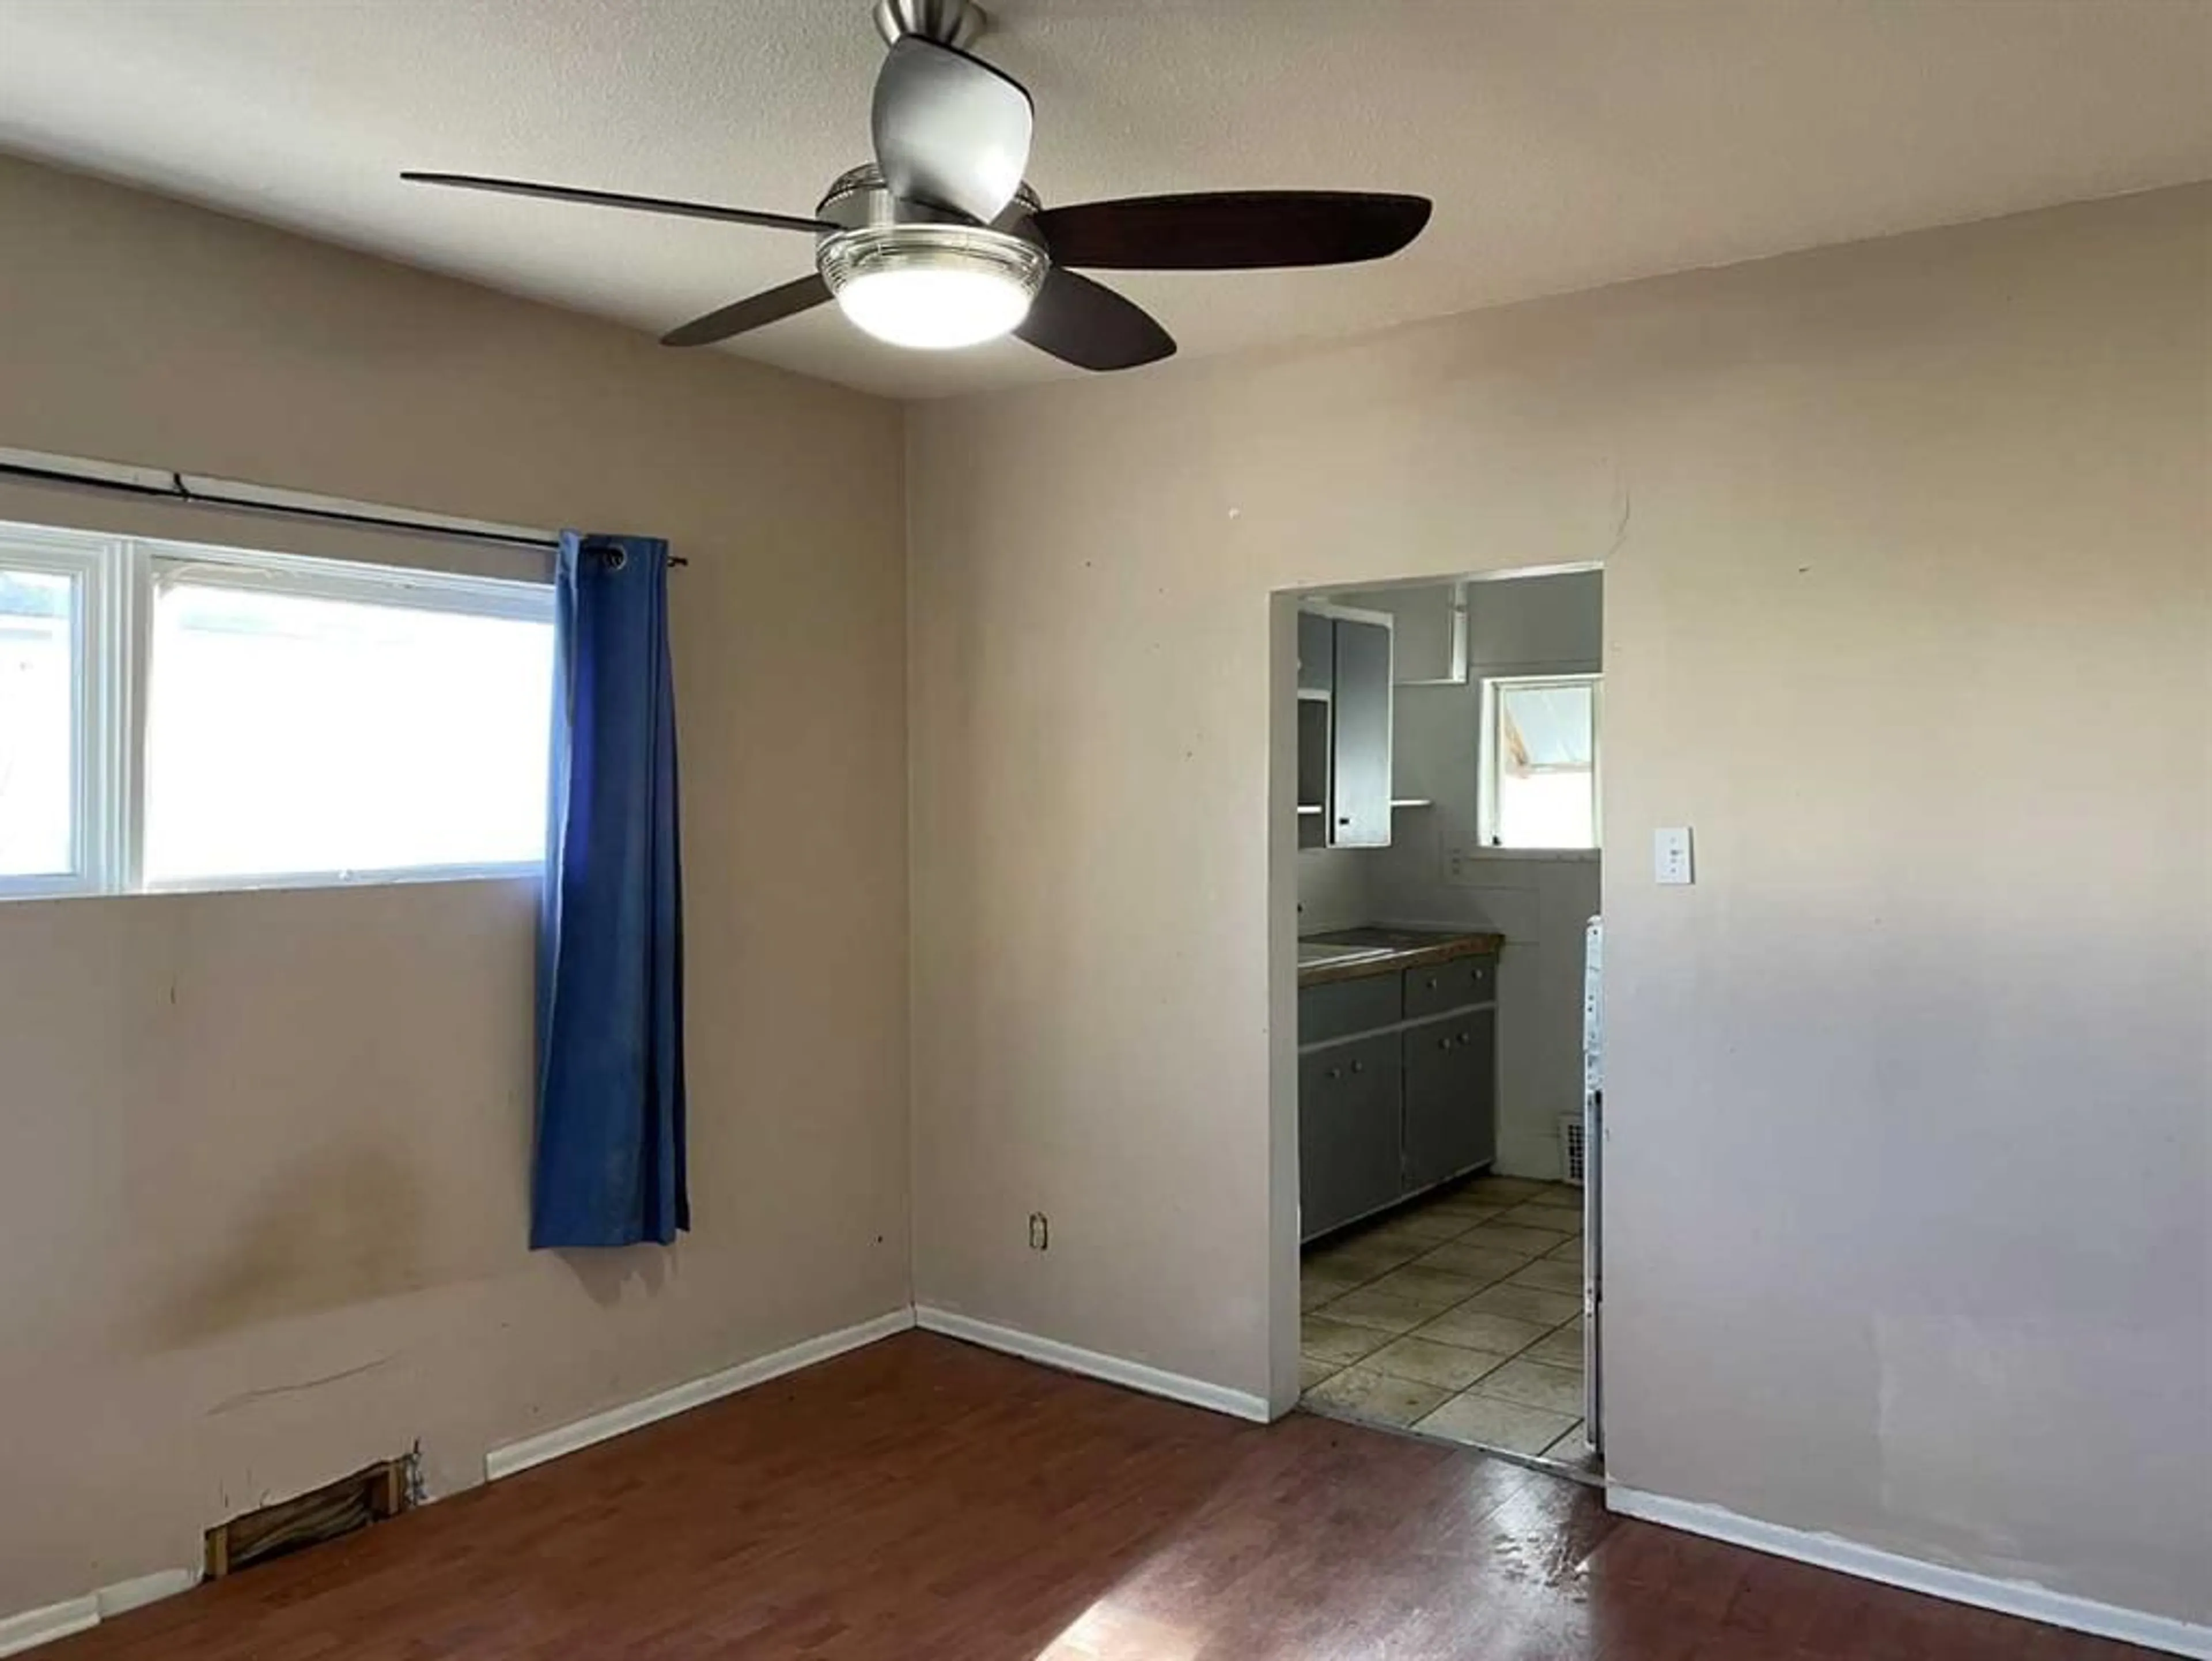
Main Floor
Living Room
12`6" x 11`0"Den
8`0" x 10`0"Kitchen
8`0" x 13`0"3pc Bathroom
6`0" x 5`0"Exterior
Features
Patio: Deck
Parking
Garage spaces 5
Garage type -
Total parking spaces 3
Property History
Nov 14, 2024
ListedActive
$153,900
176 days on market 21Listing by pillar 9®
21Property listed by MAXWELL CANYON CREEK, Brokerage

Interested in this property?Get in touch to get the inside scoop.
