363 Duncombe Dr, Burlington, Ontario L7L 4M2
Contact us about this property
Highlights
Estimated valueThis is the price Wahi expects this property to sell for.
The calculation is powered by our Instant Home Value Estimate, which uses current market and property price trends to estimate your home’s value with a 90% accuracy rate.Not available
Price/Sqft$1,169/sqft
Monthly cost
Open Calculator
Description
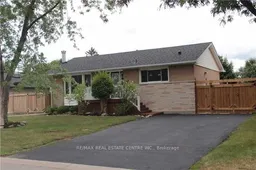
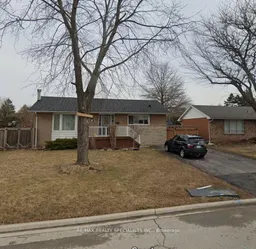
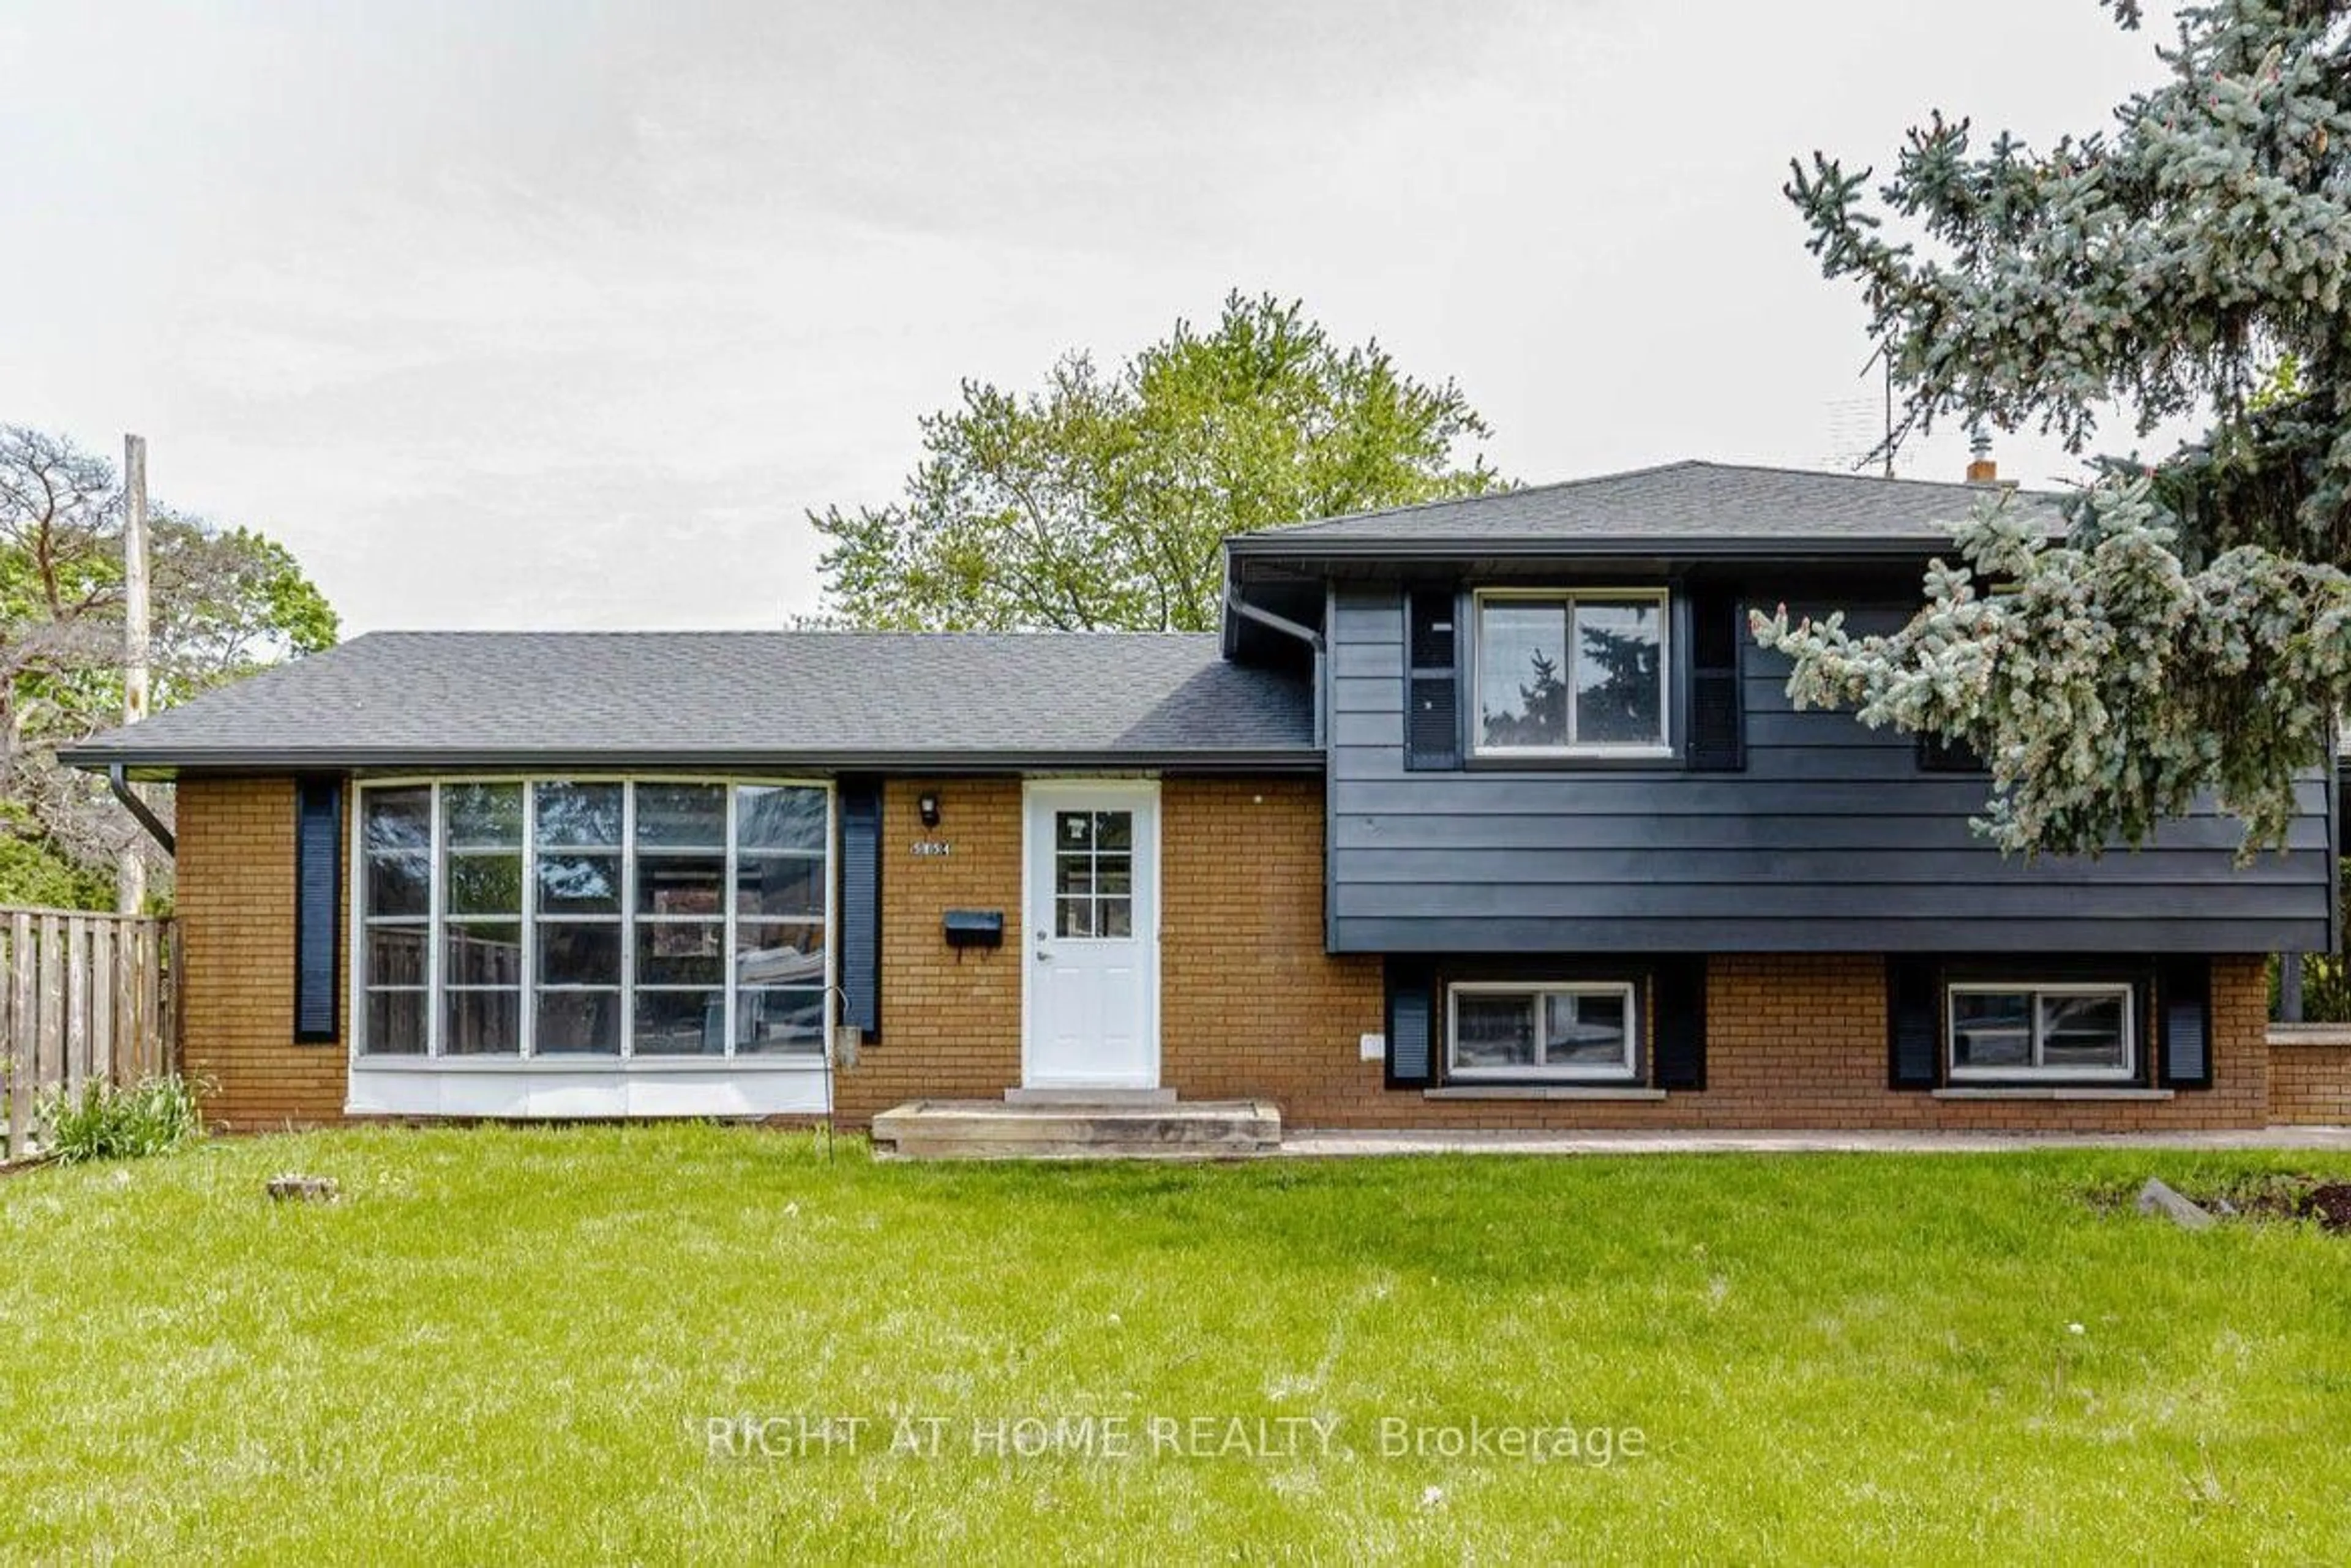
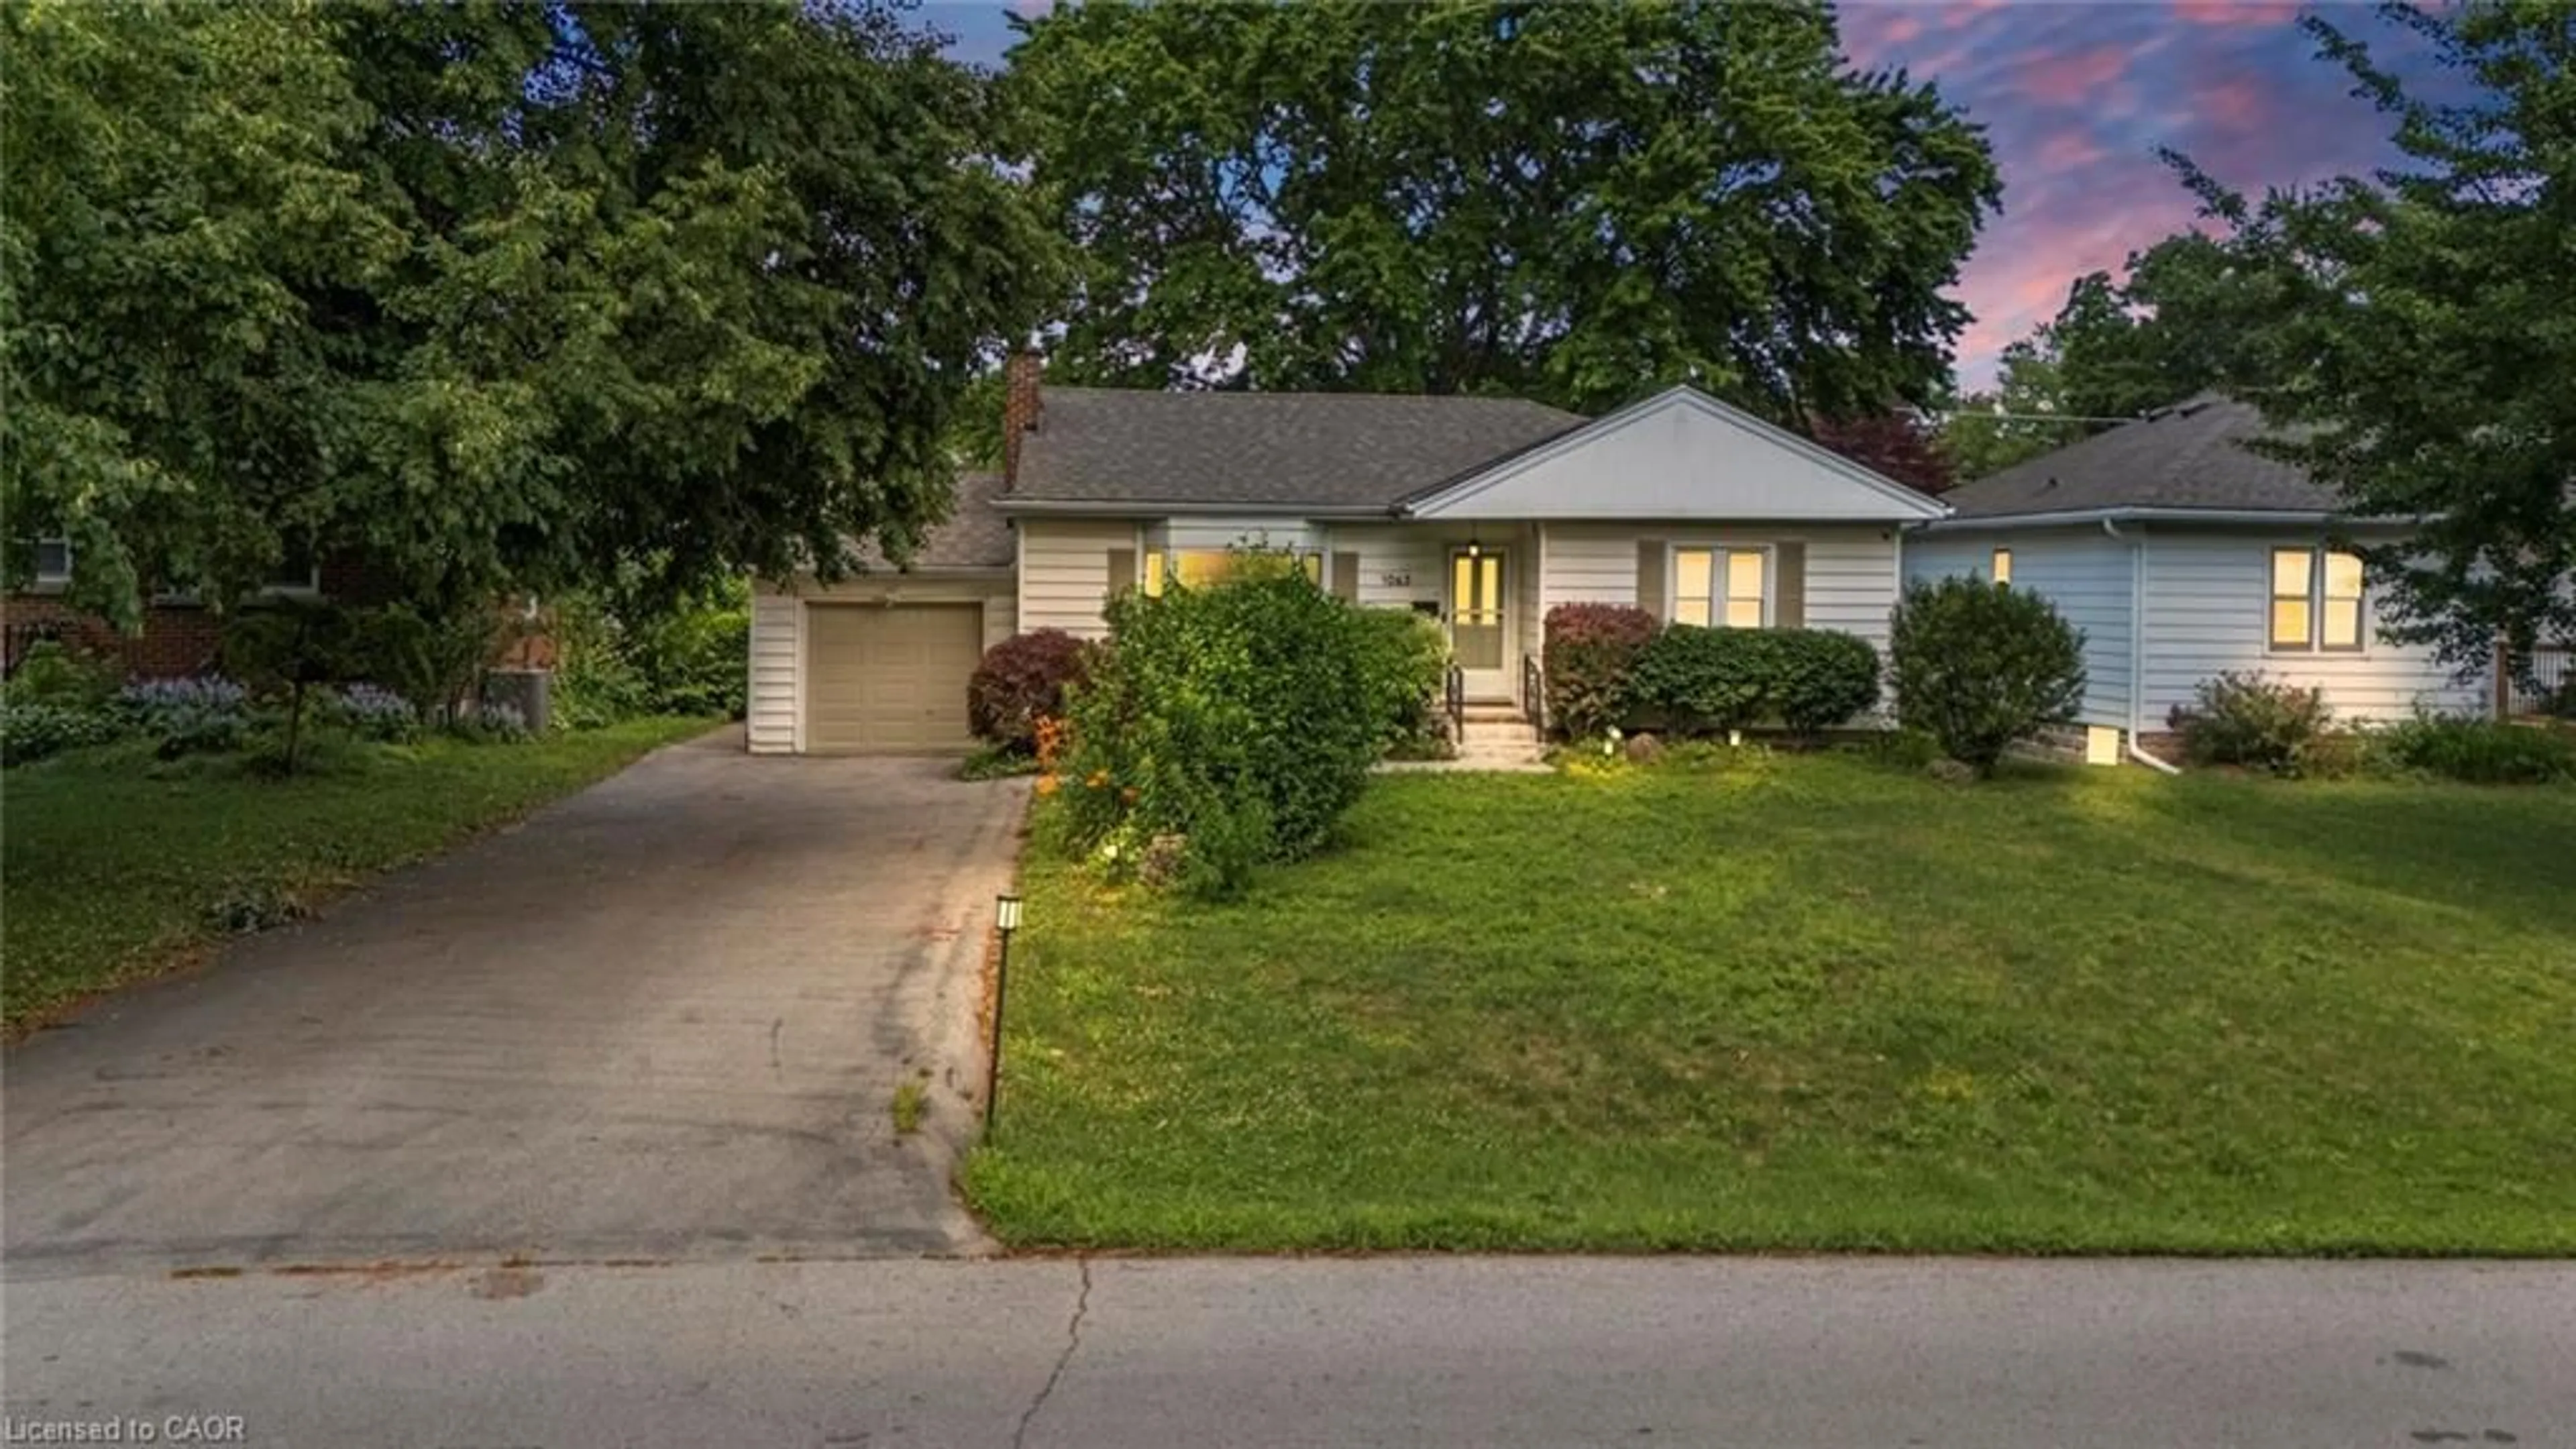
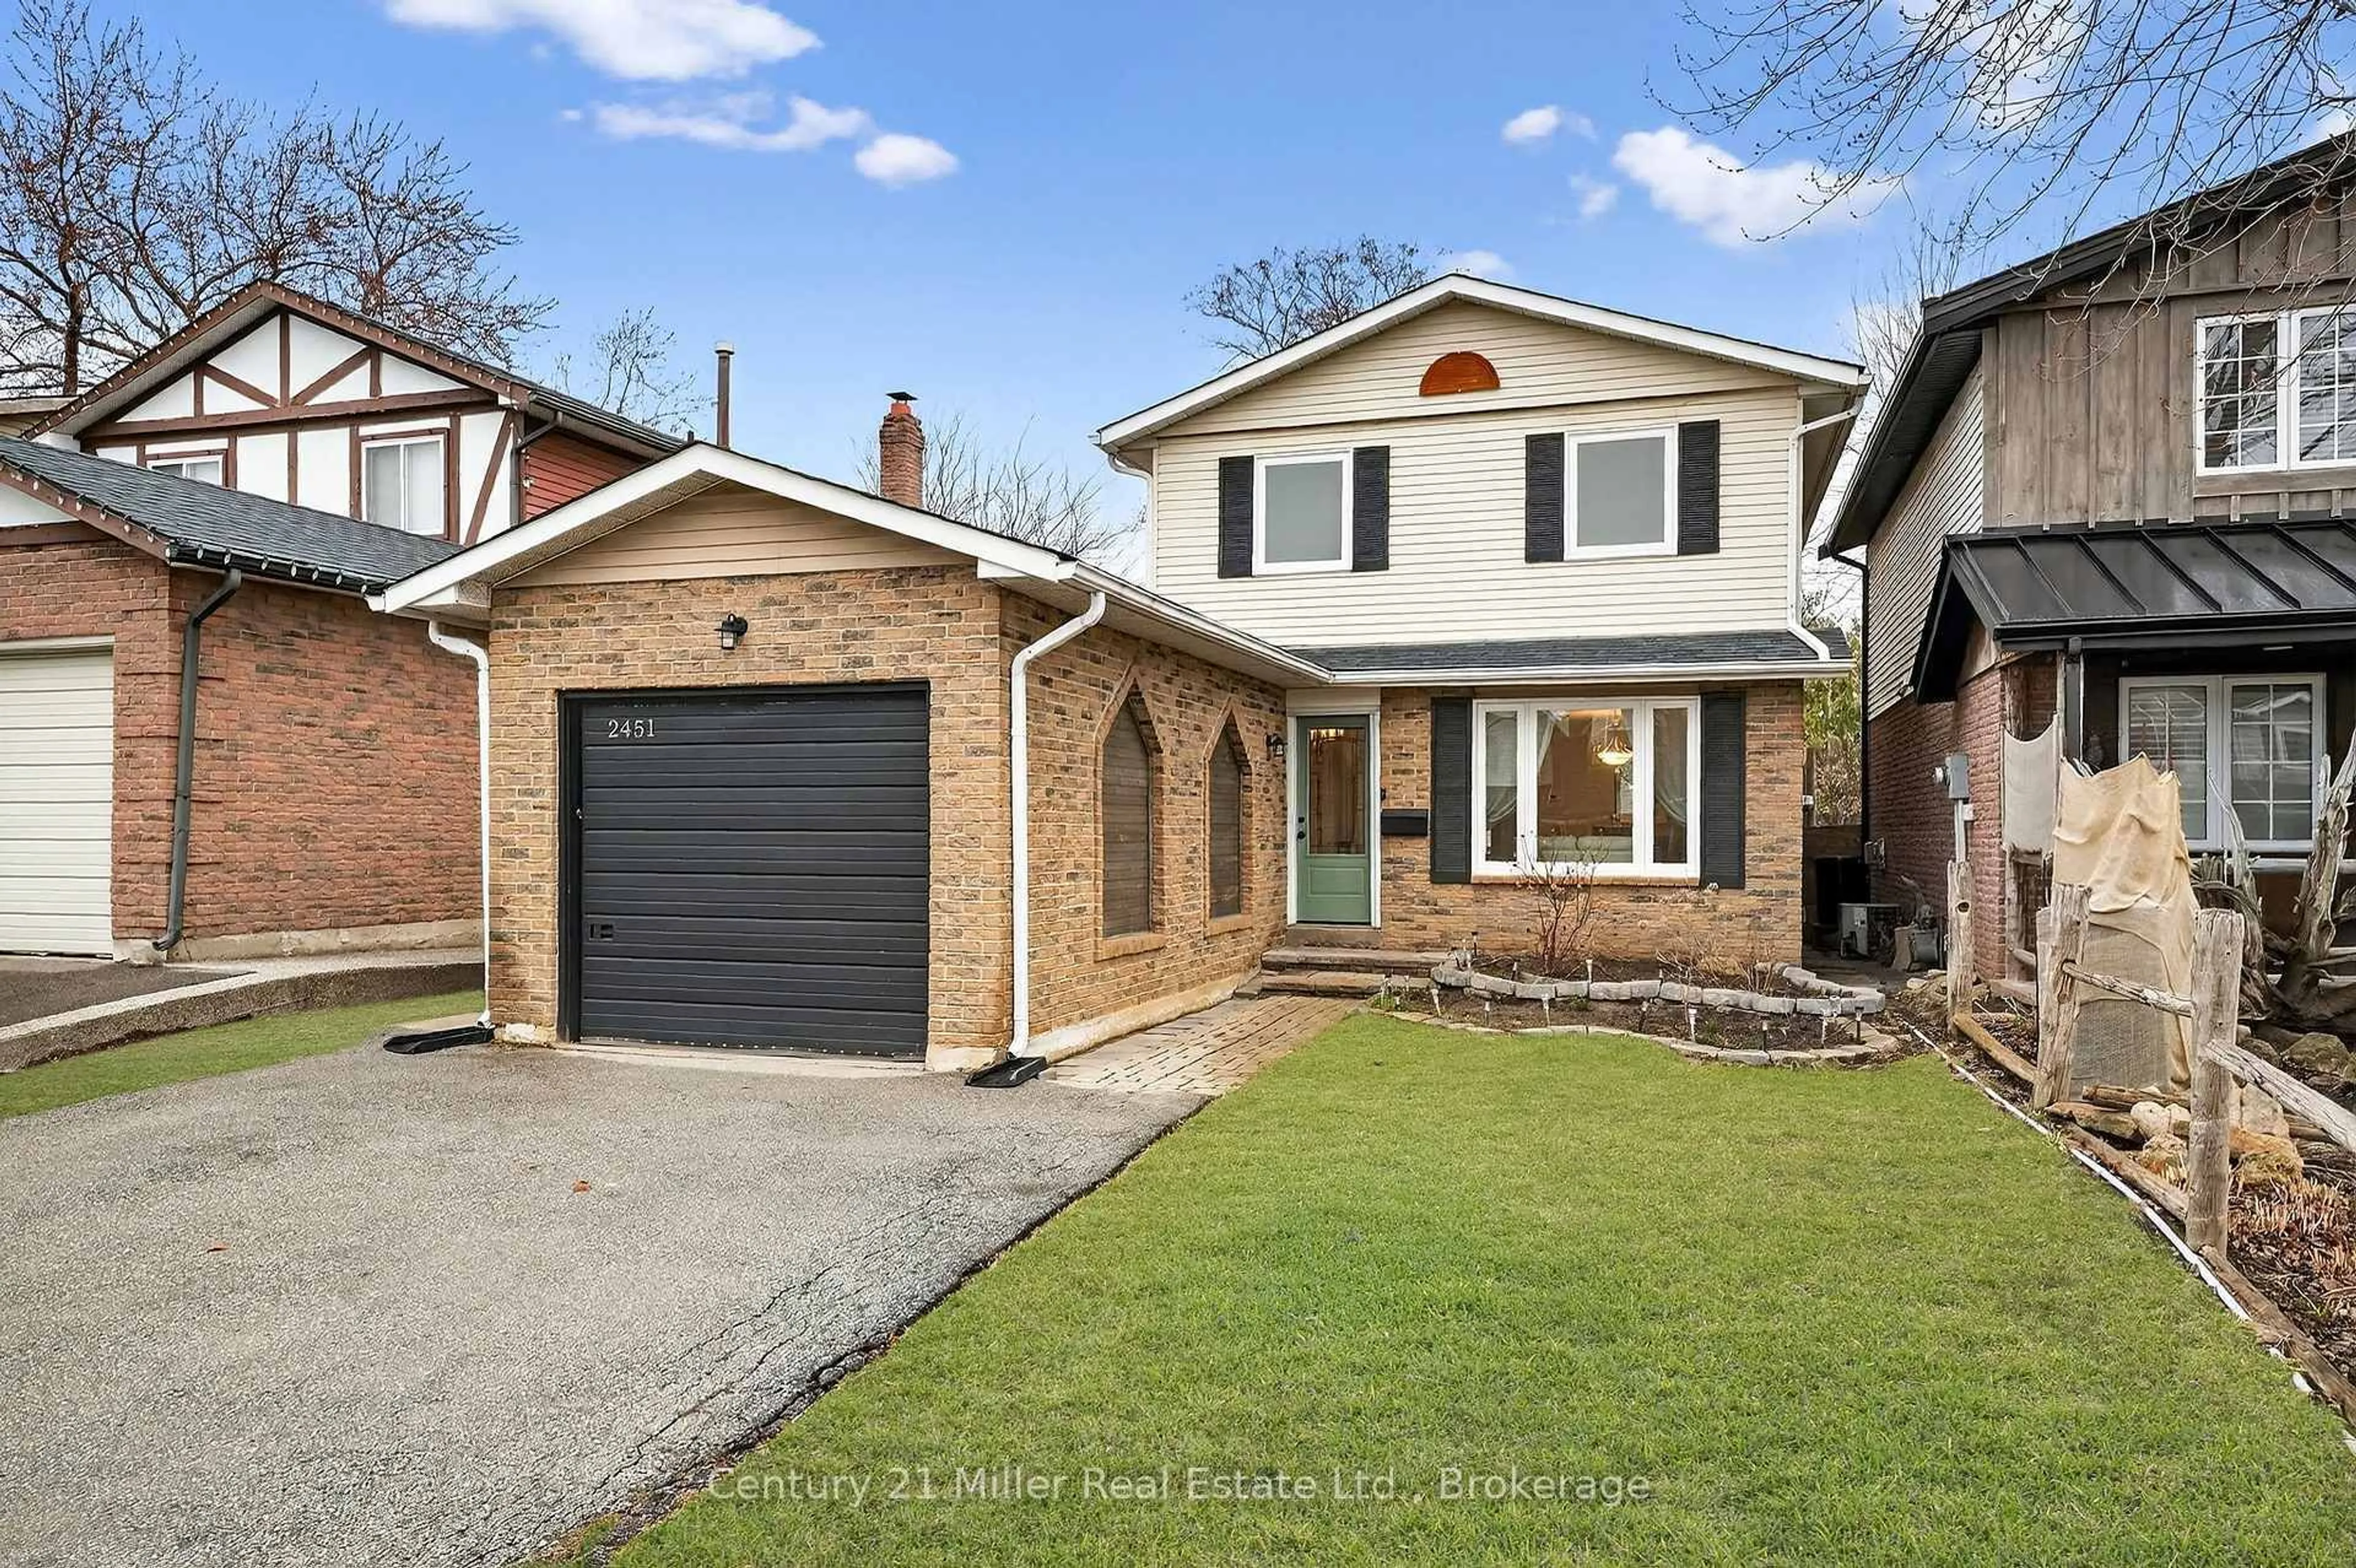
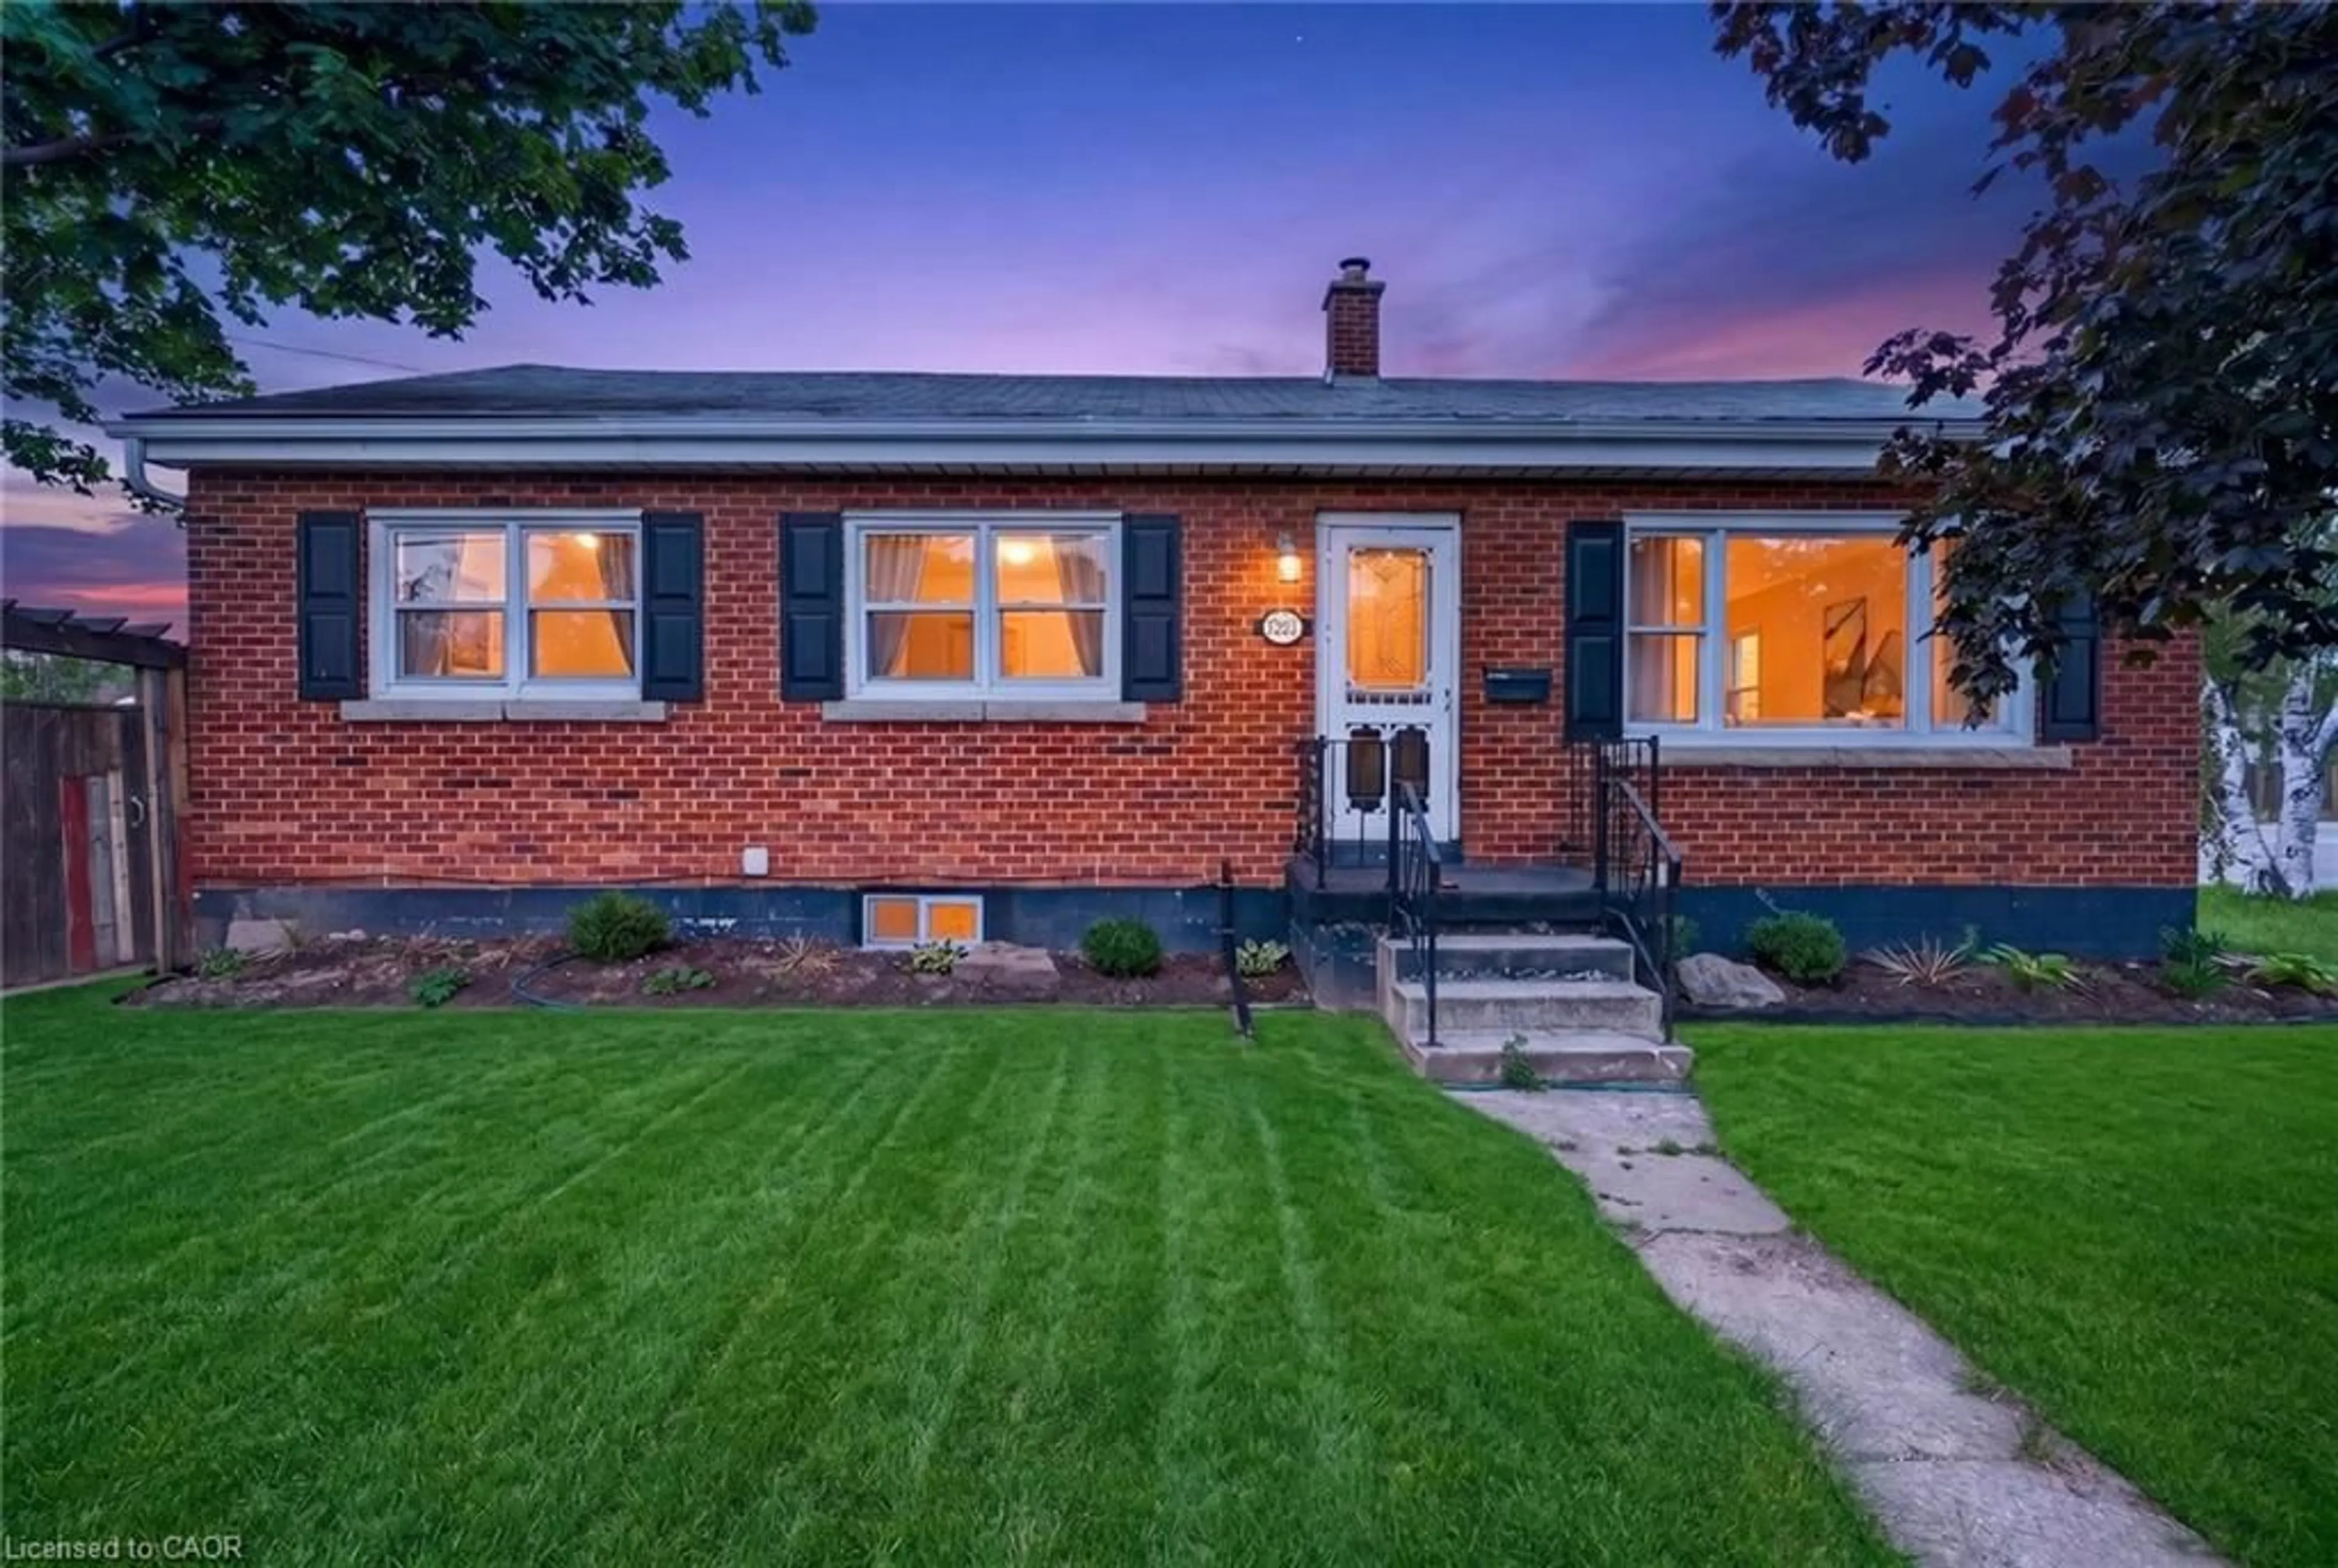
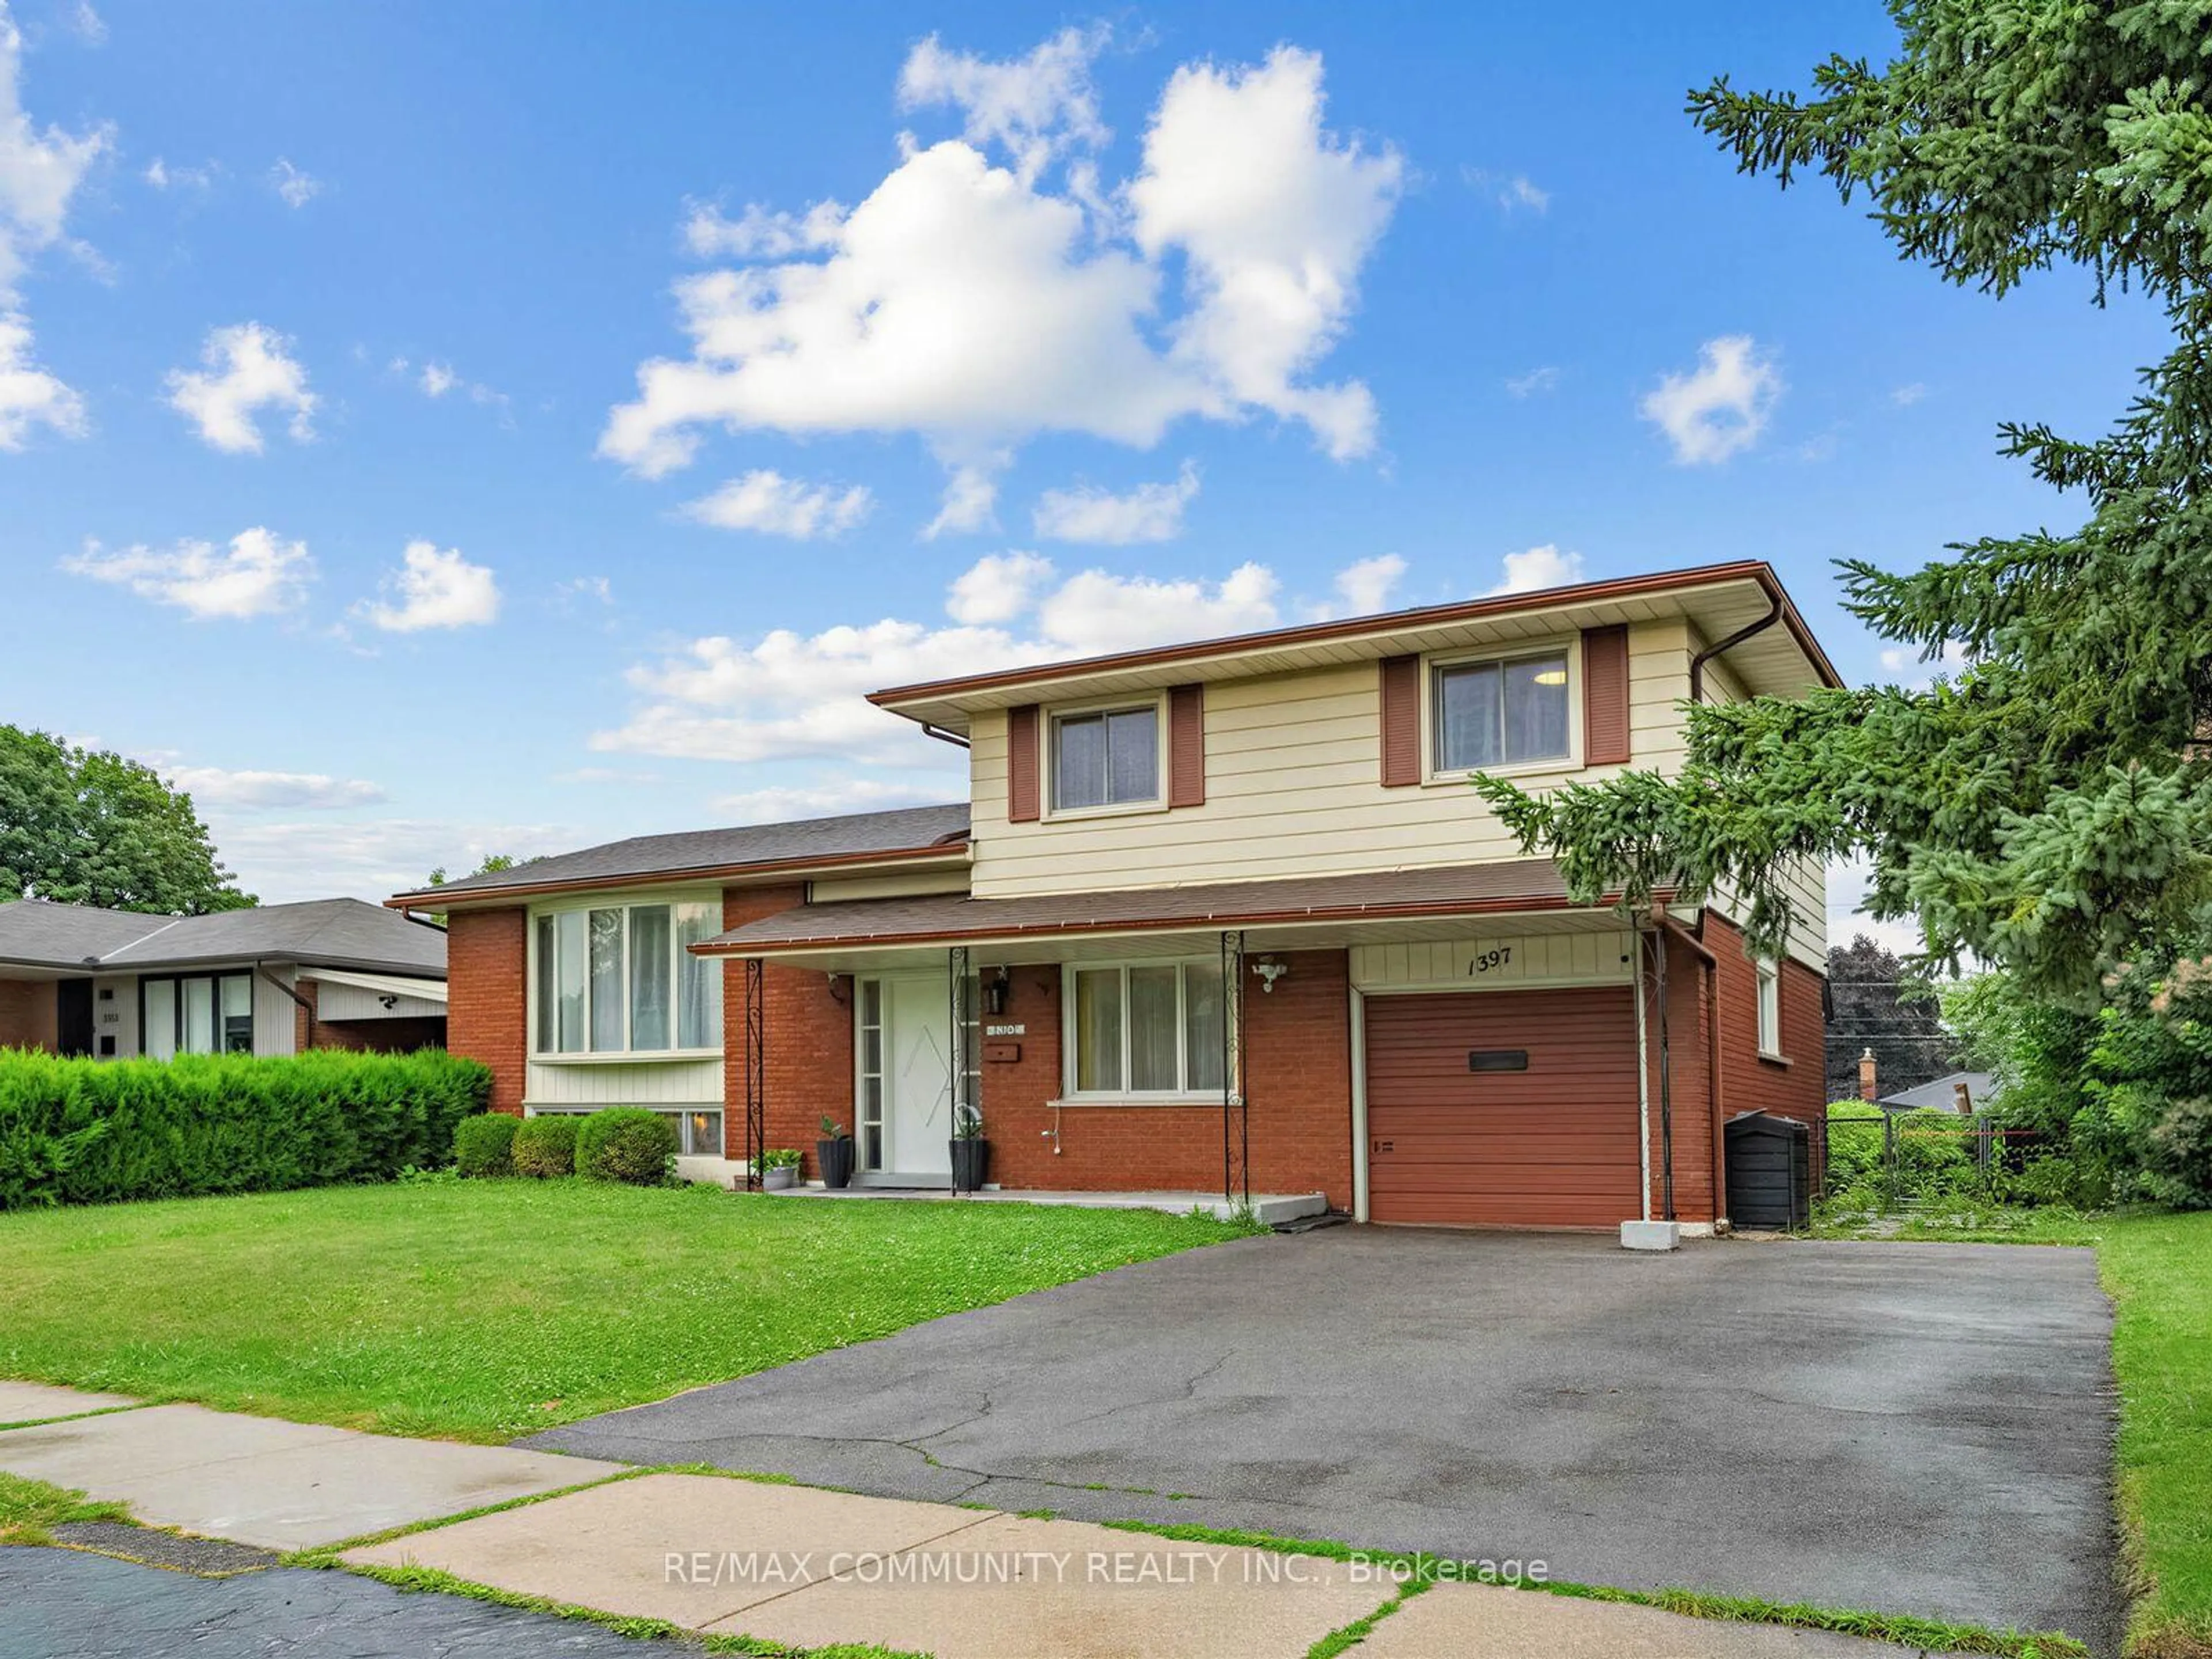
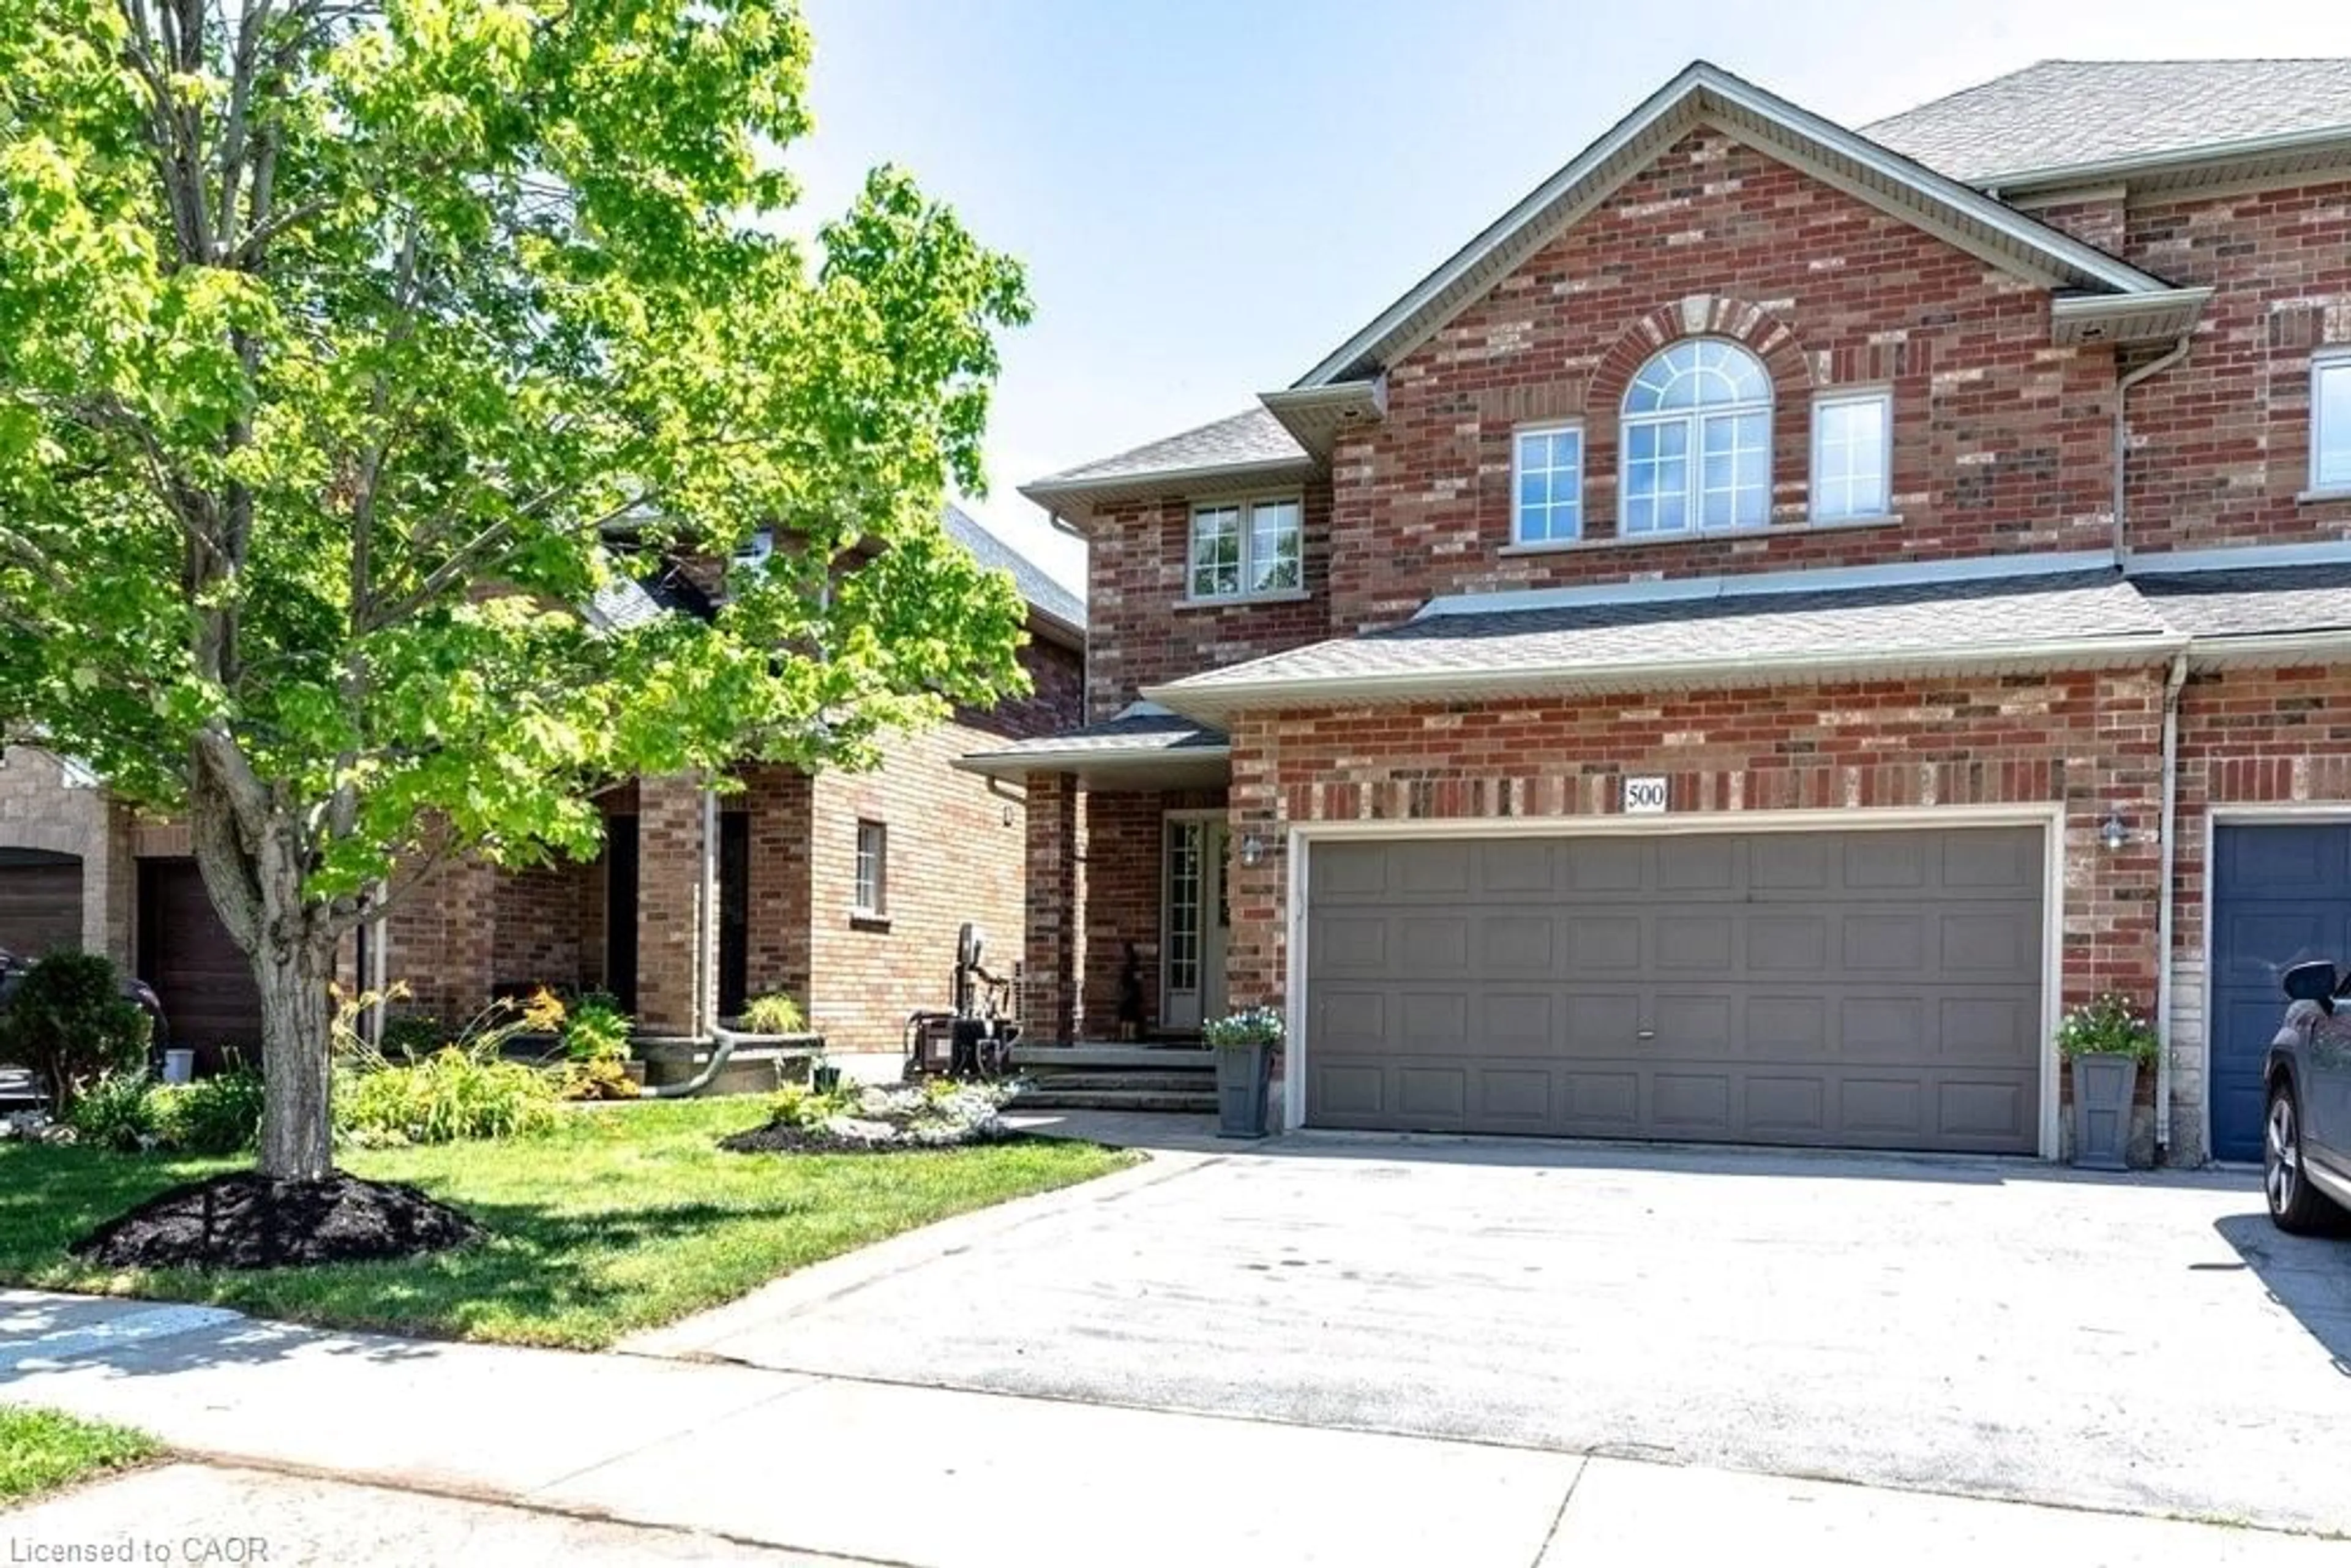
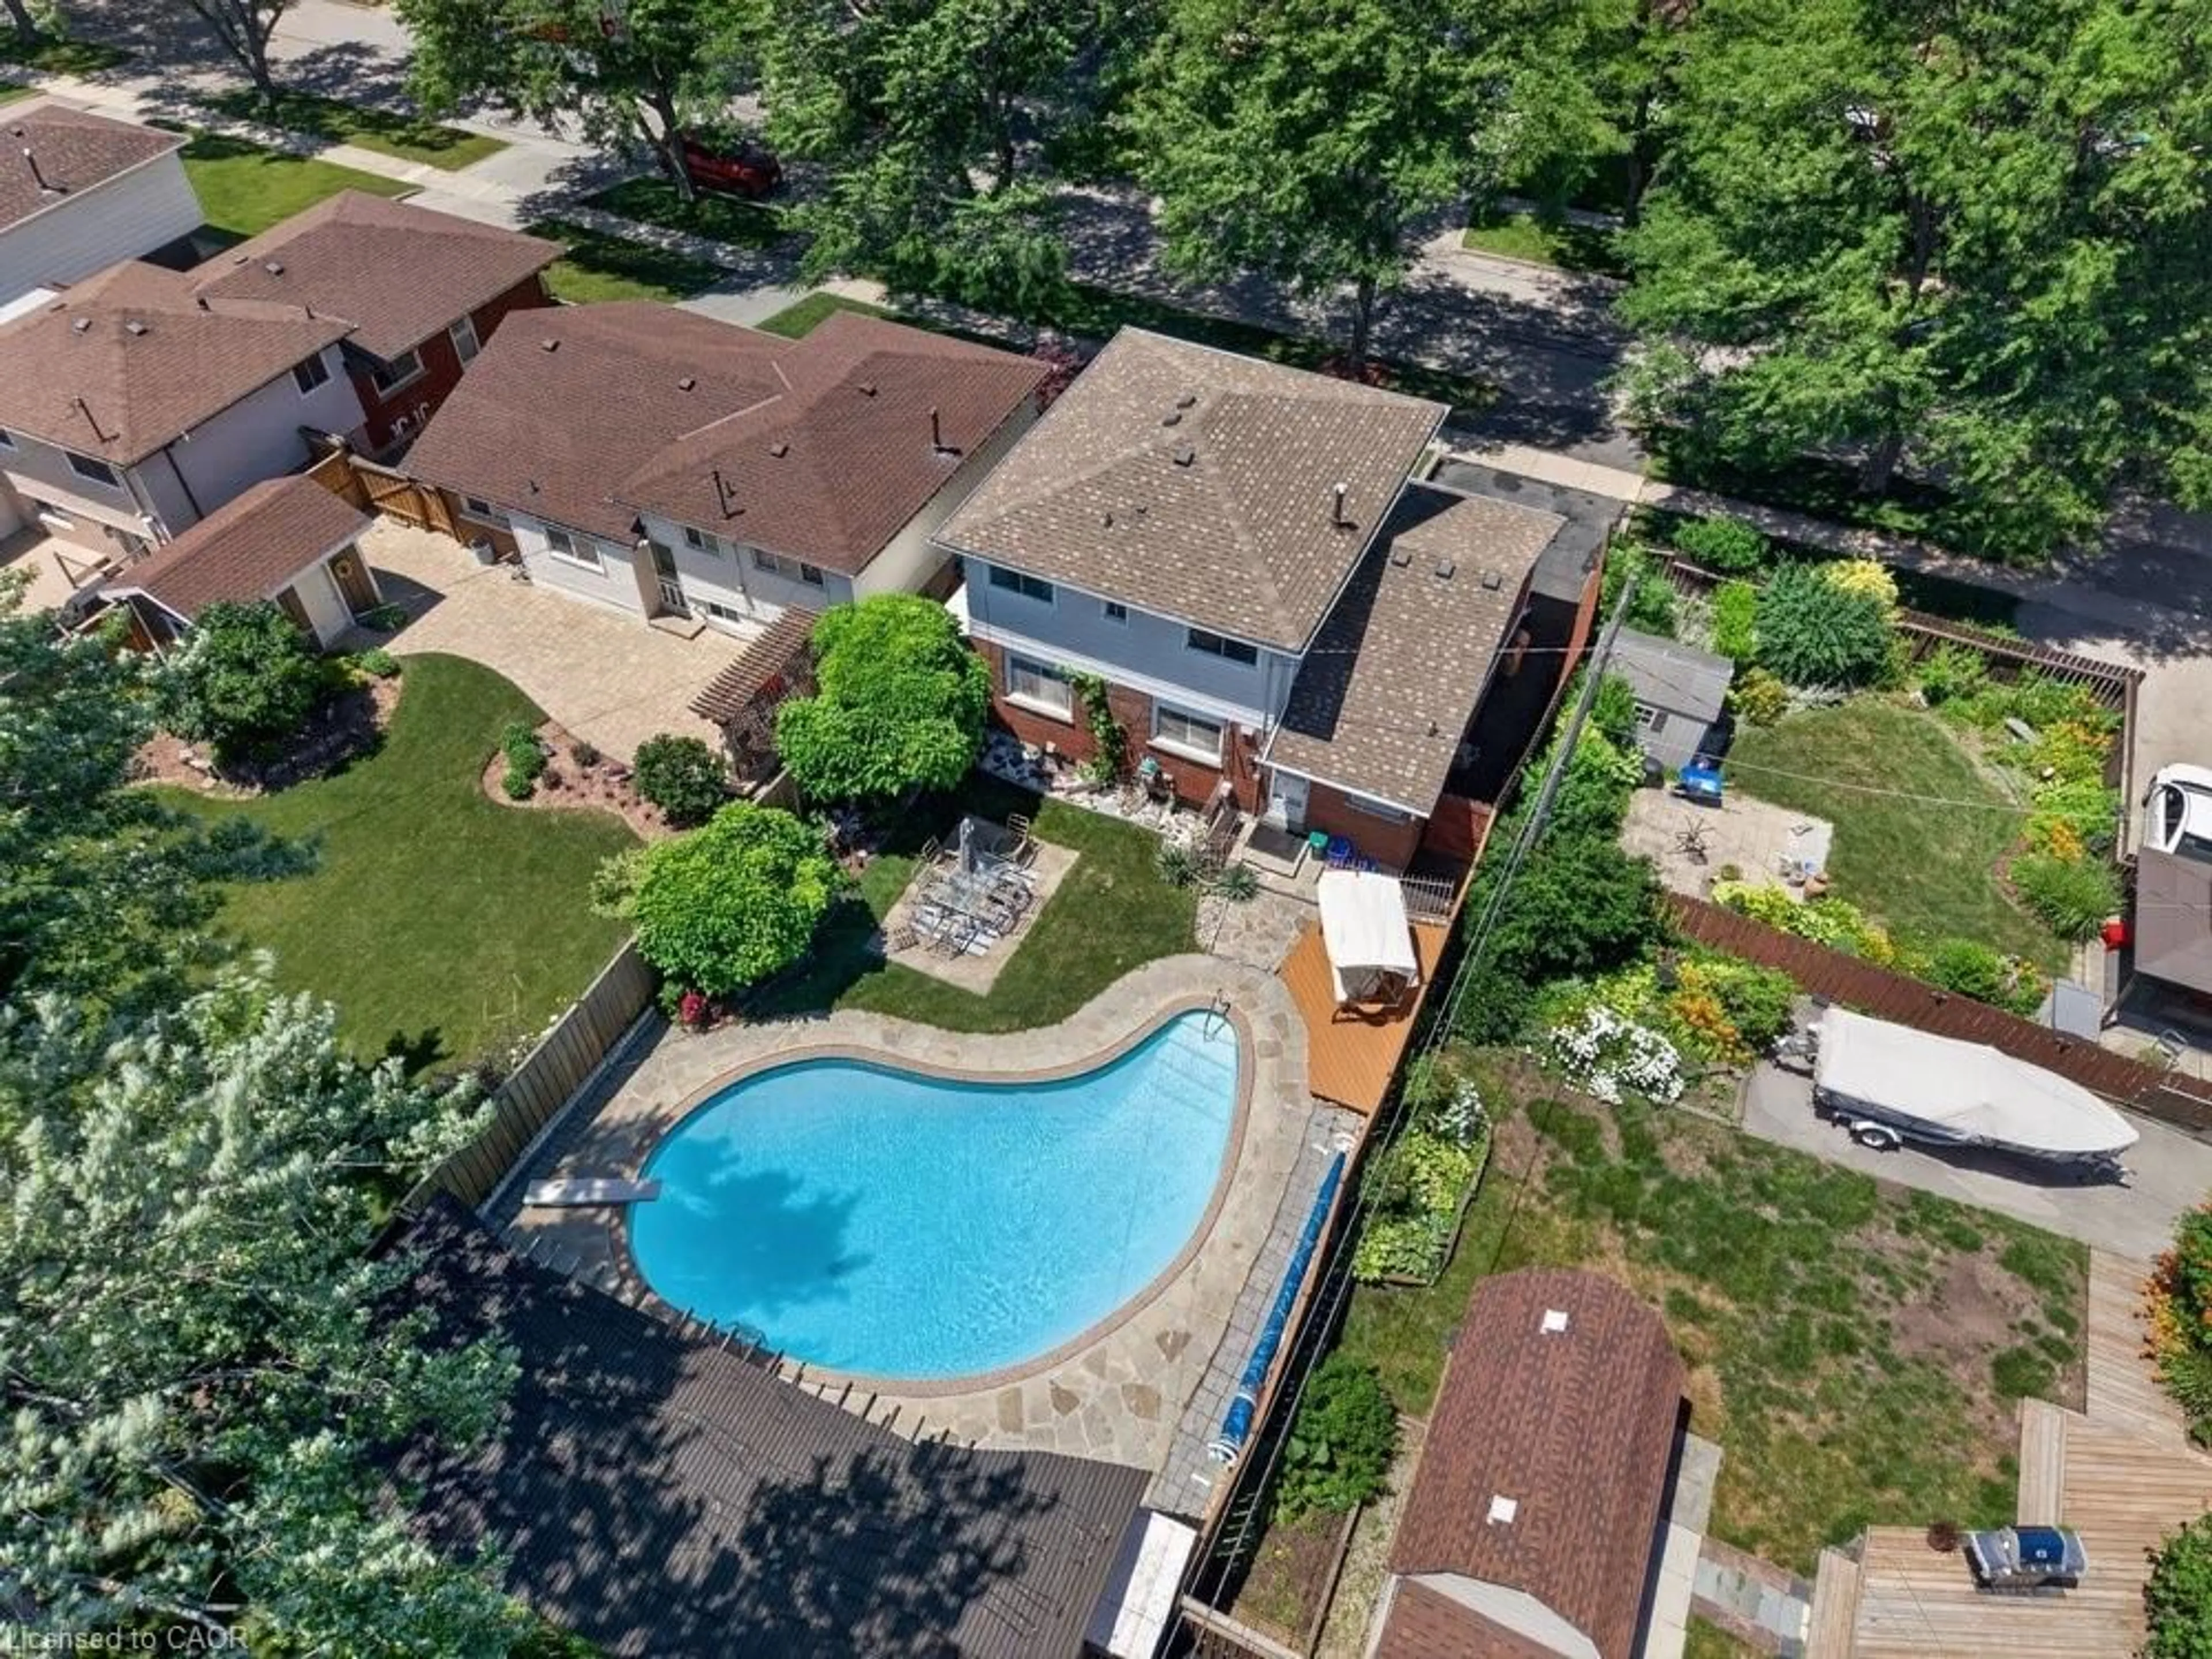
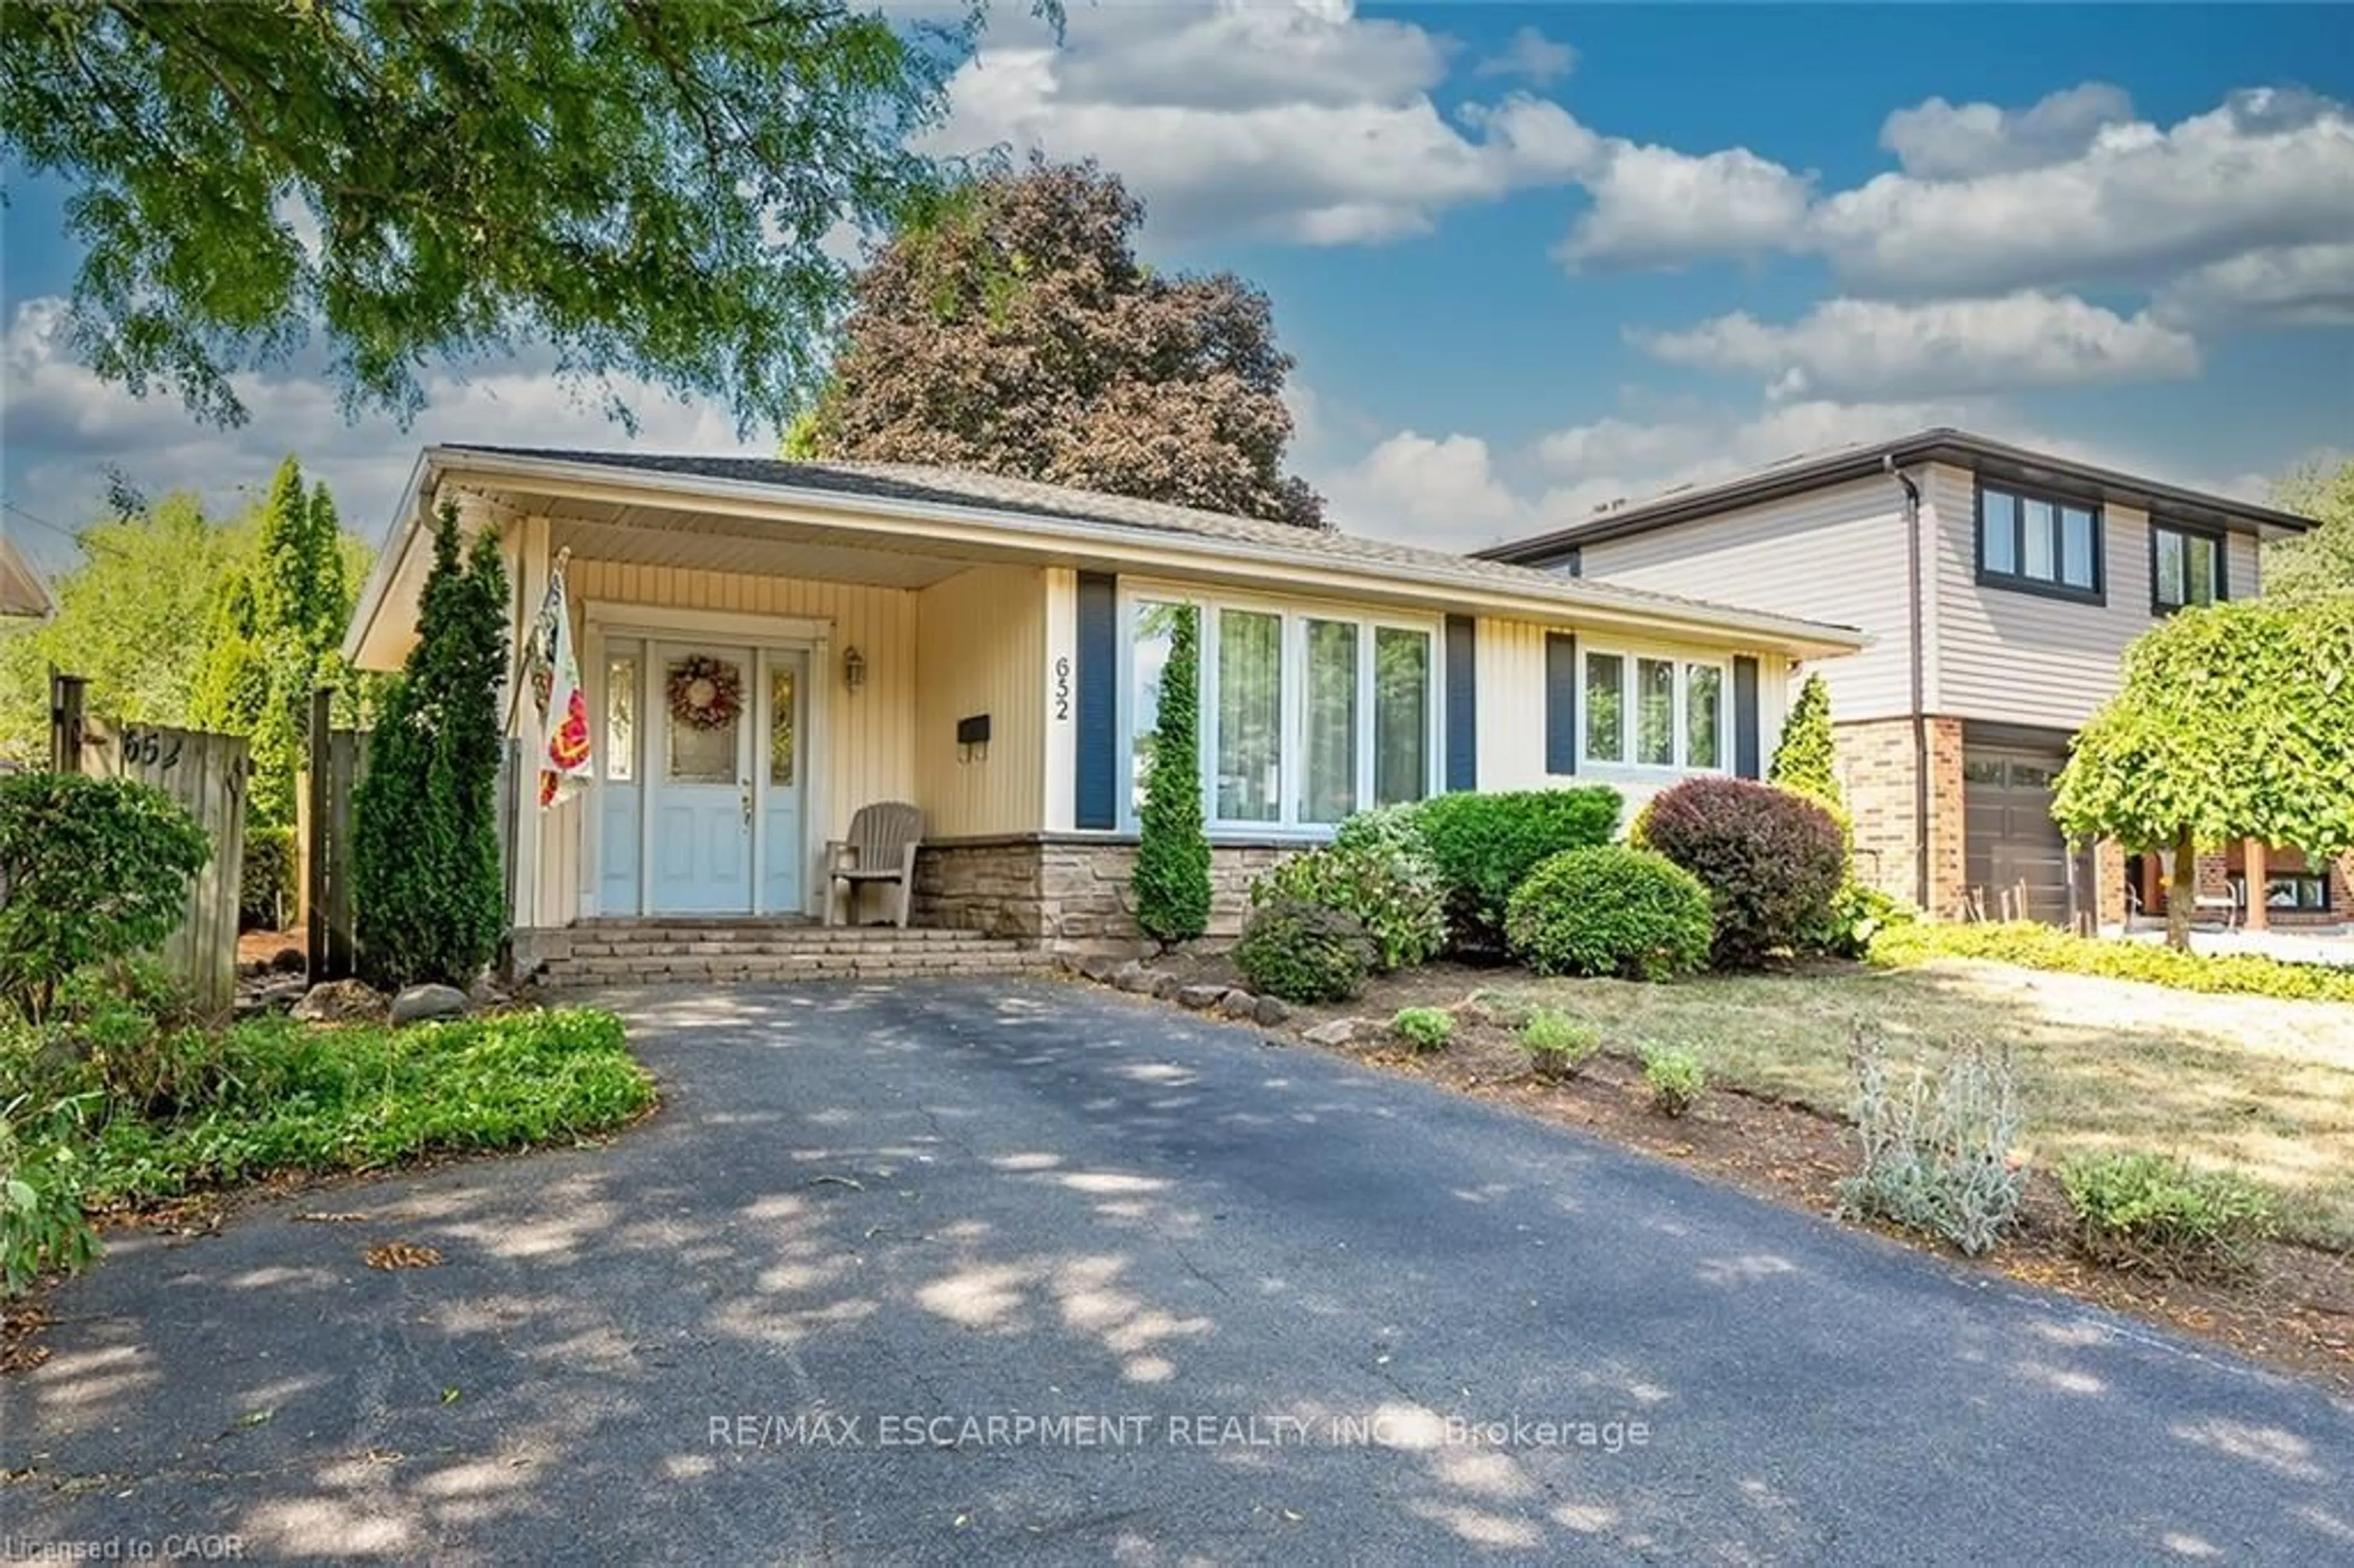
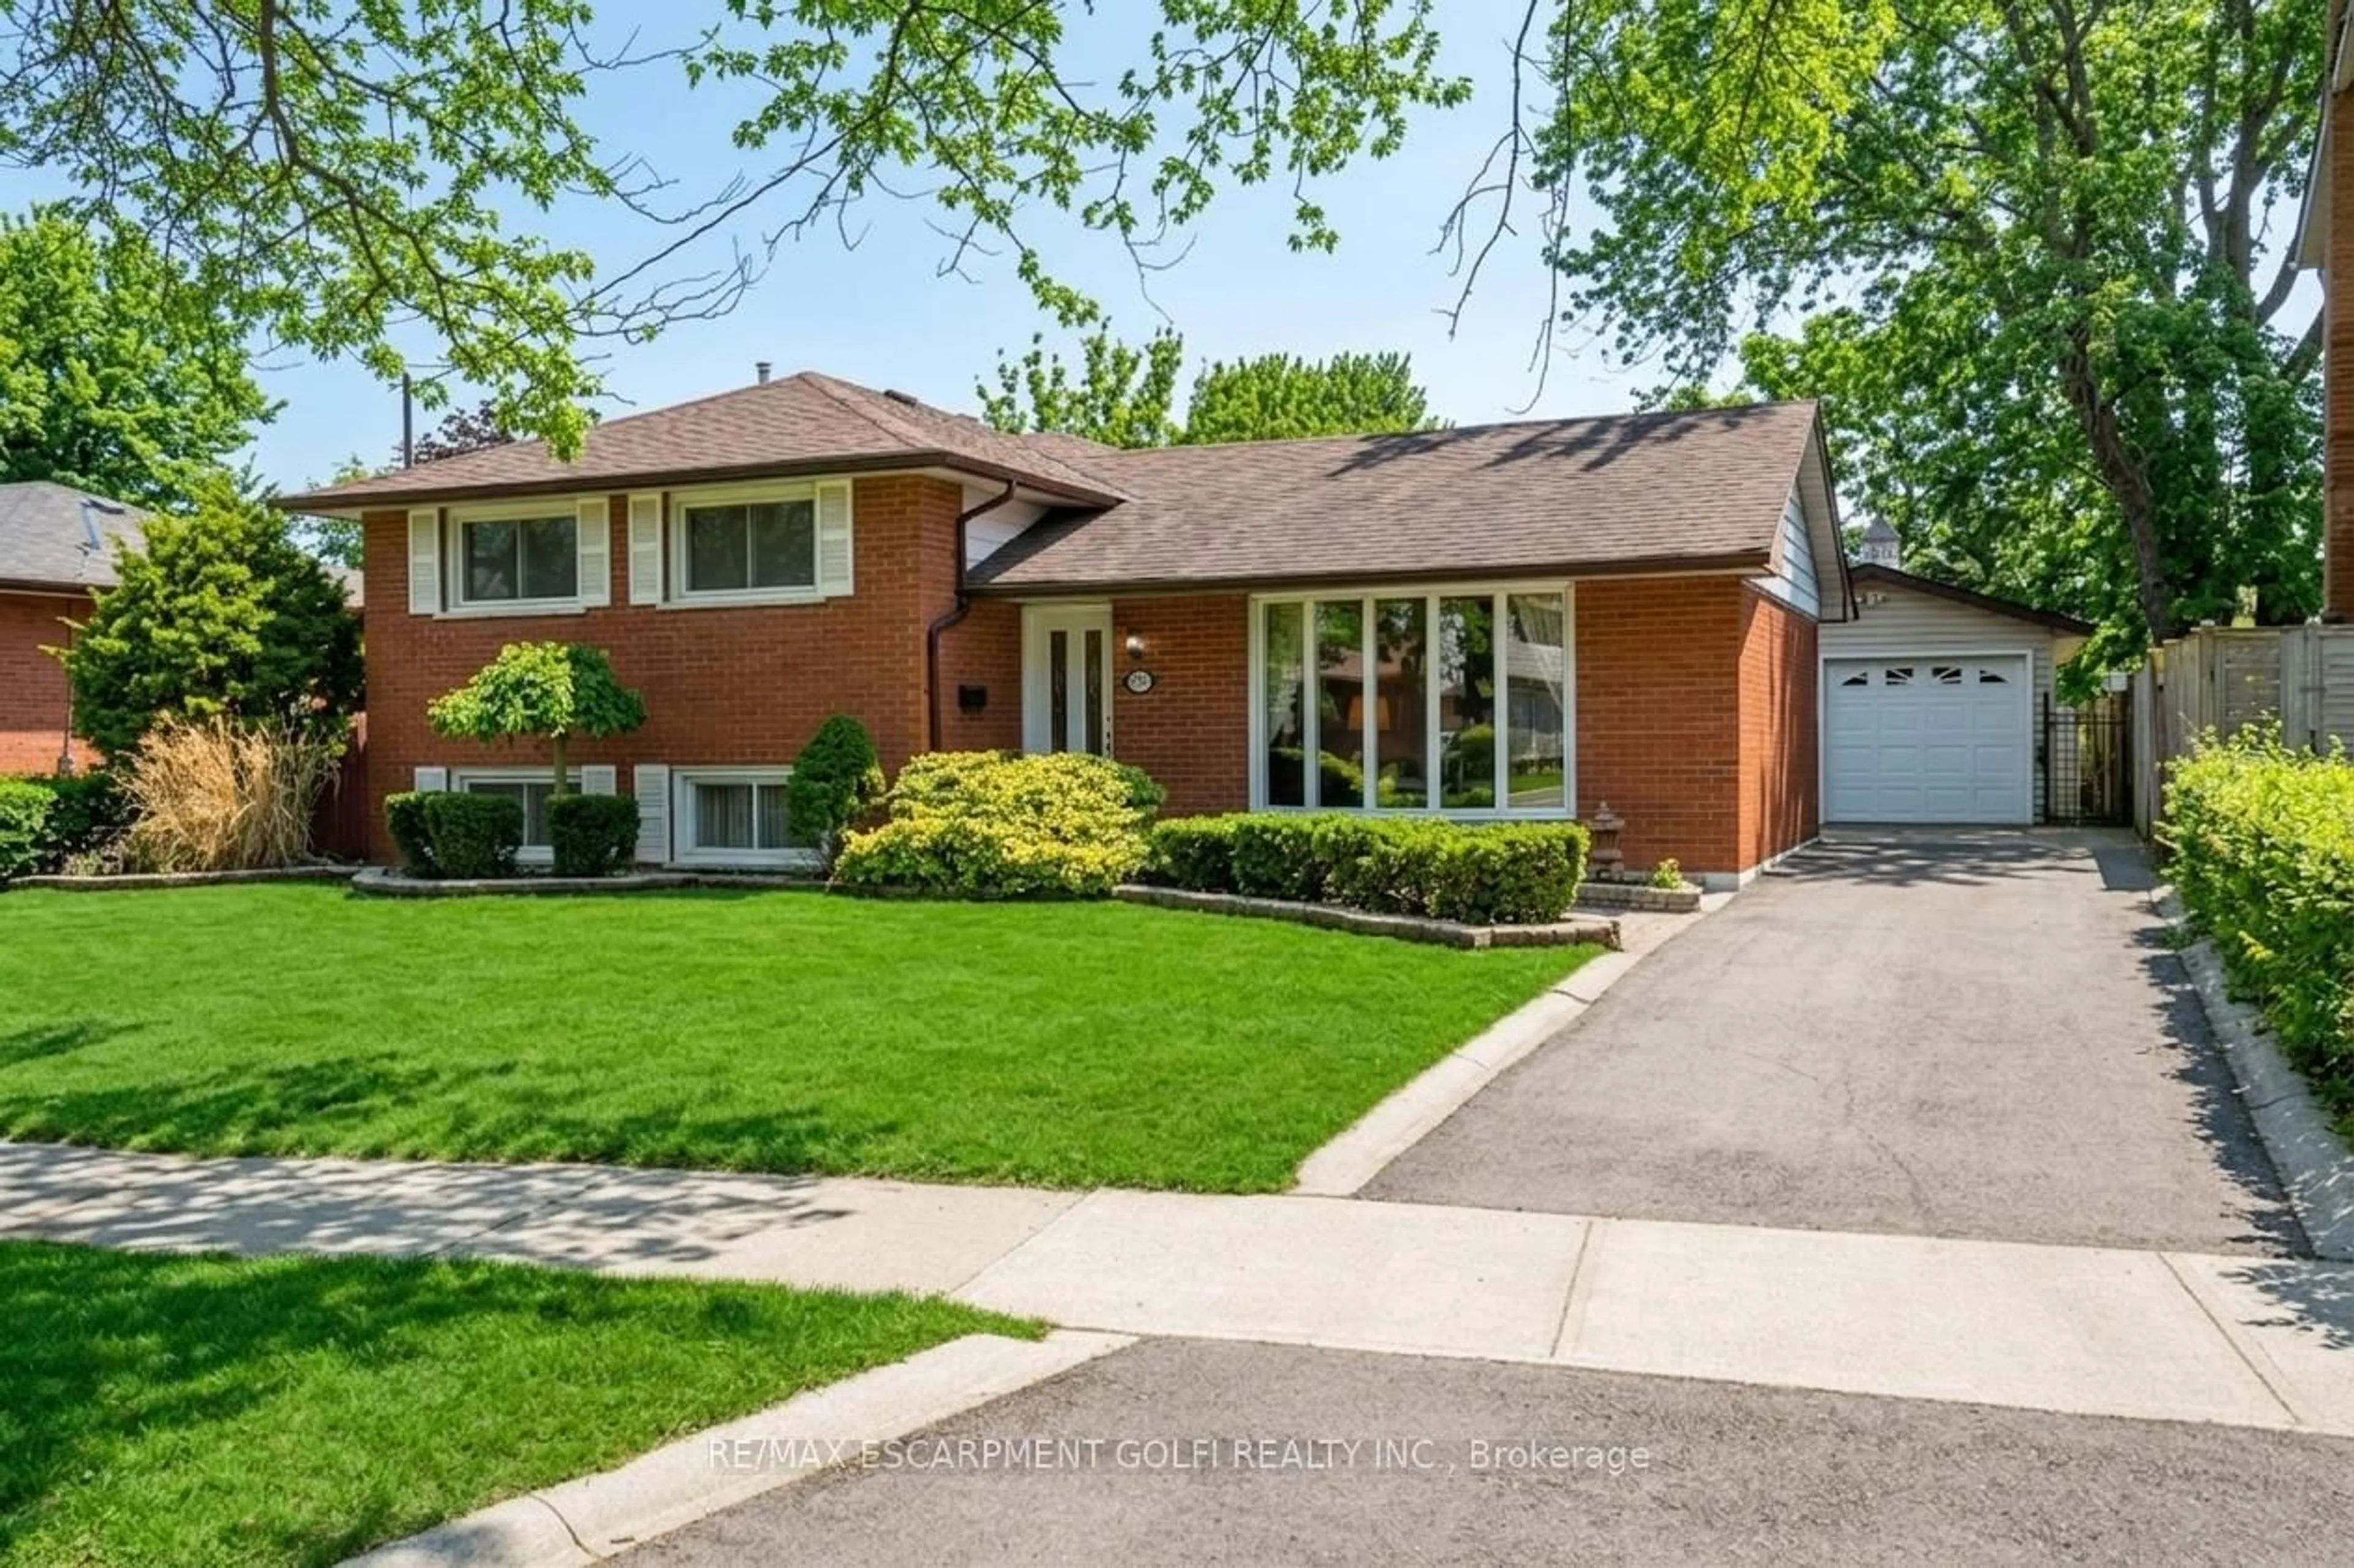
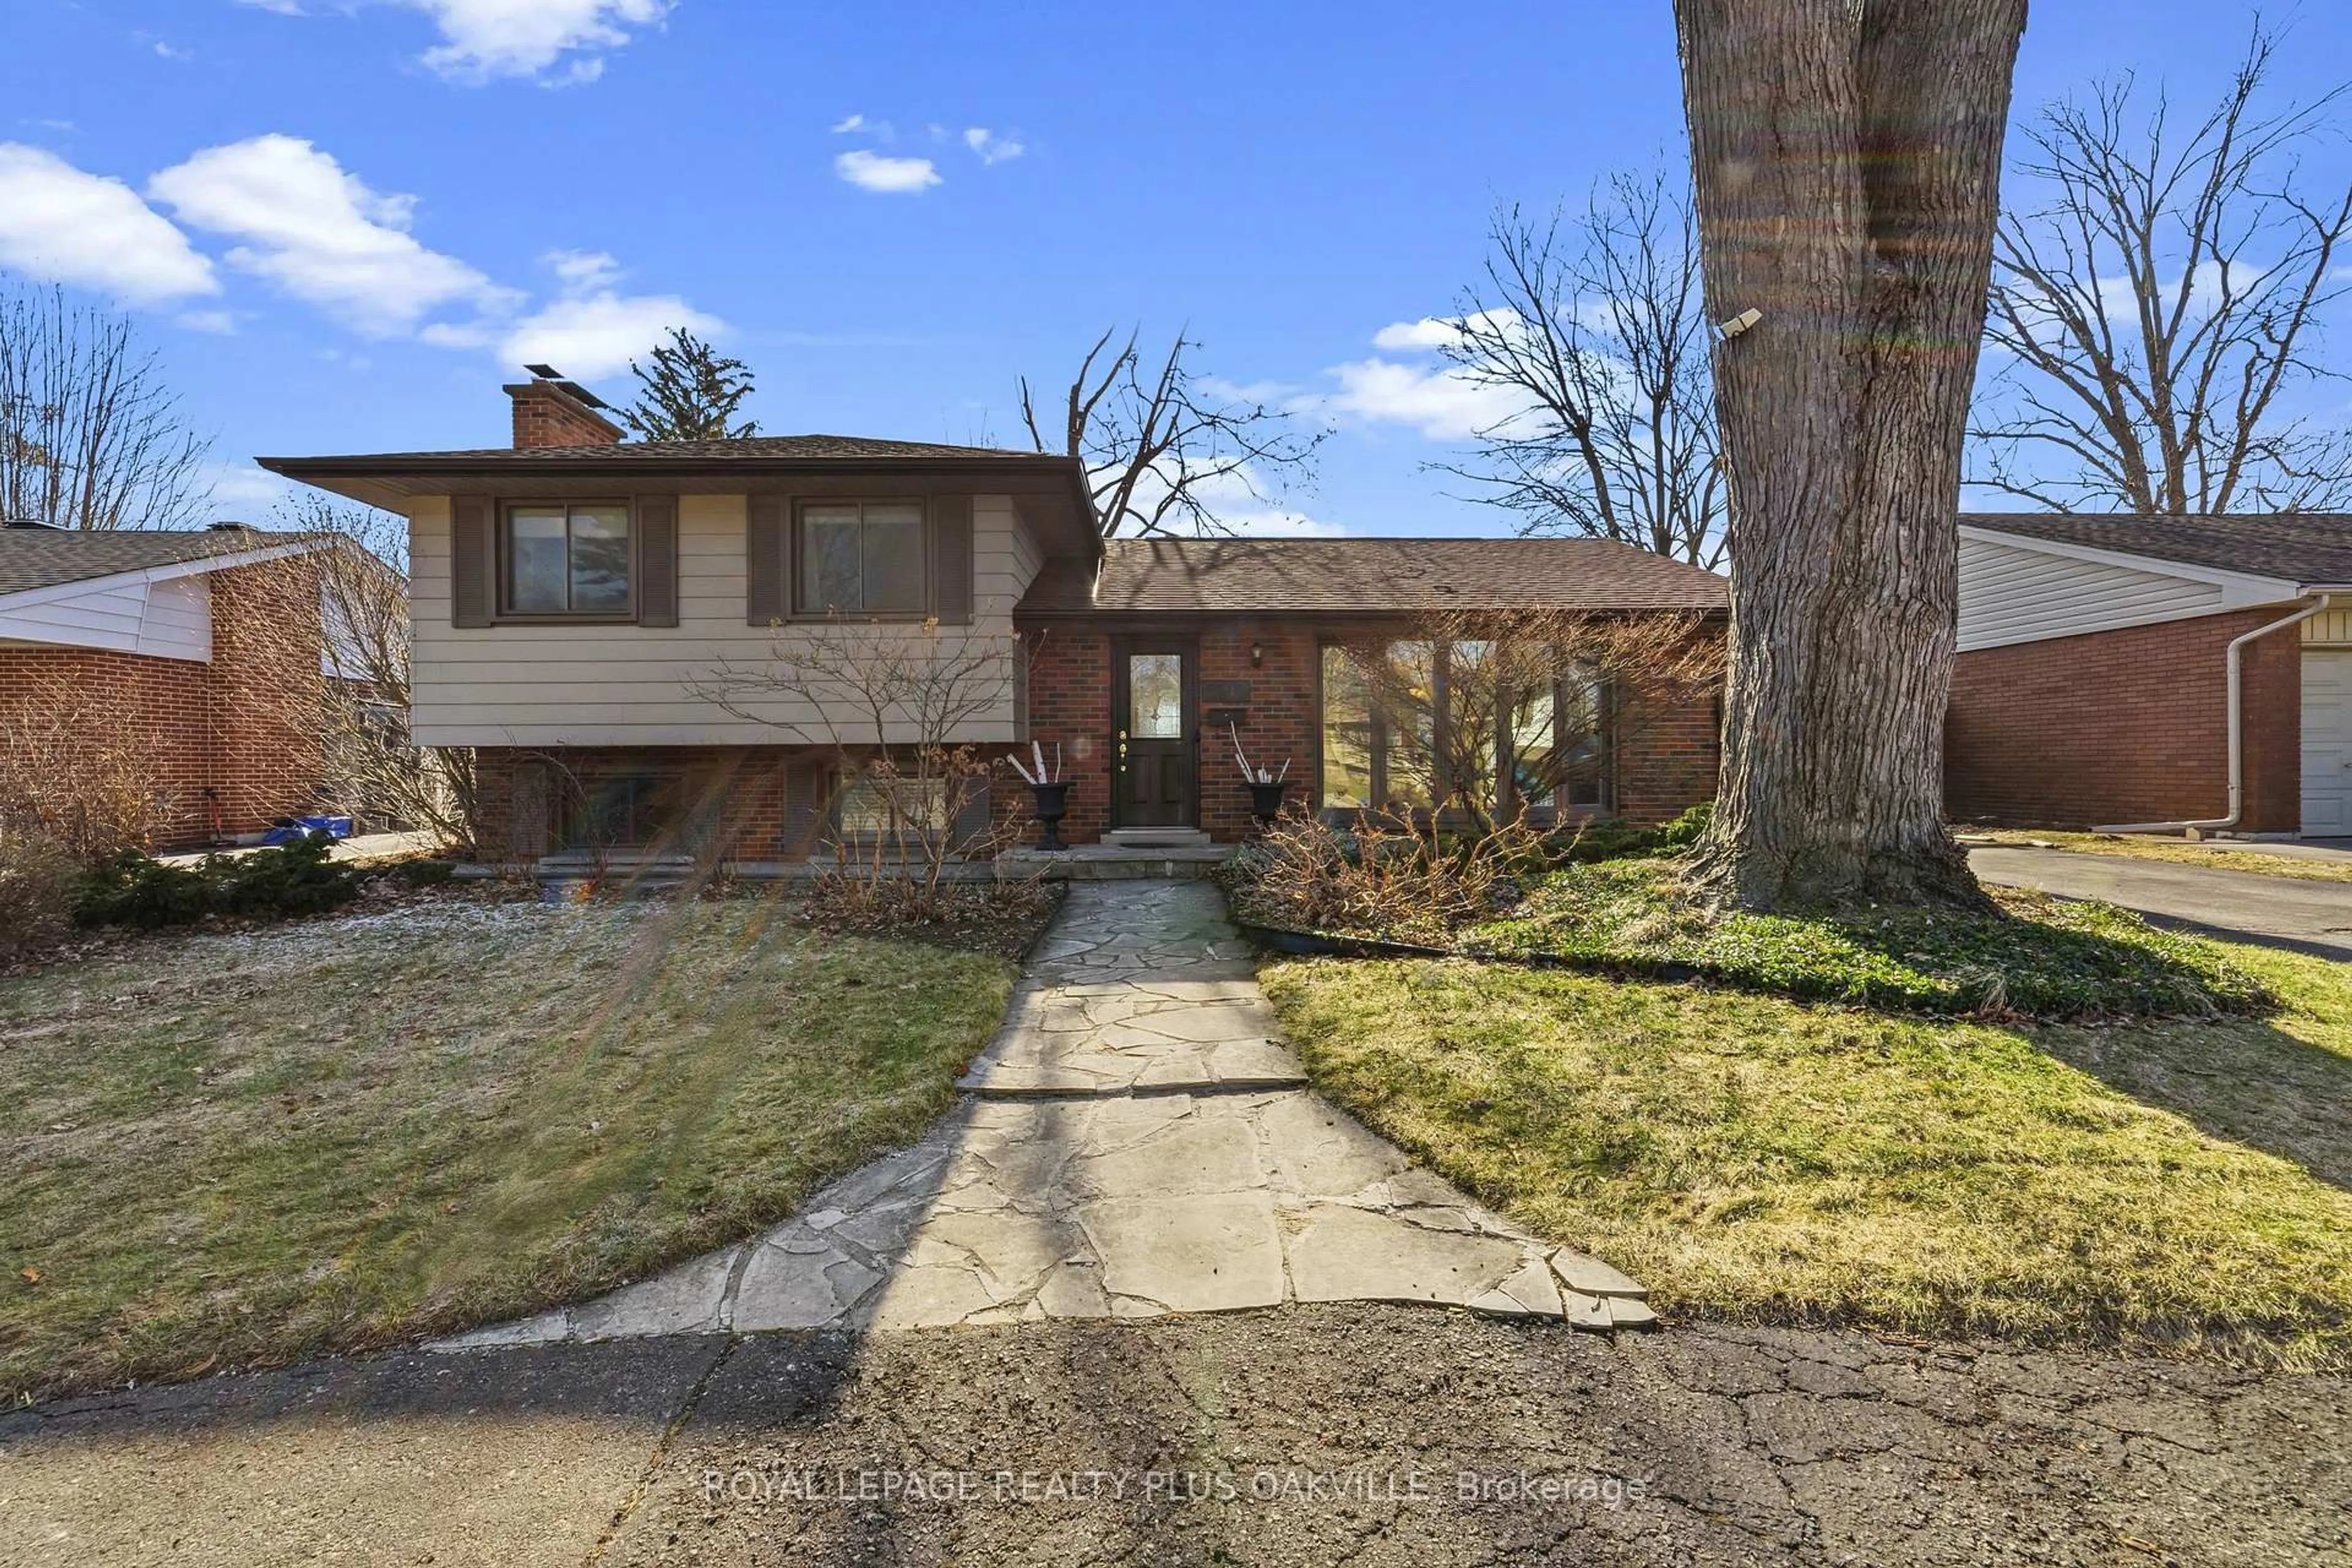
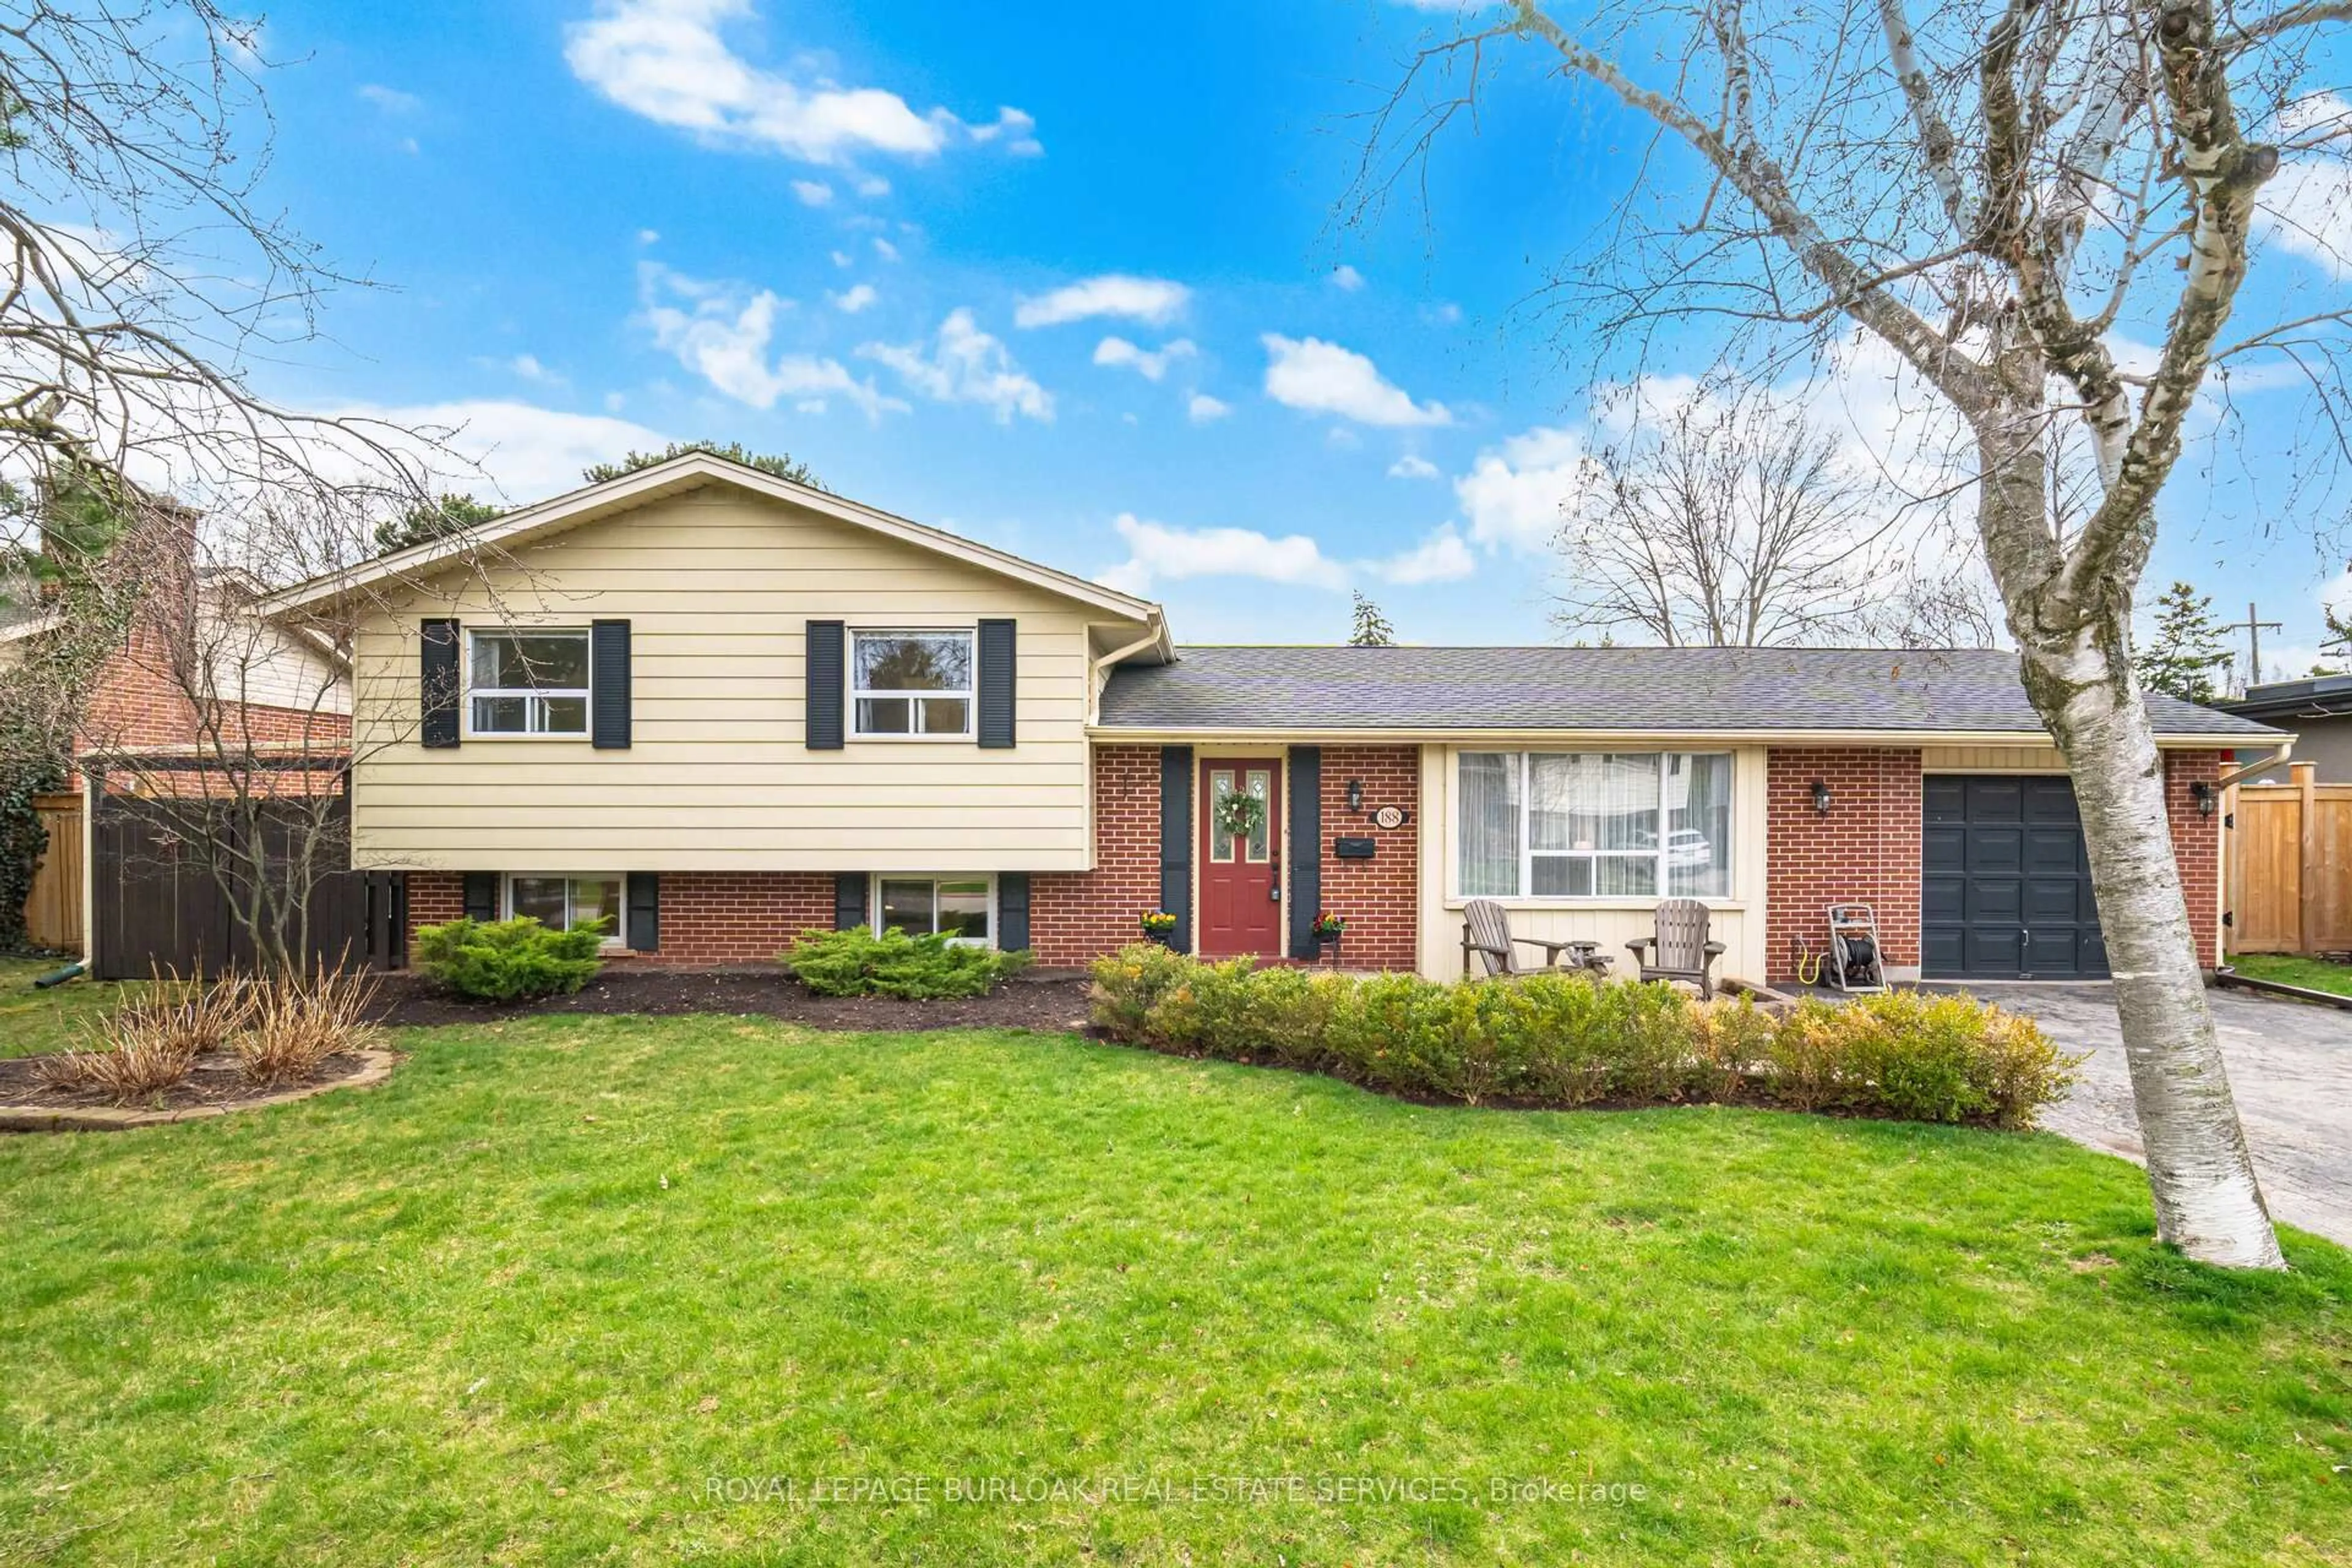
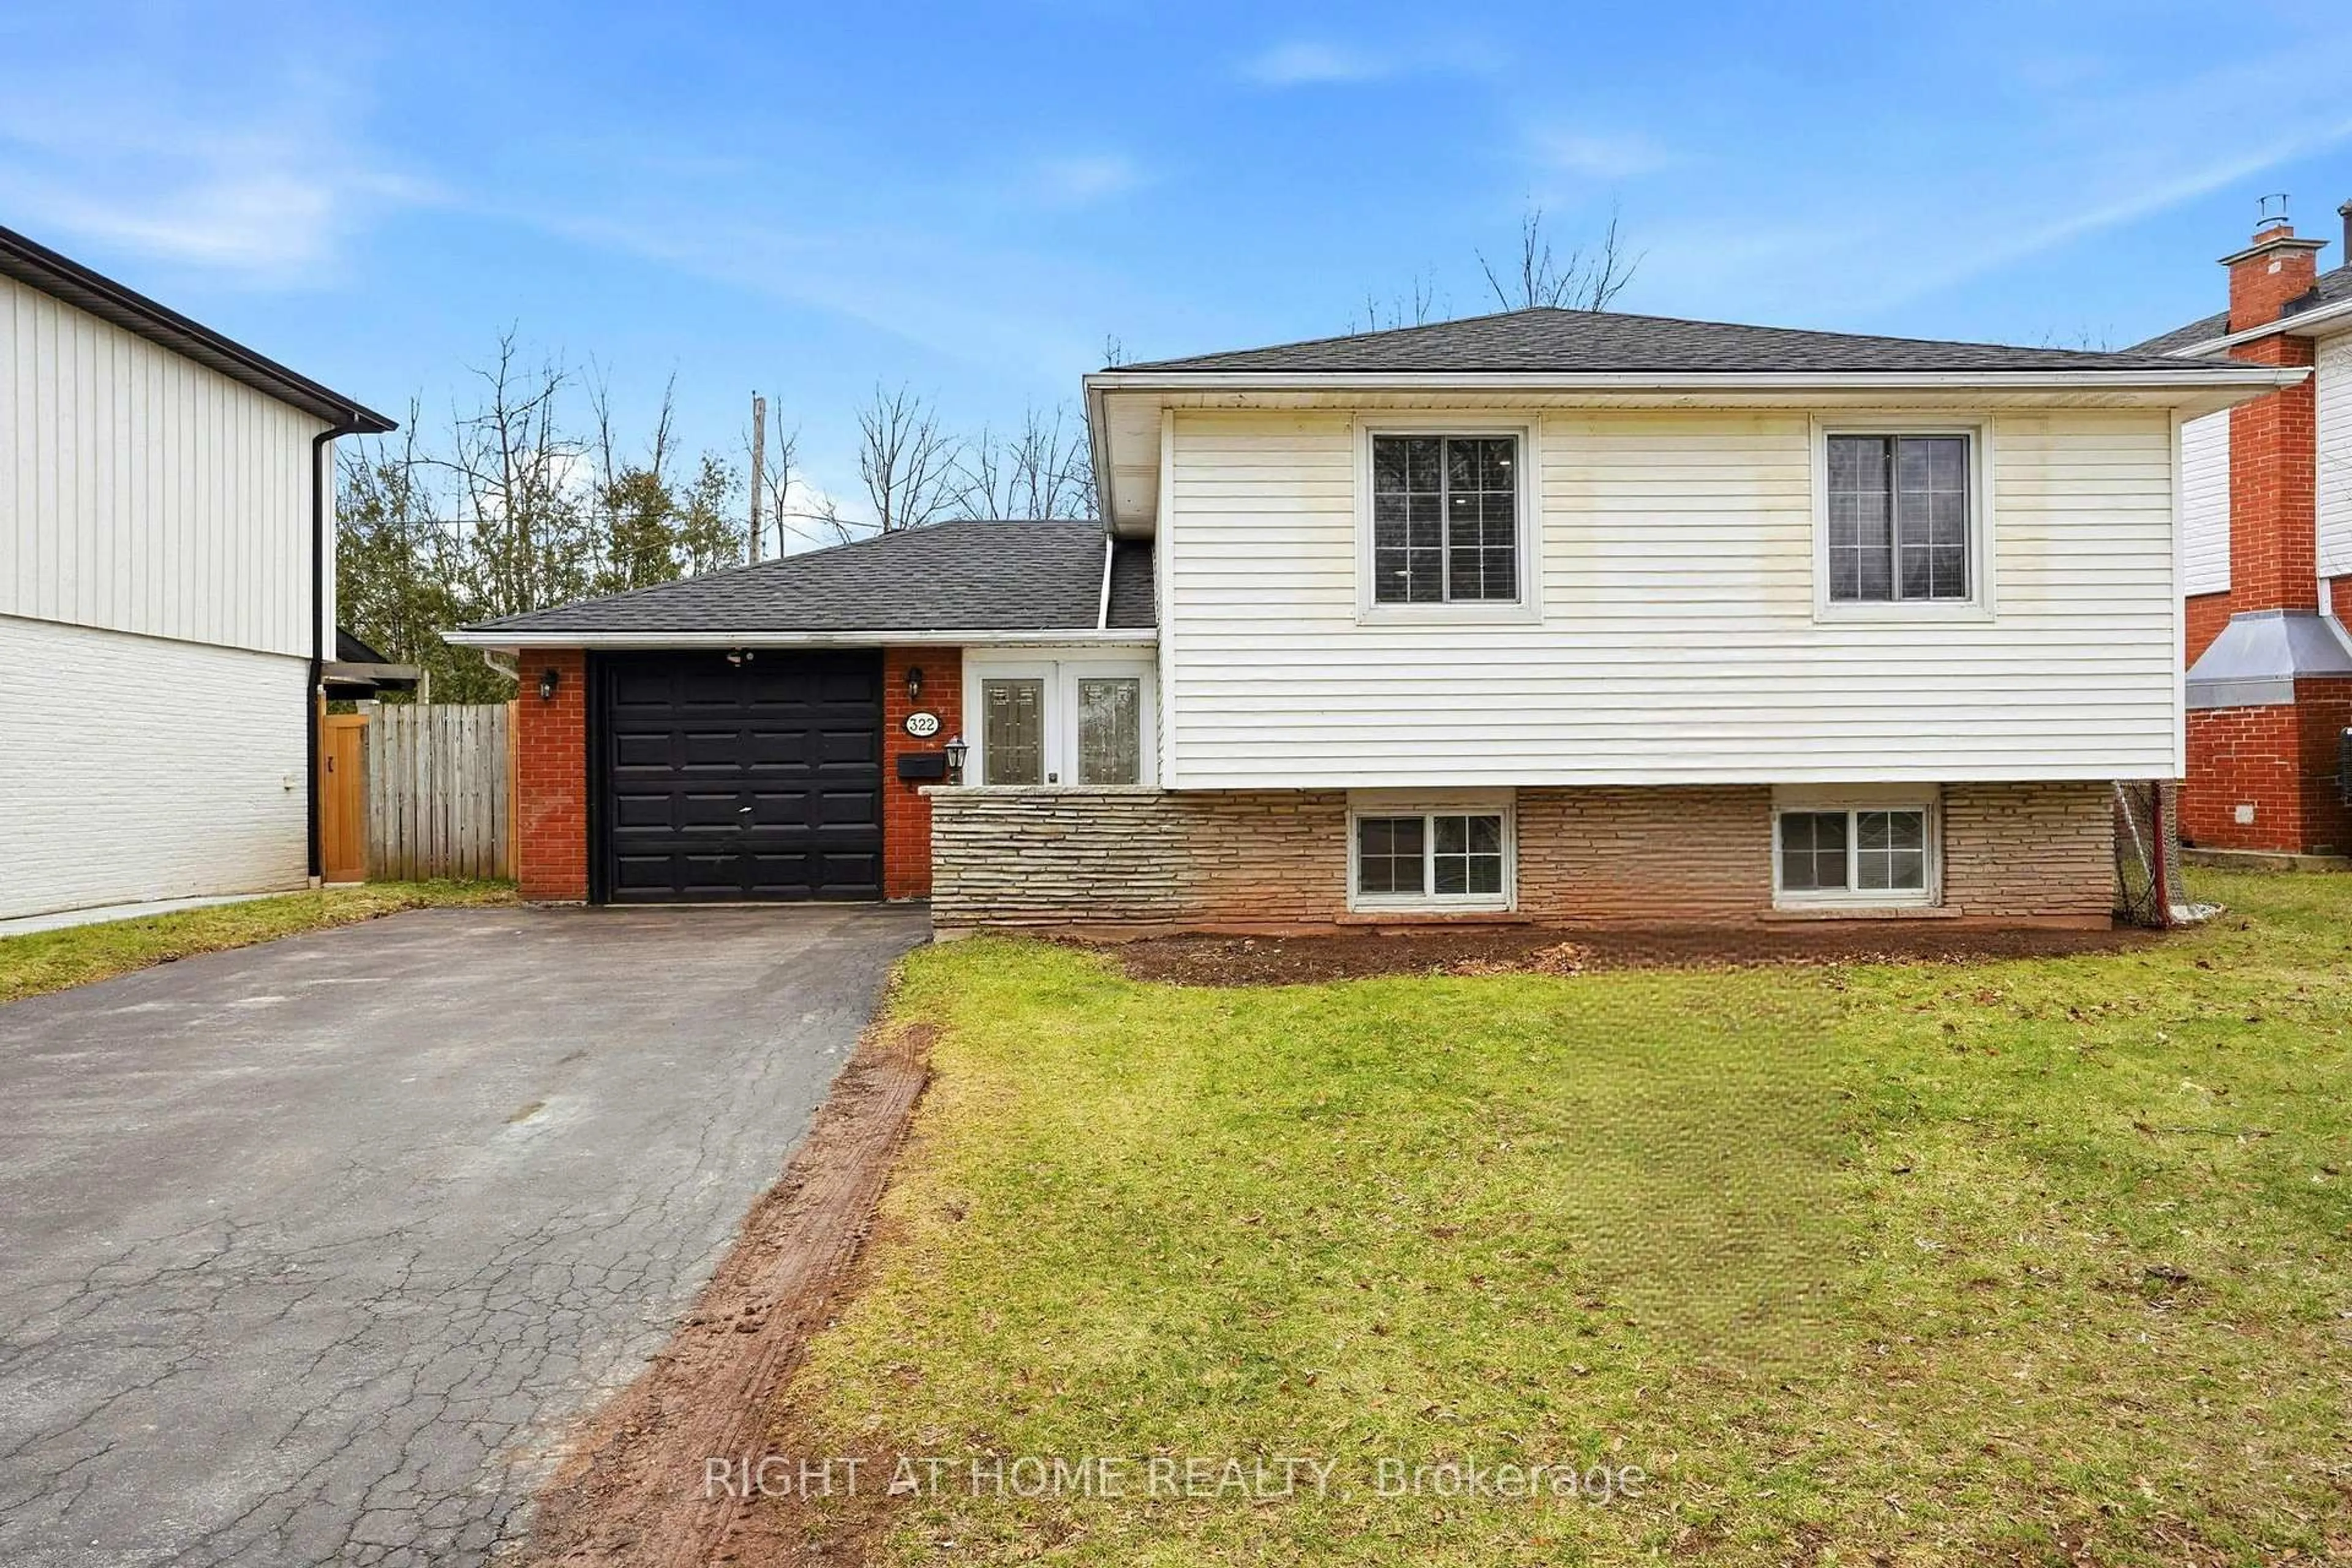
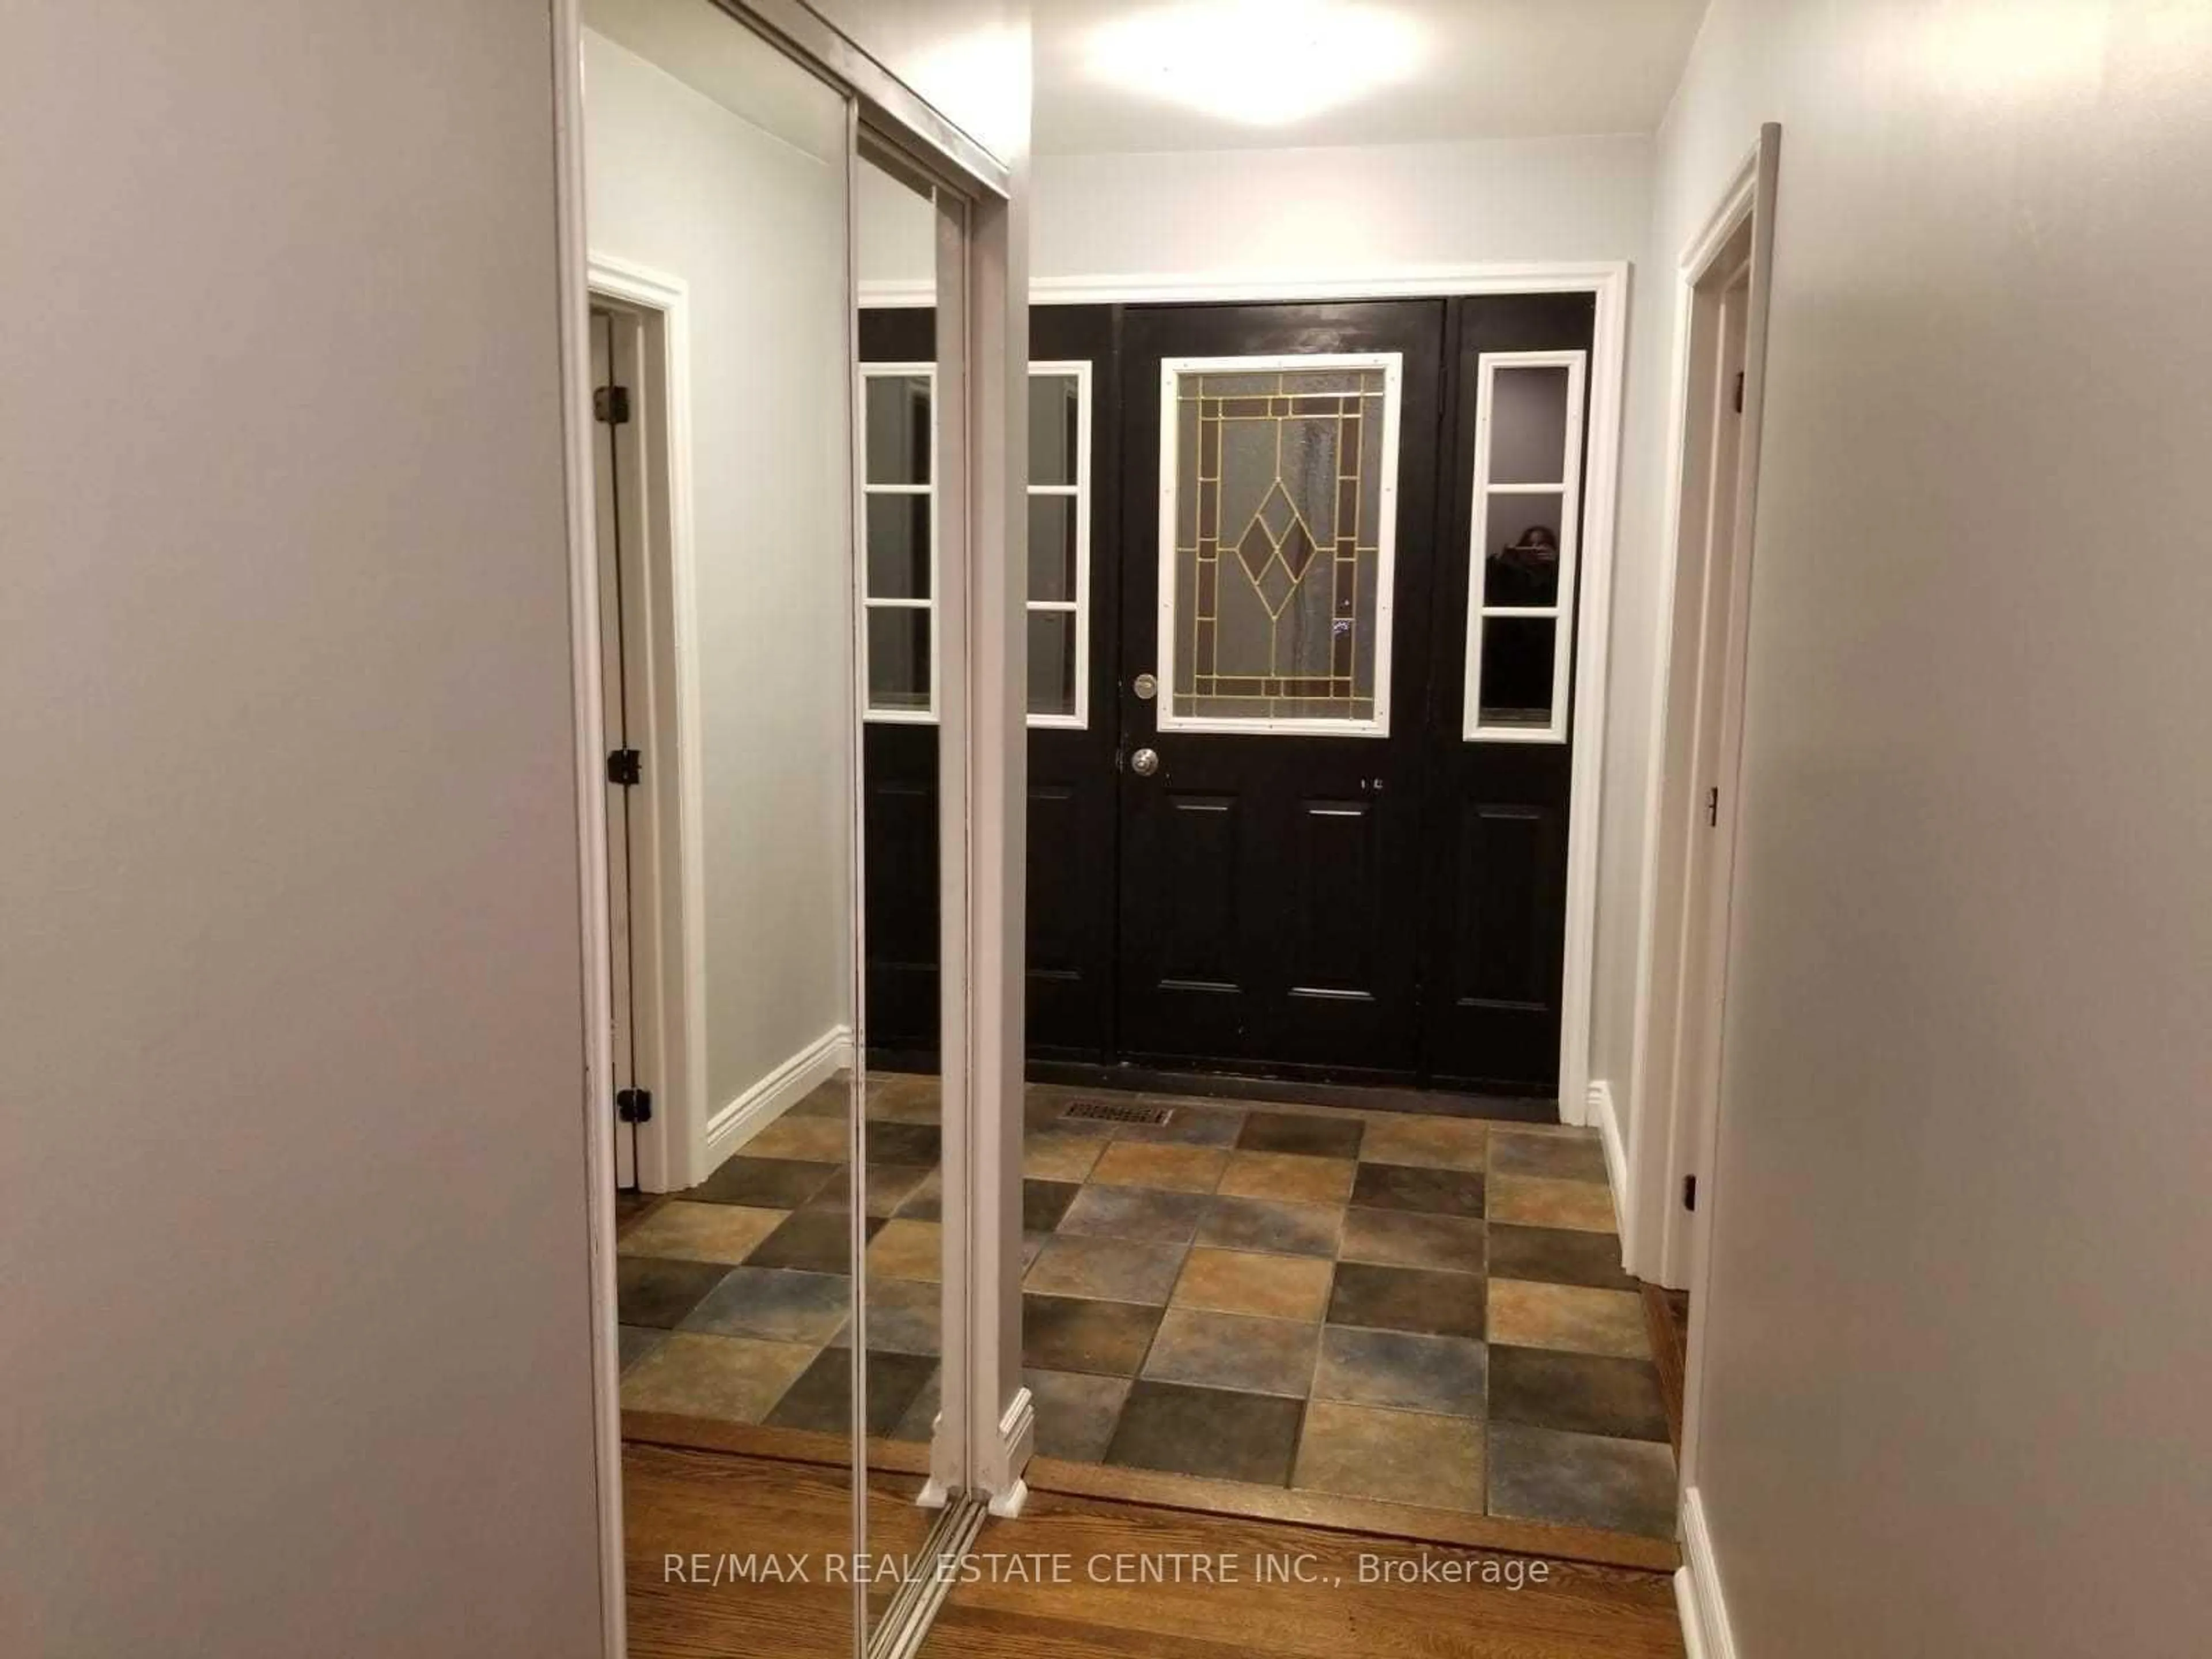
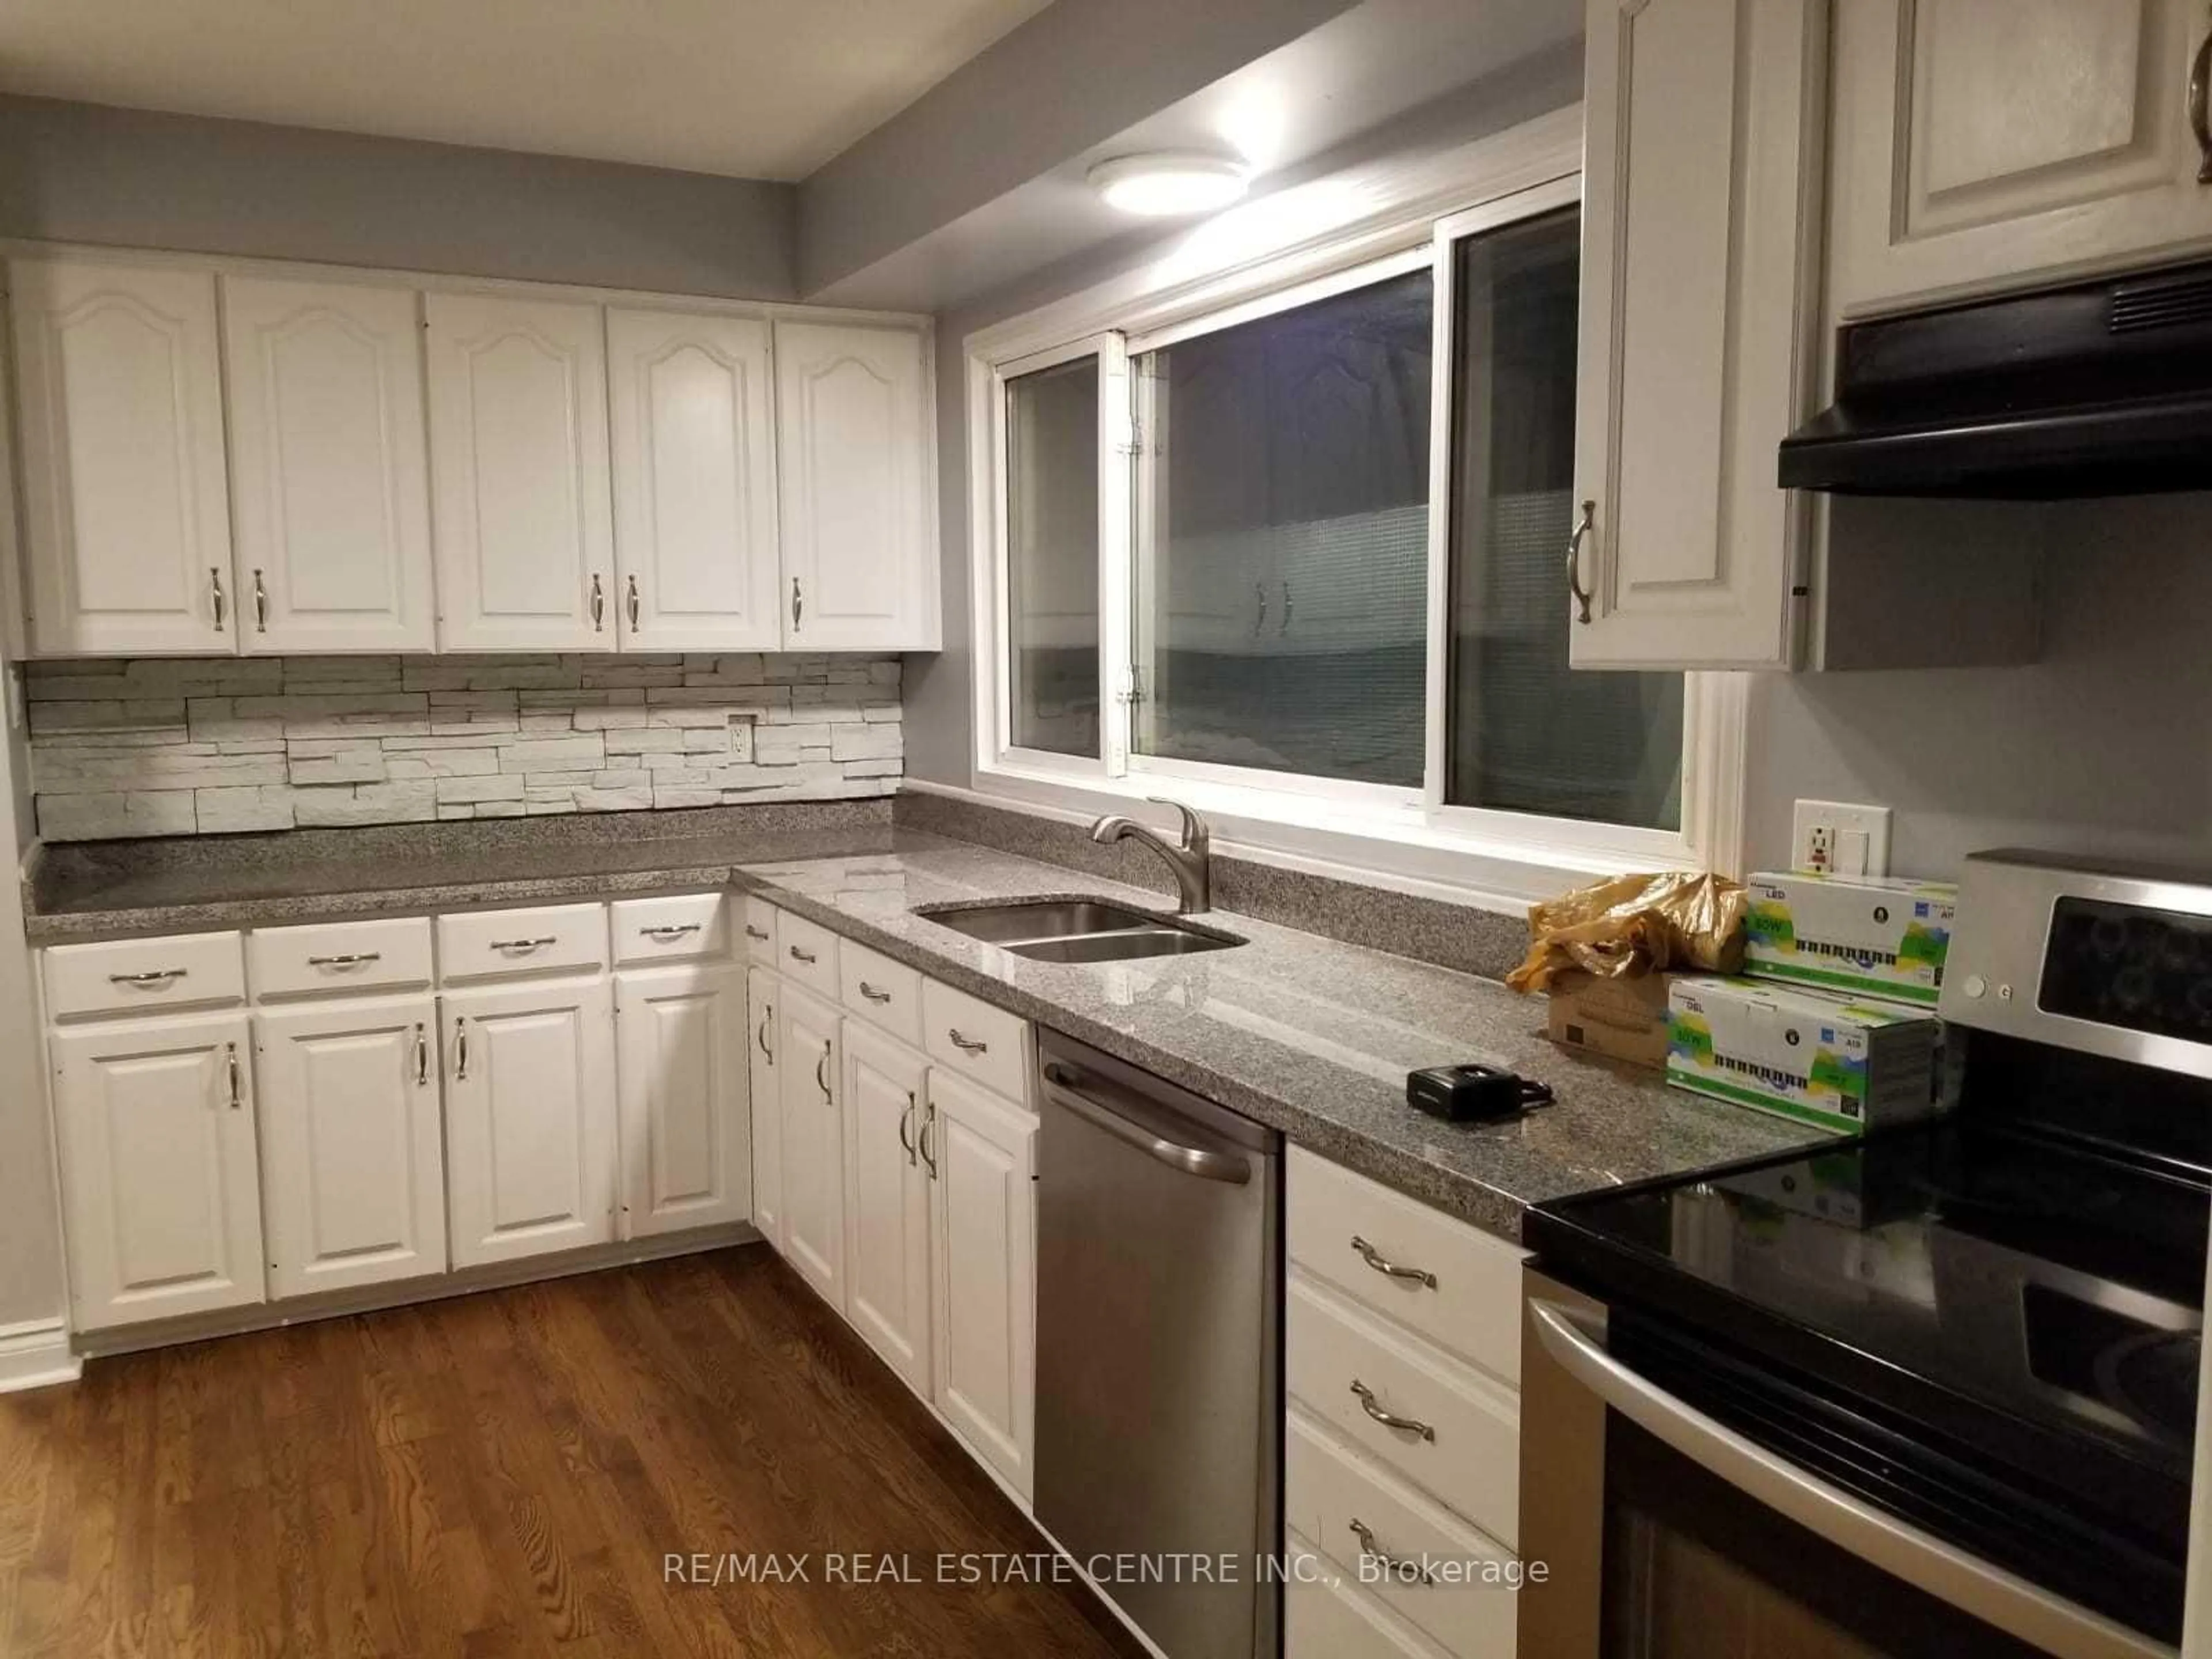
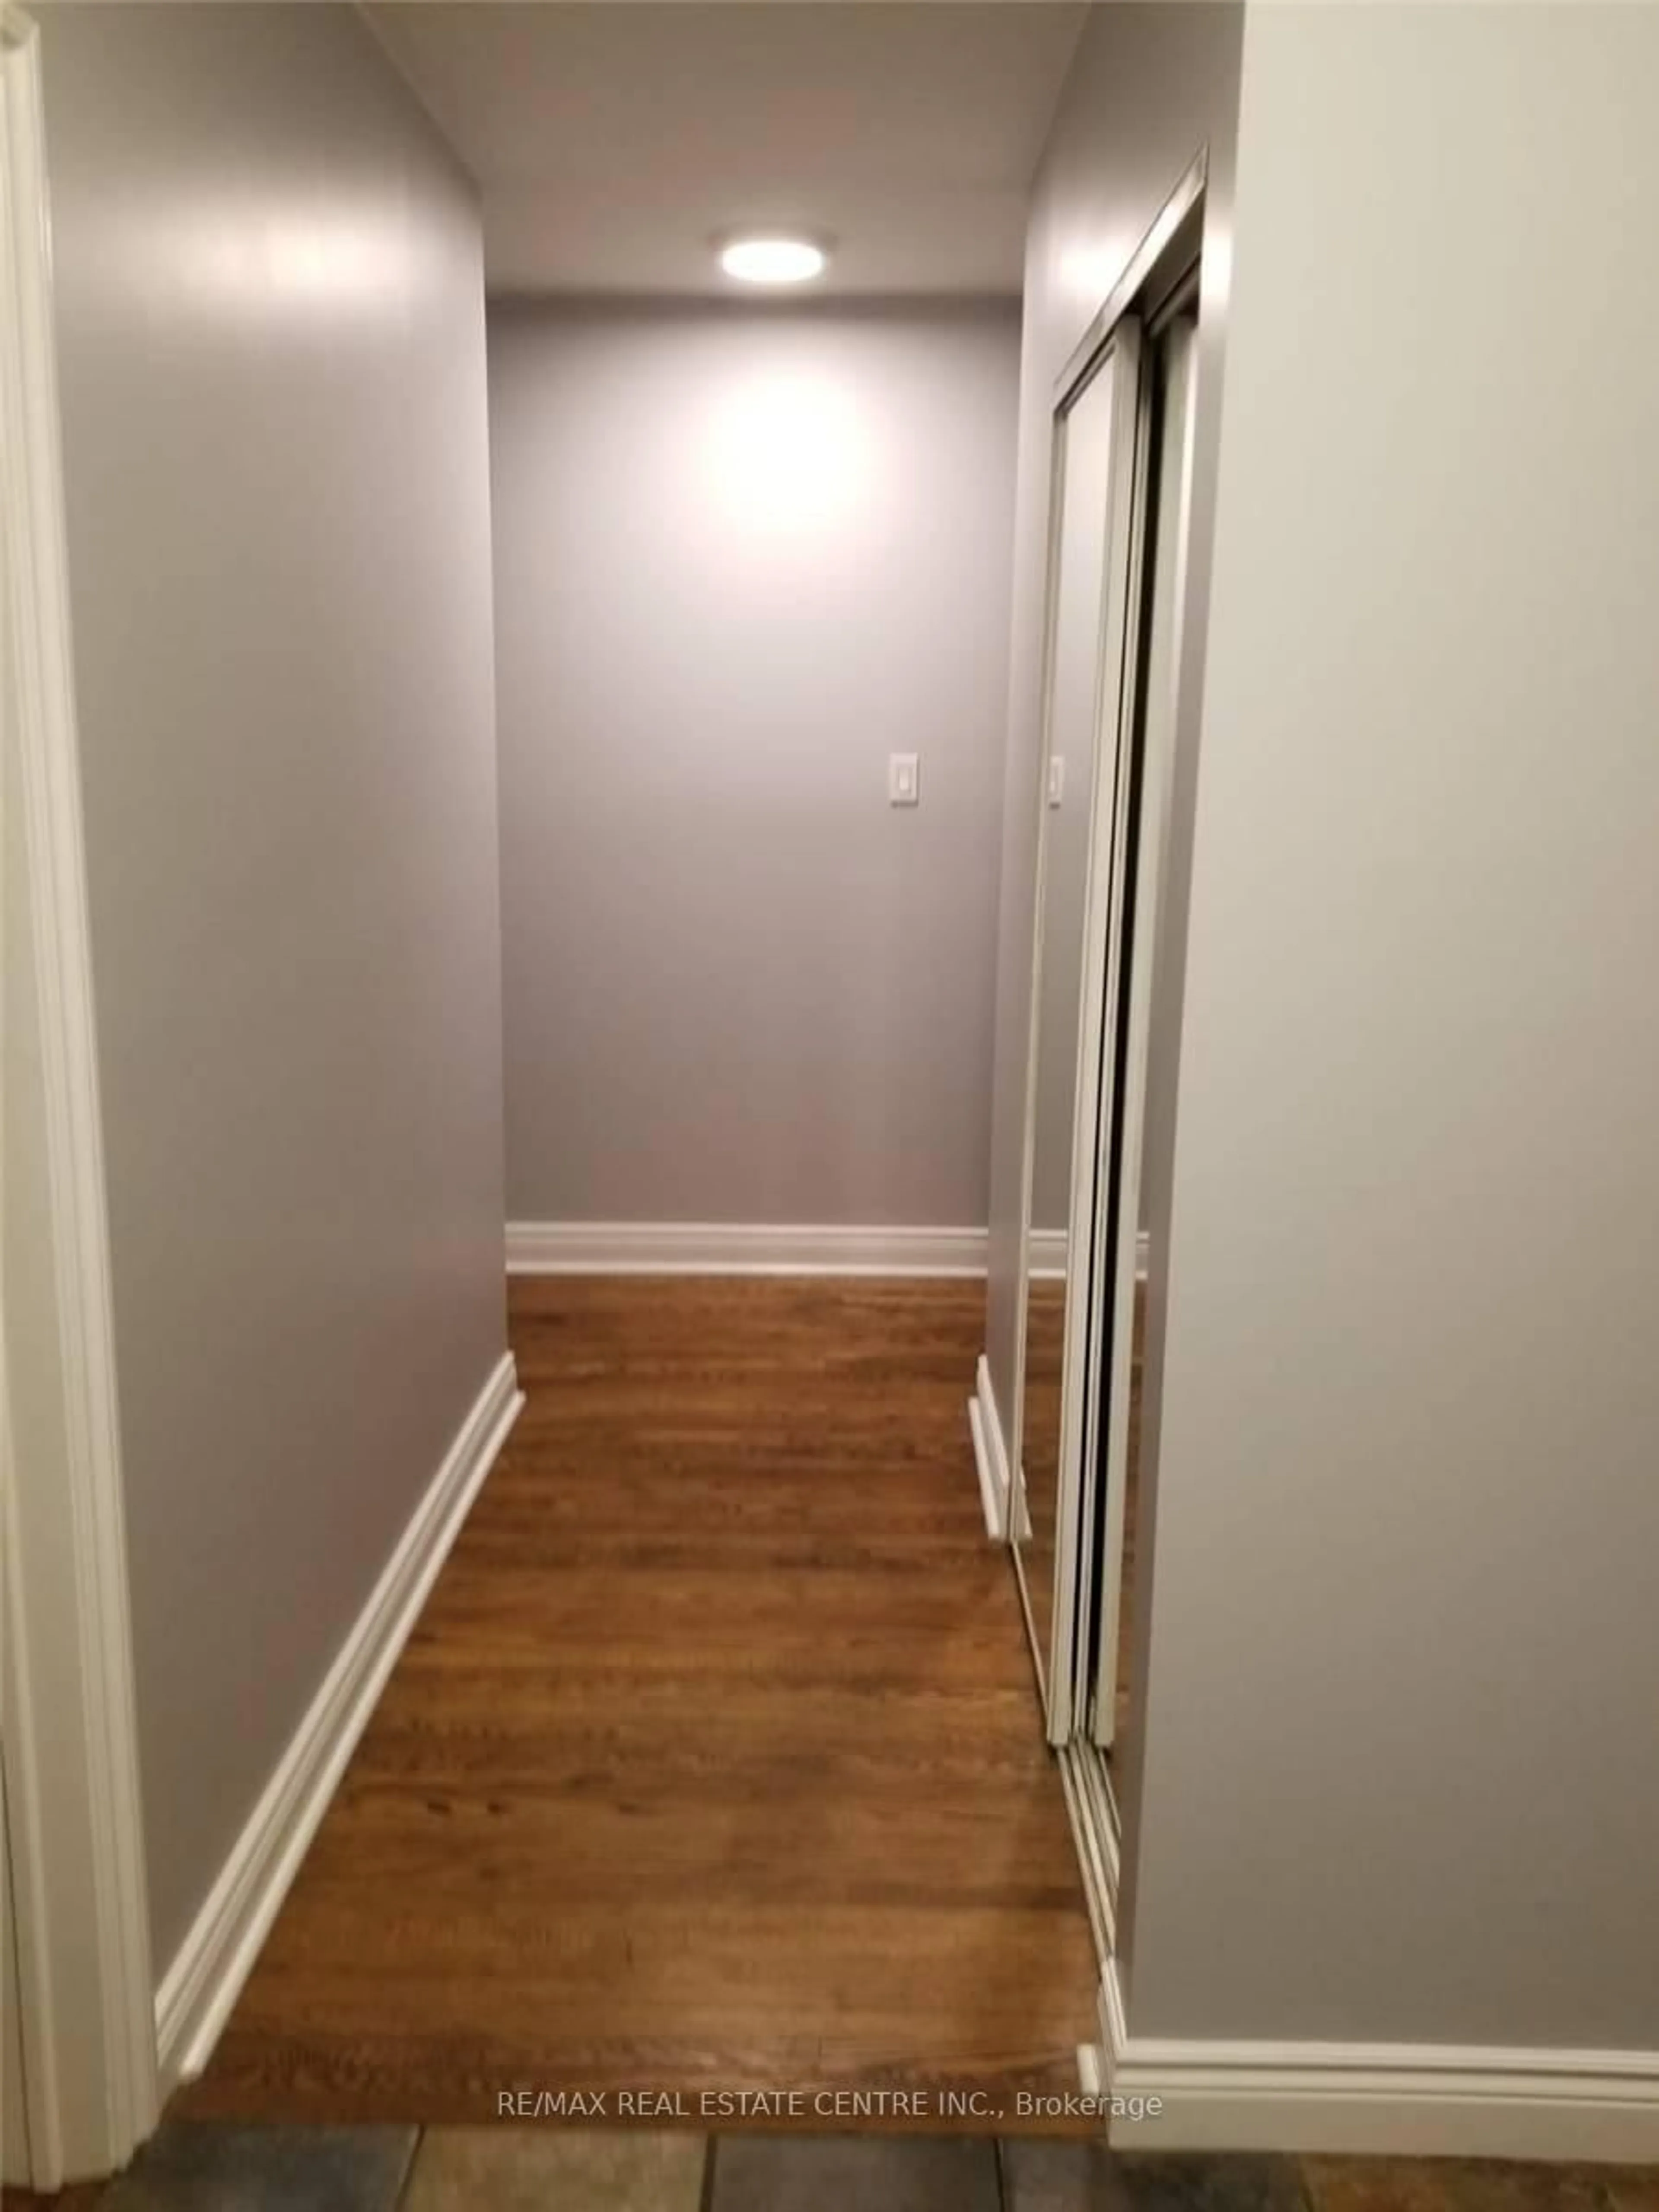
3+2 bedroom, 2 full bathroom bungalow on a 120-ft deep lot, complete with an in-ground pool and an entertainer's backyard oasis. This property is an investor's dream-perfect to move in, rent out, or build your future dream home. Featuring a good size separate kitchen with granite countertops and refinished hardwood floors ('16), the home offers comfort and potential. Two main-floor bedrooms overlook the pool and walk out to private decks-ideal for morning coffee or quiet relaxation. Both decks lead to an expansive 500+ sq. ft. flagstone patio that extends to the pool's edge, creating a serene retreat for gatherings and outdoor living.
Property Details
Interior
Features
Main Floor
Living
5.18 x 3.71Laminate / O/Looks Frontyard
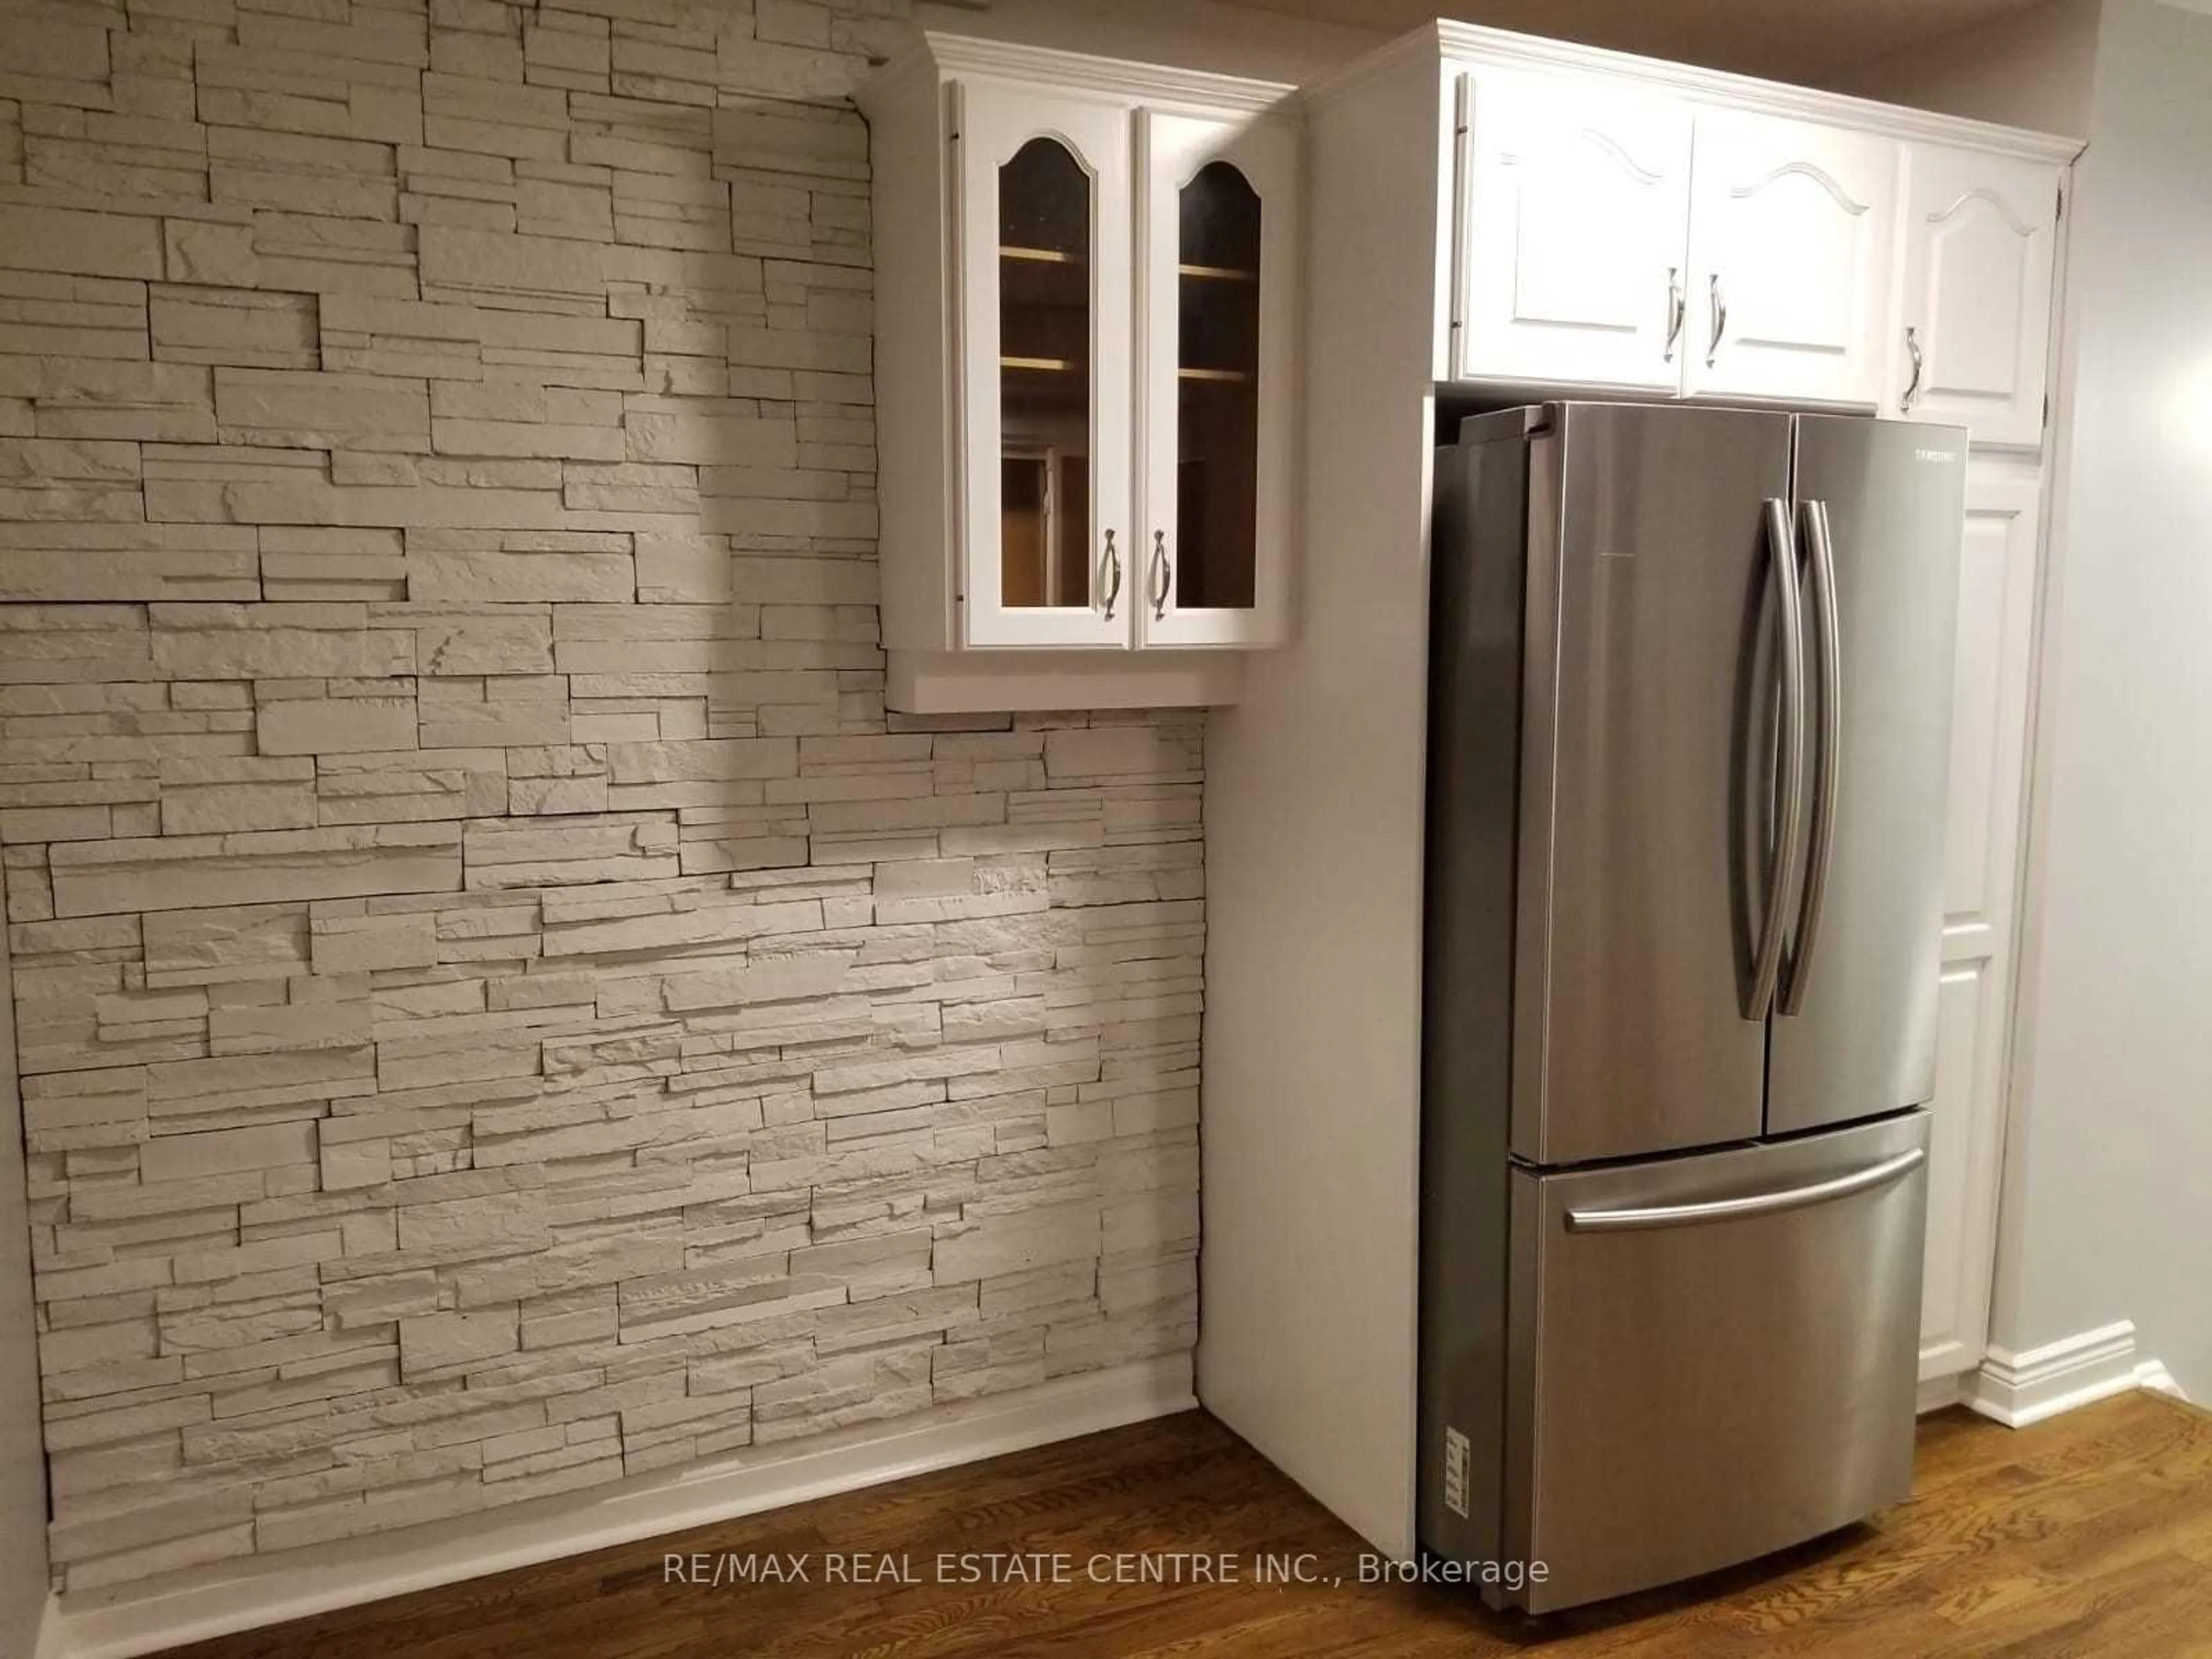
Kitchen
4.24 x 3.75Tile Floor / Large Window / Stainless Steel Appl
Primary
3.87 x 3.66hardwood floor / W/O To Deck
Br
3.51 x 3.09Hardwood Floor
Exterior
Features
Parking
Garage spaces -
Garage type -
Total parking spaces 6
Property History
 15
15