94 days on Market
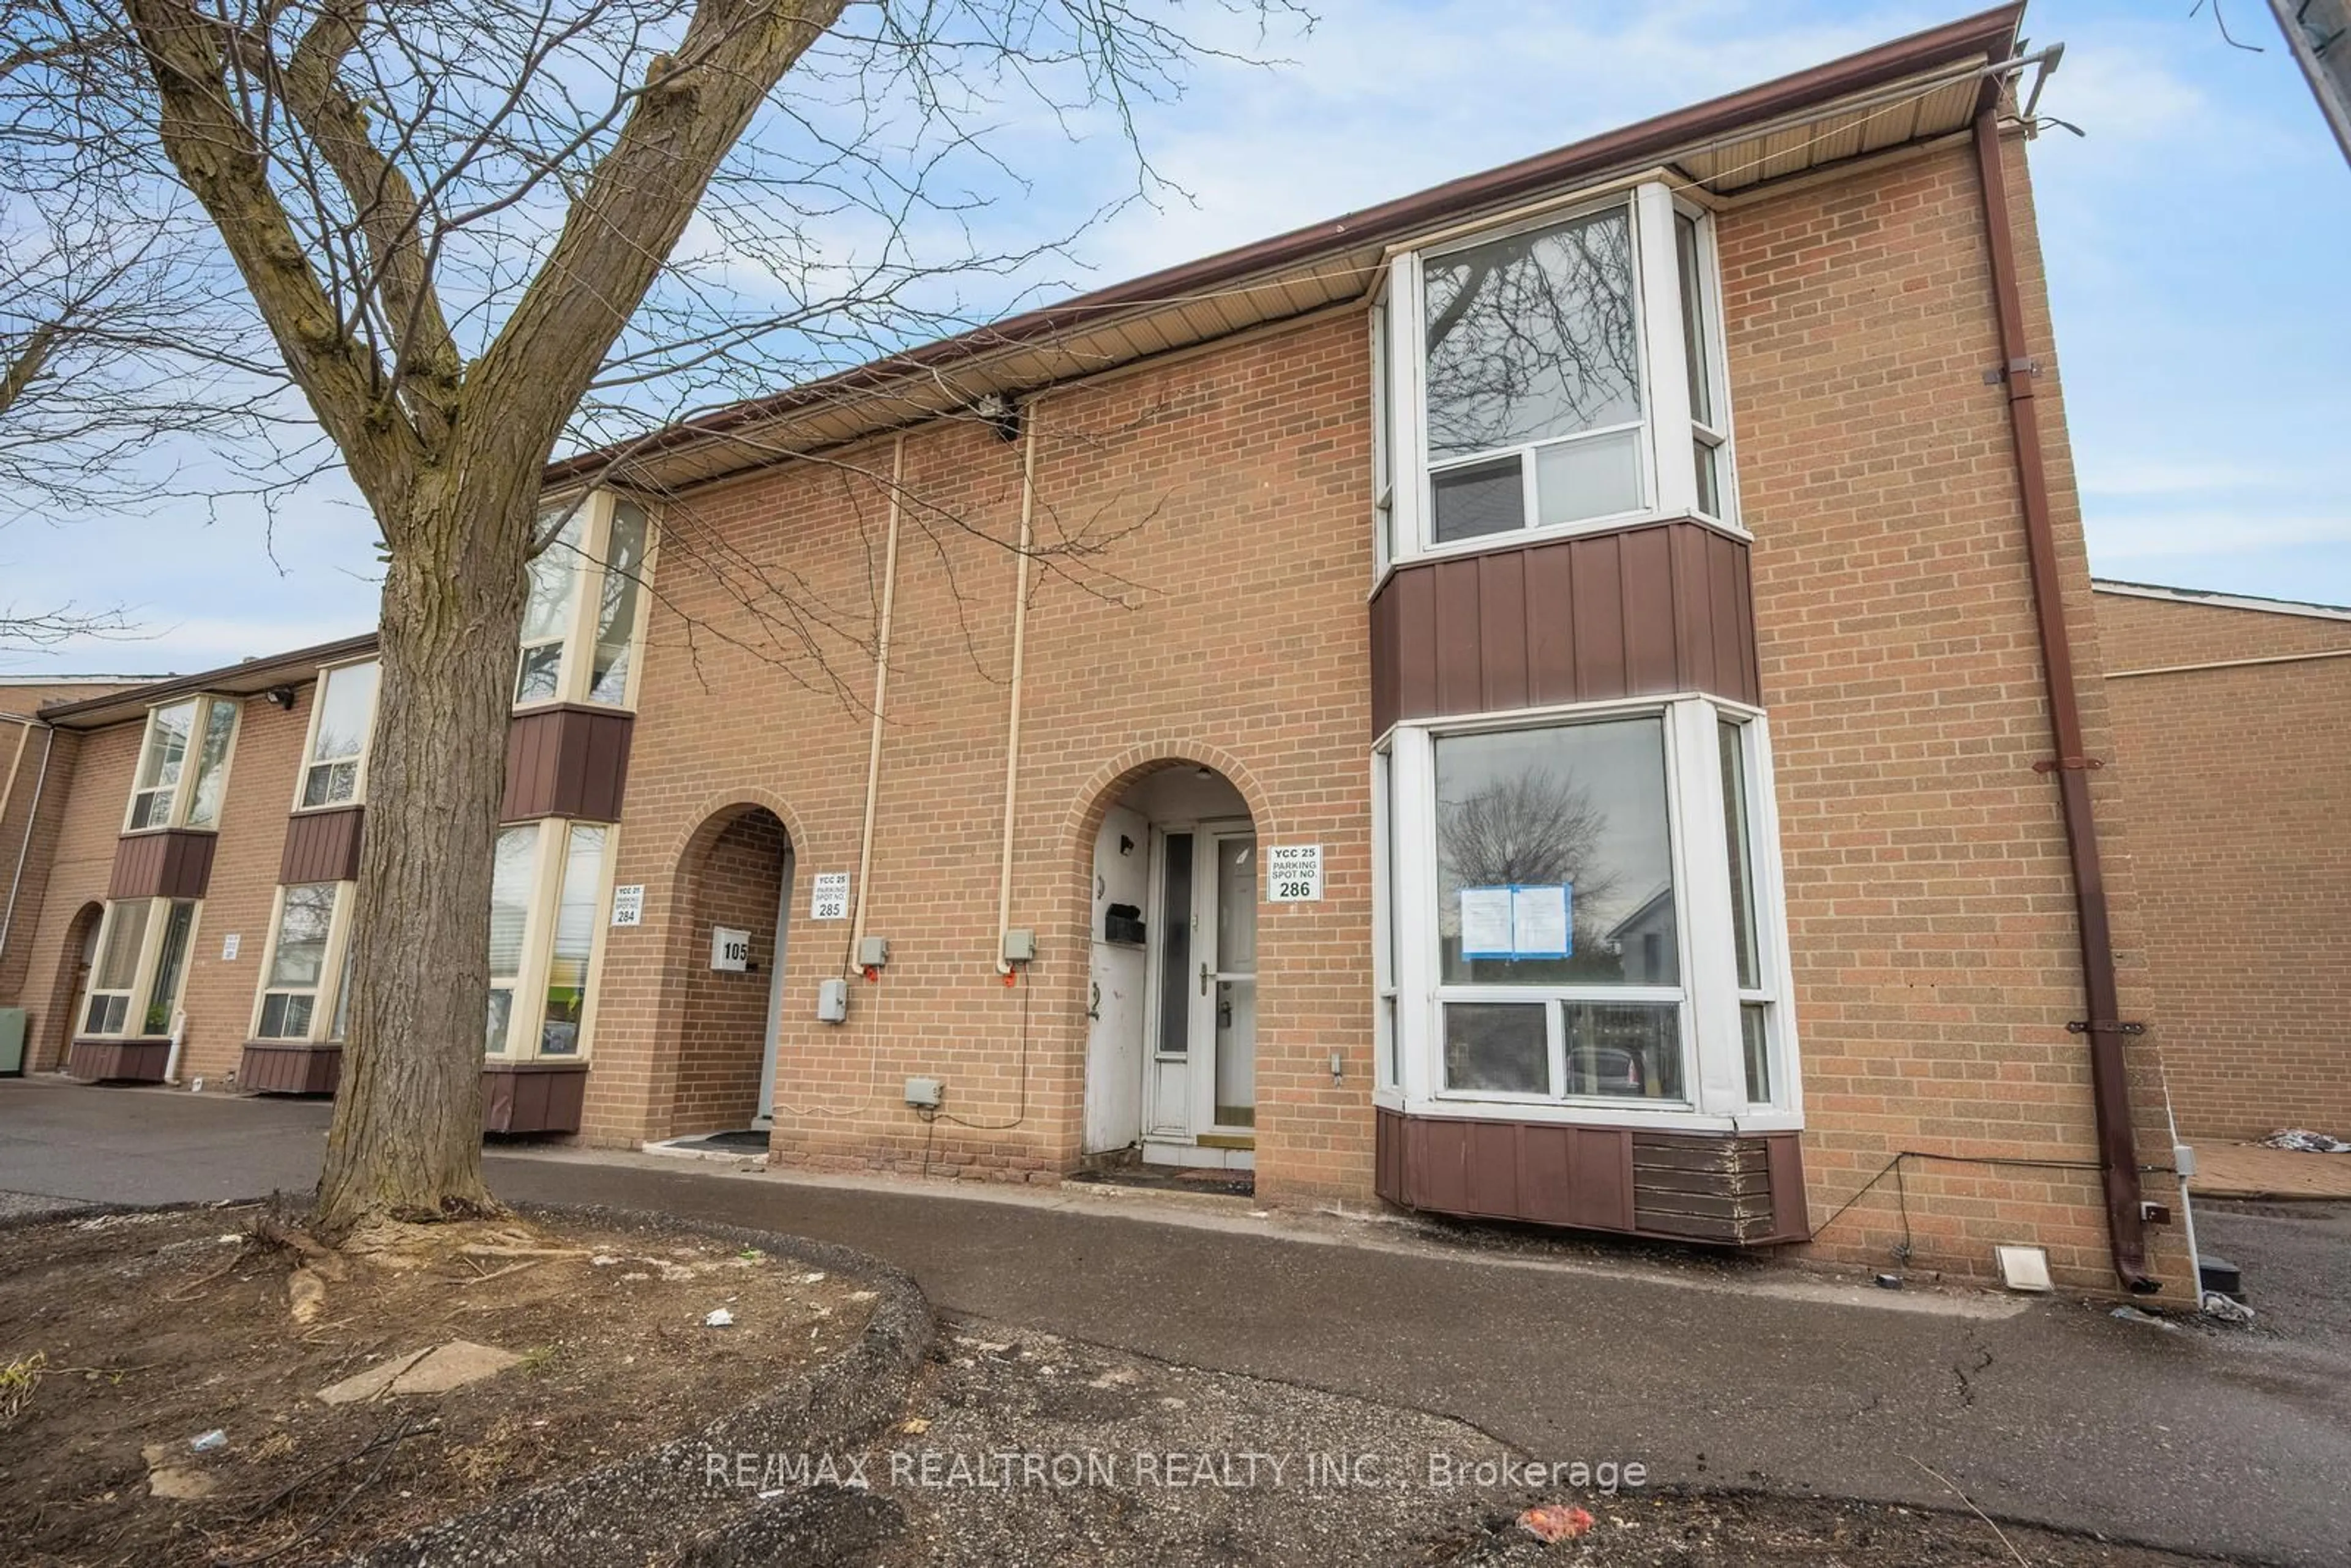
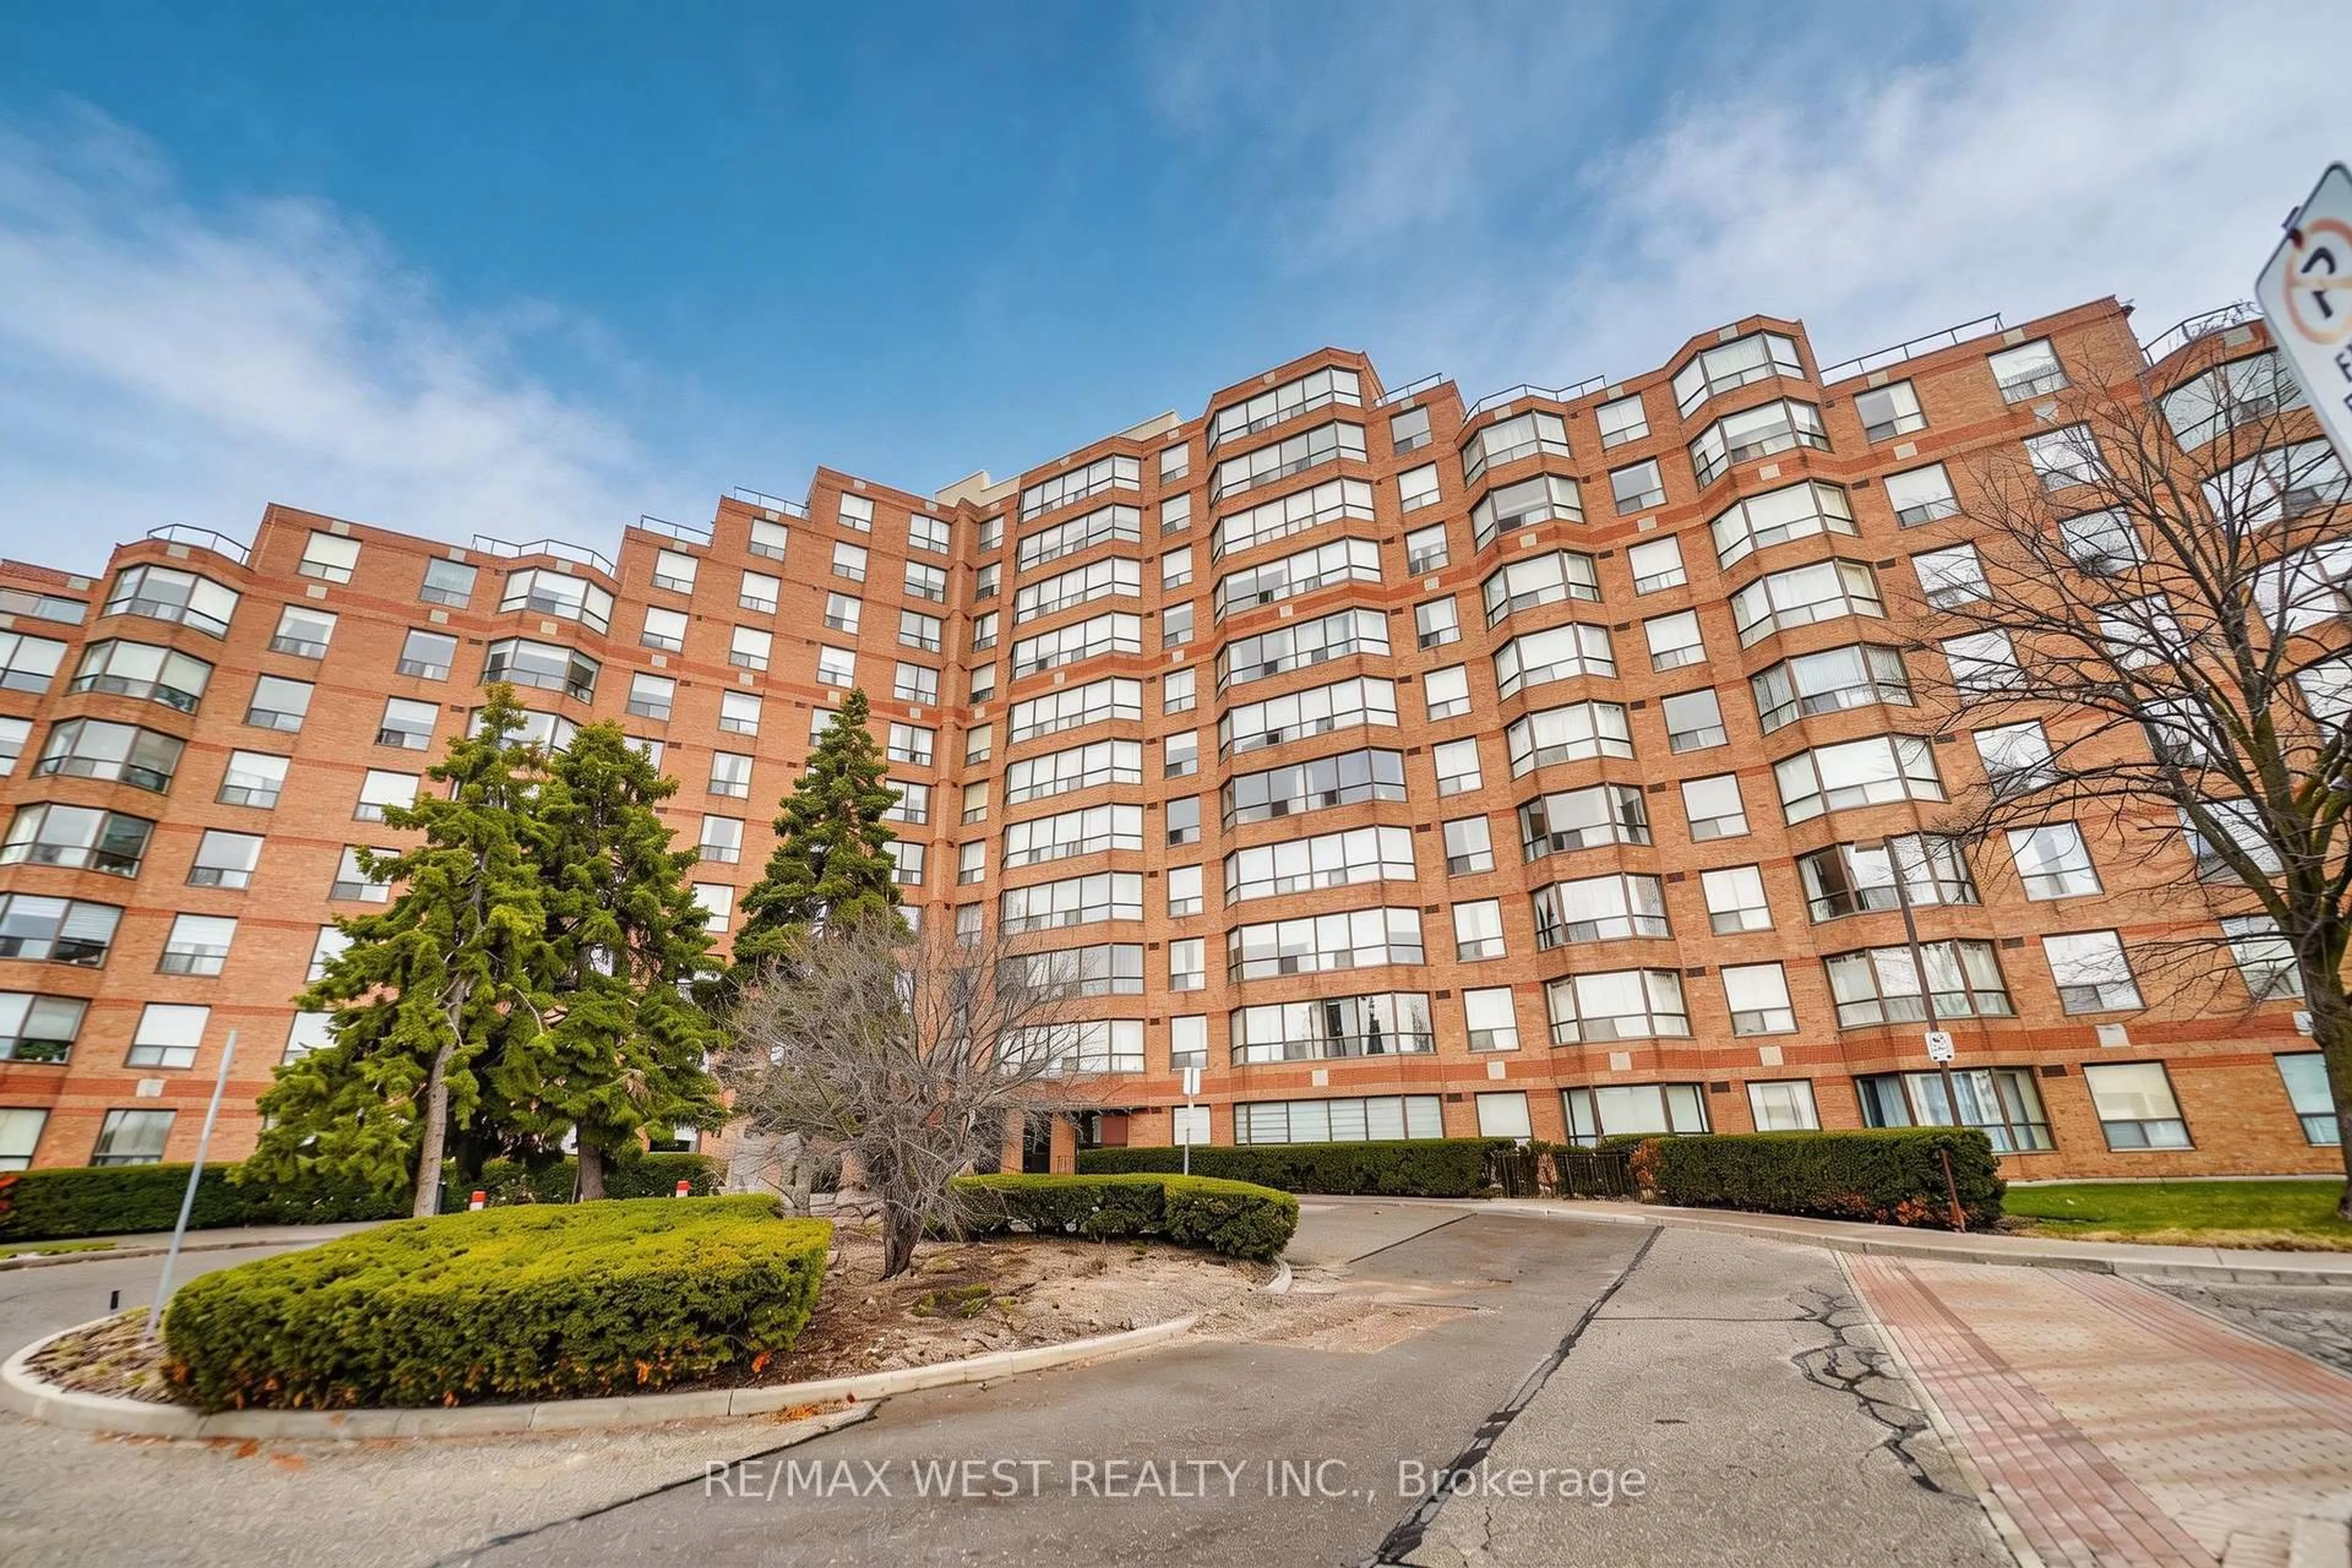
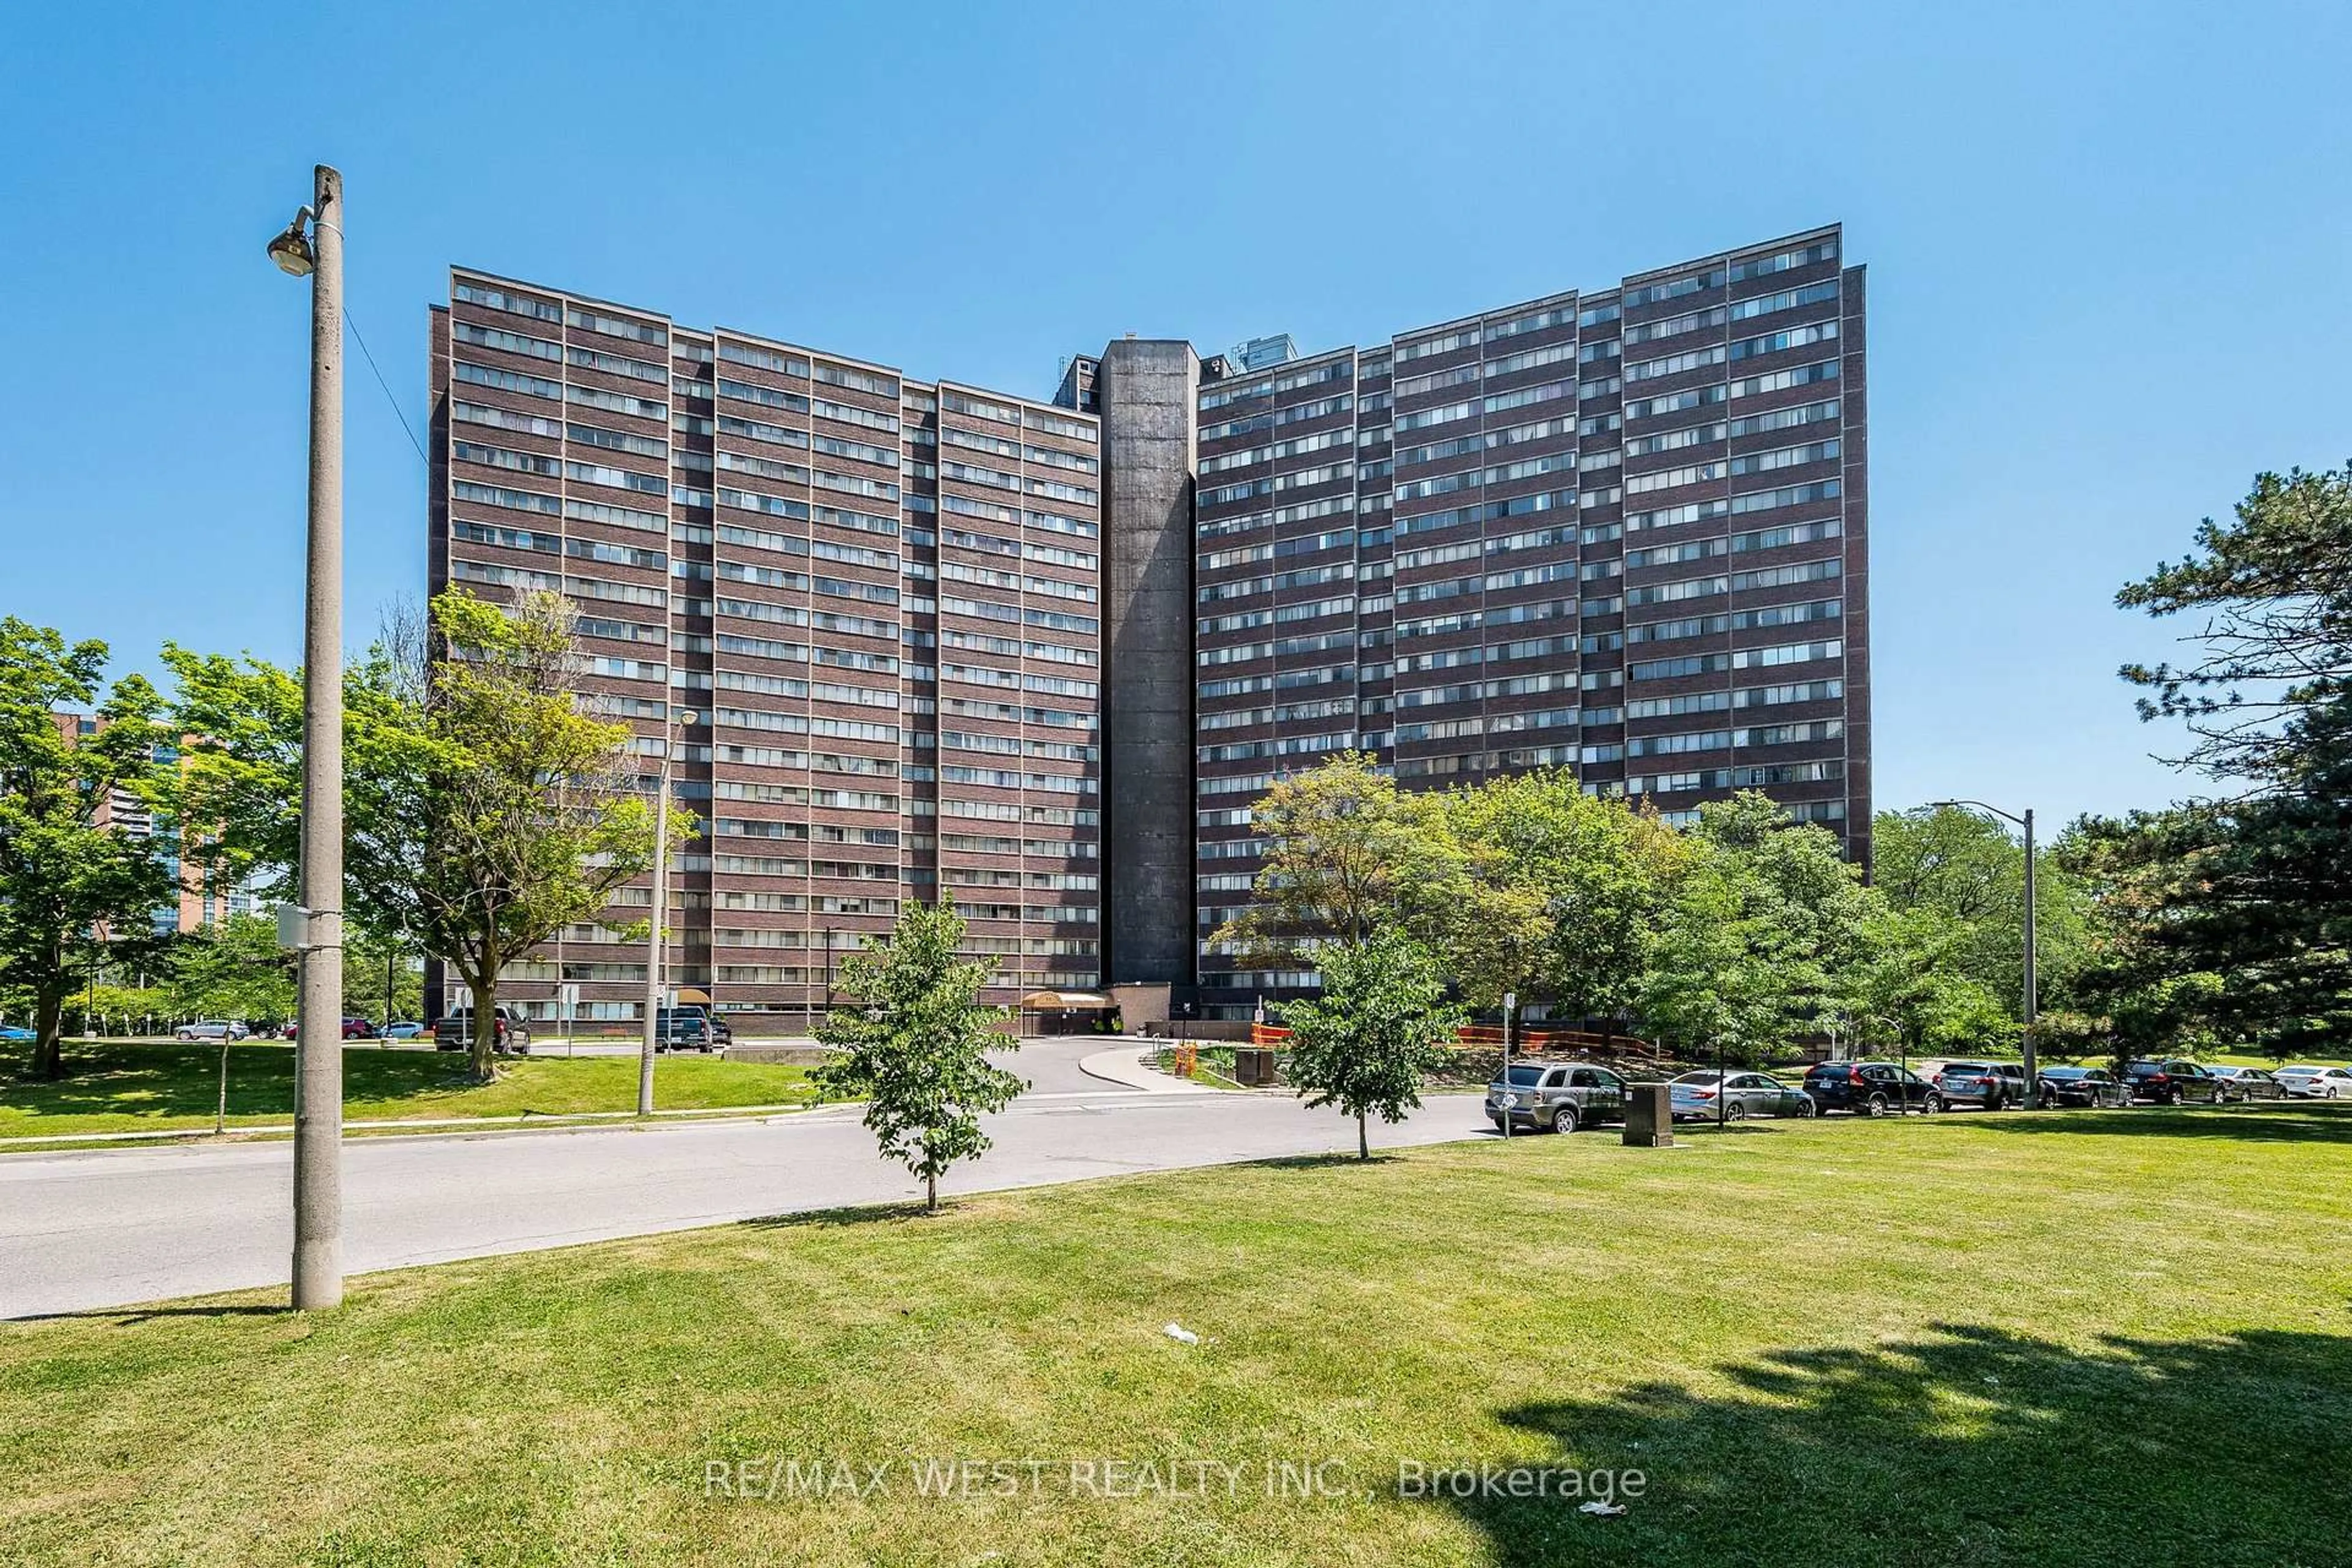
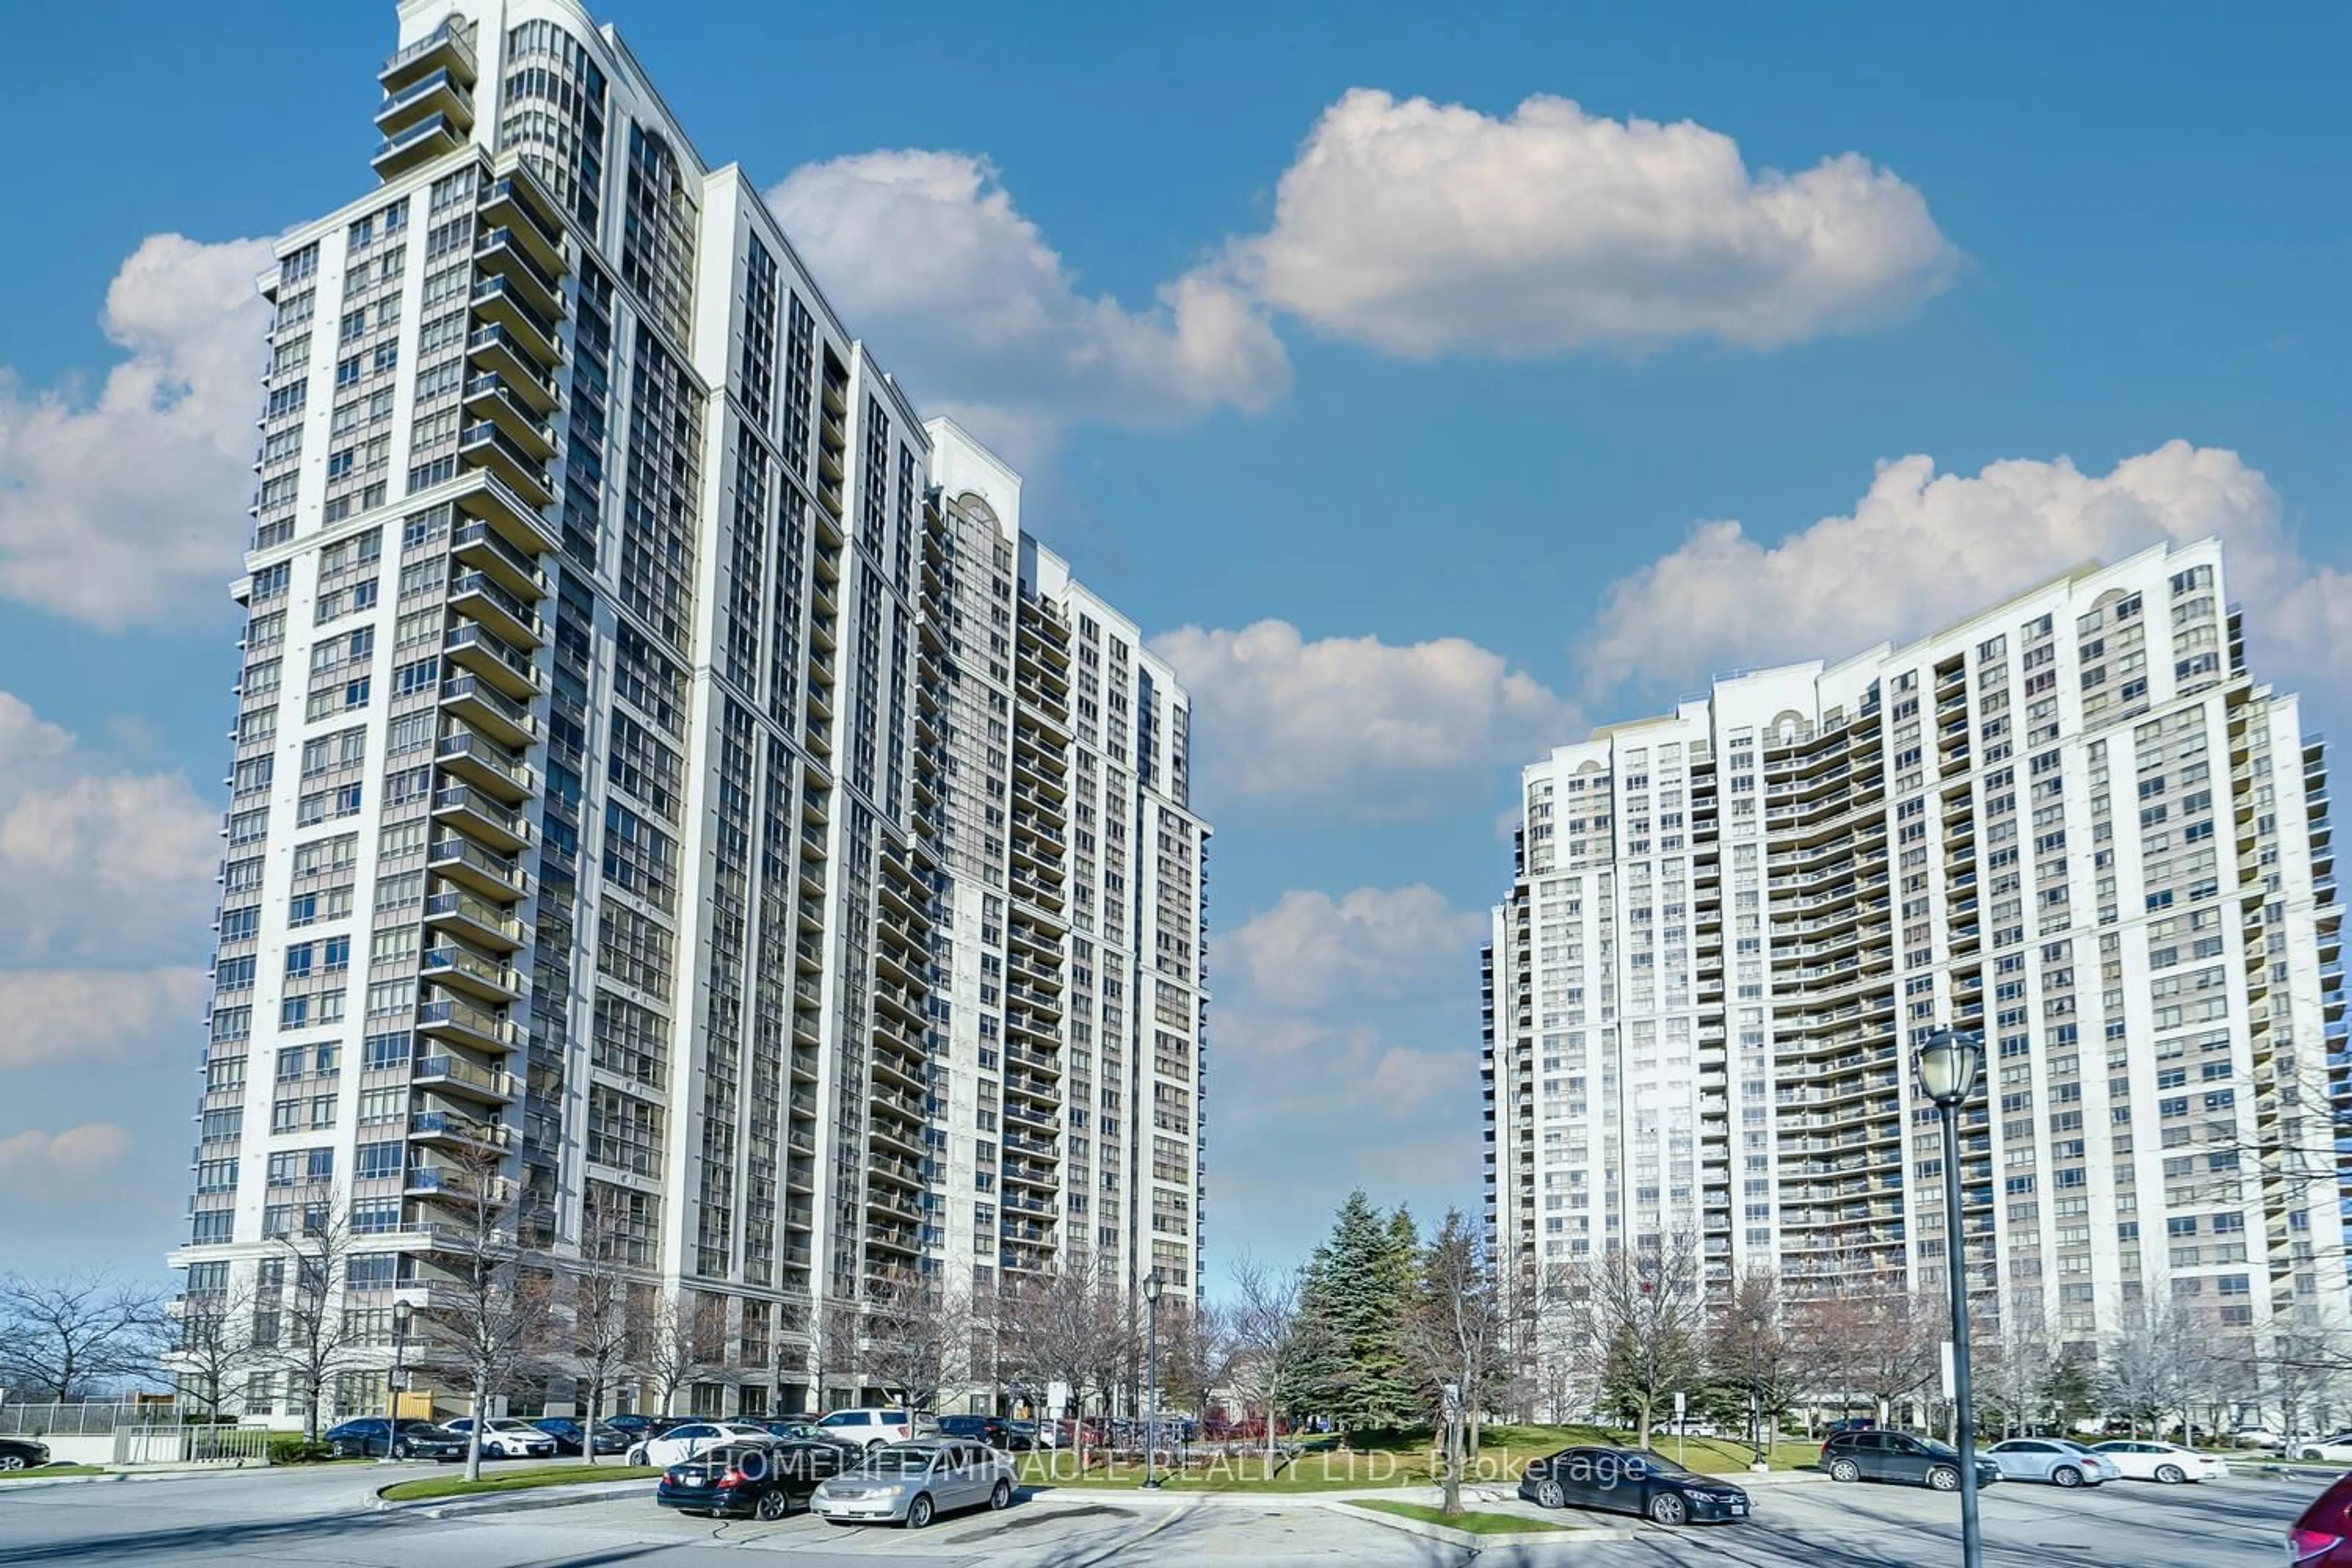
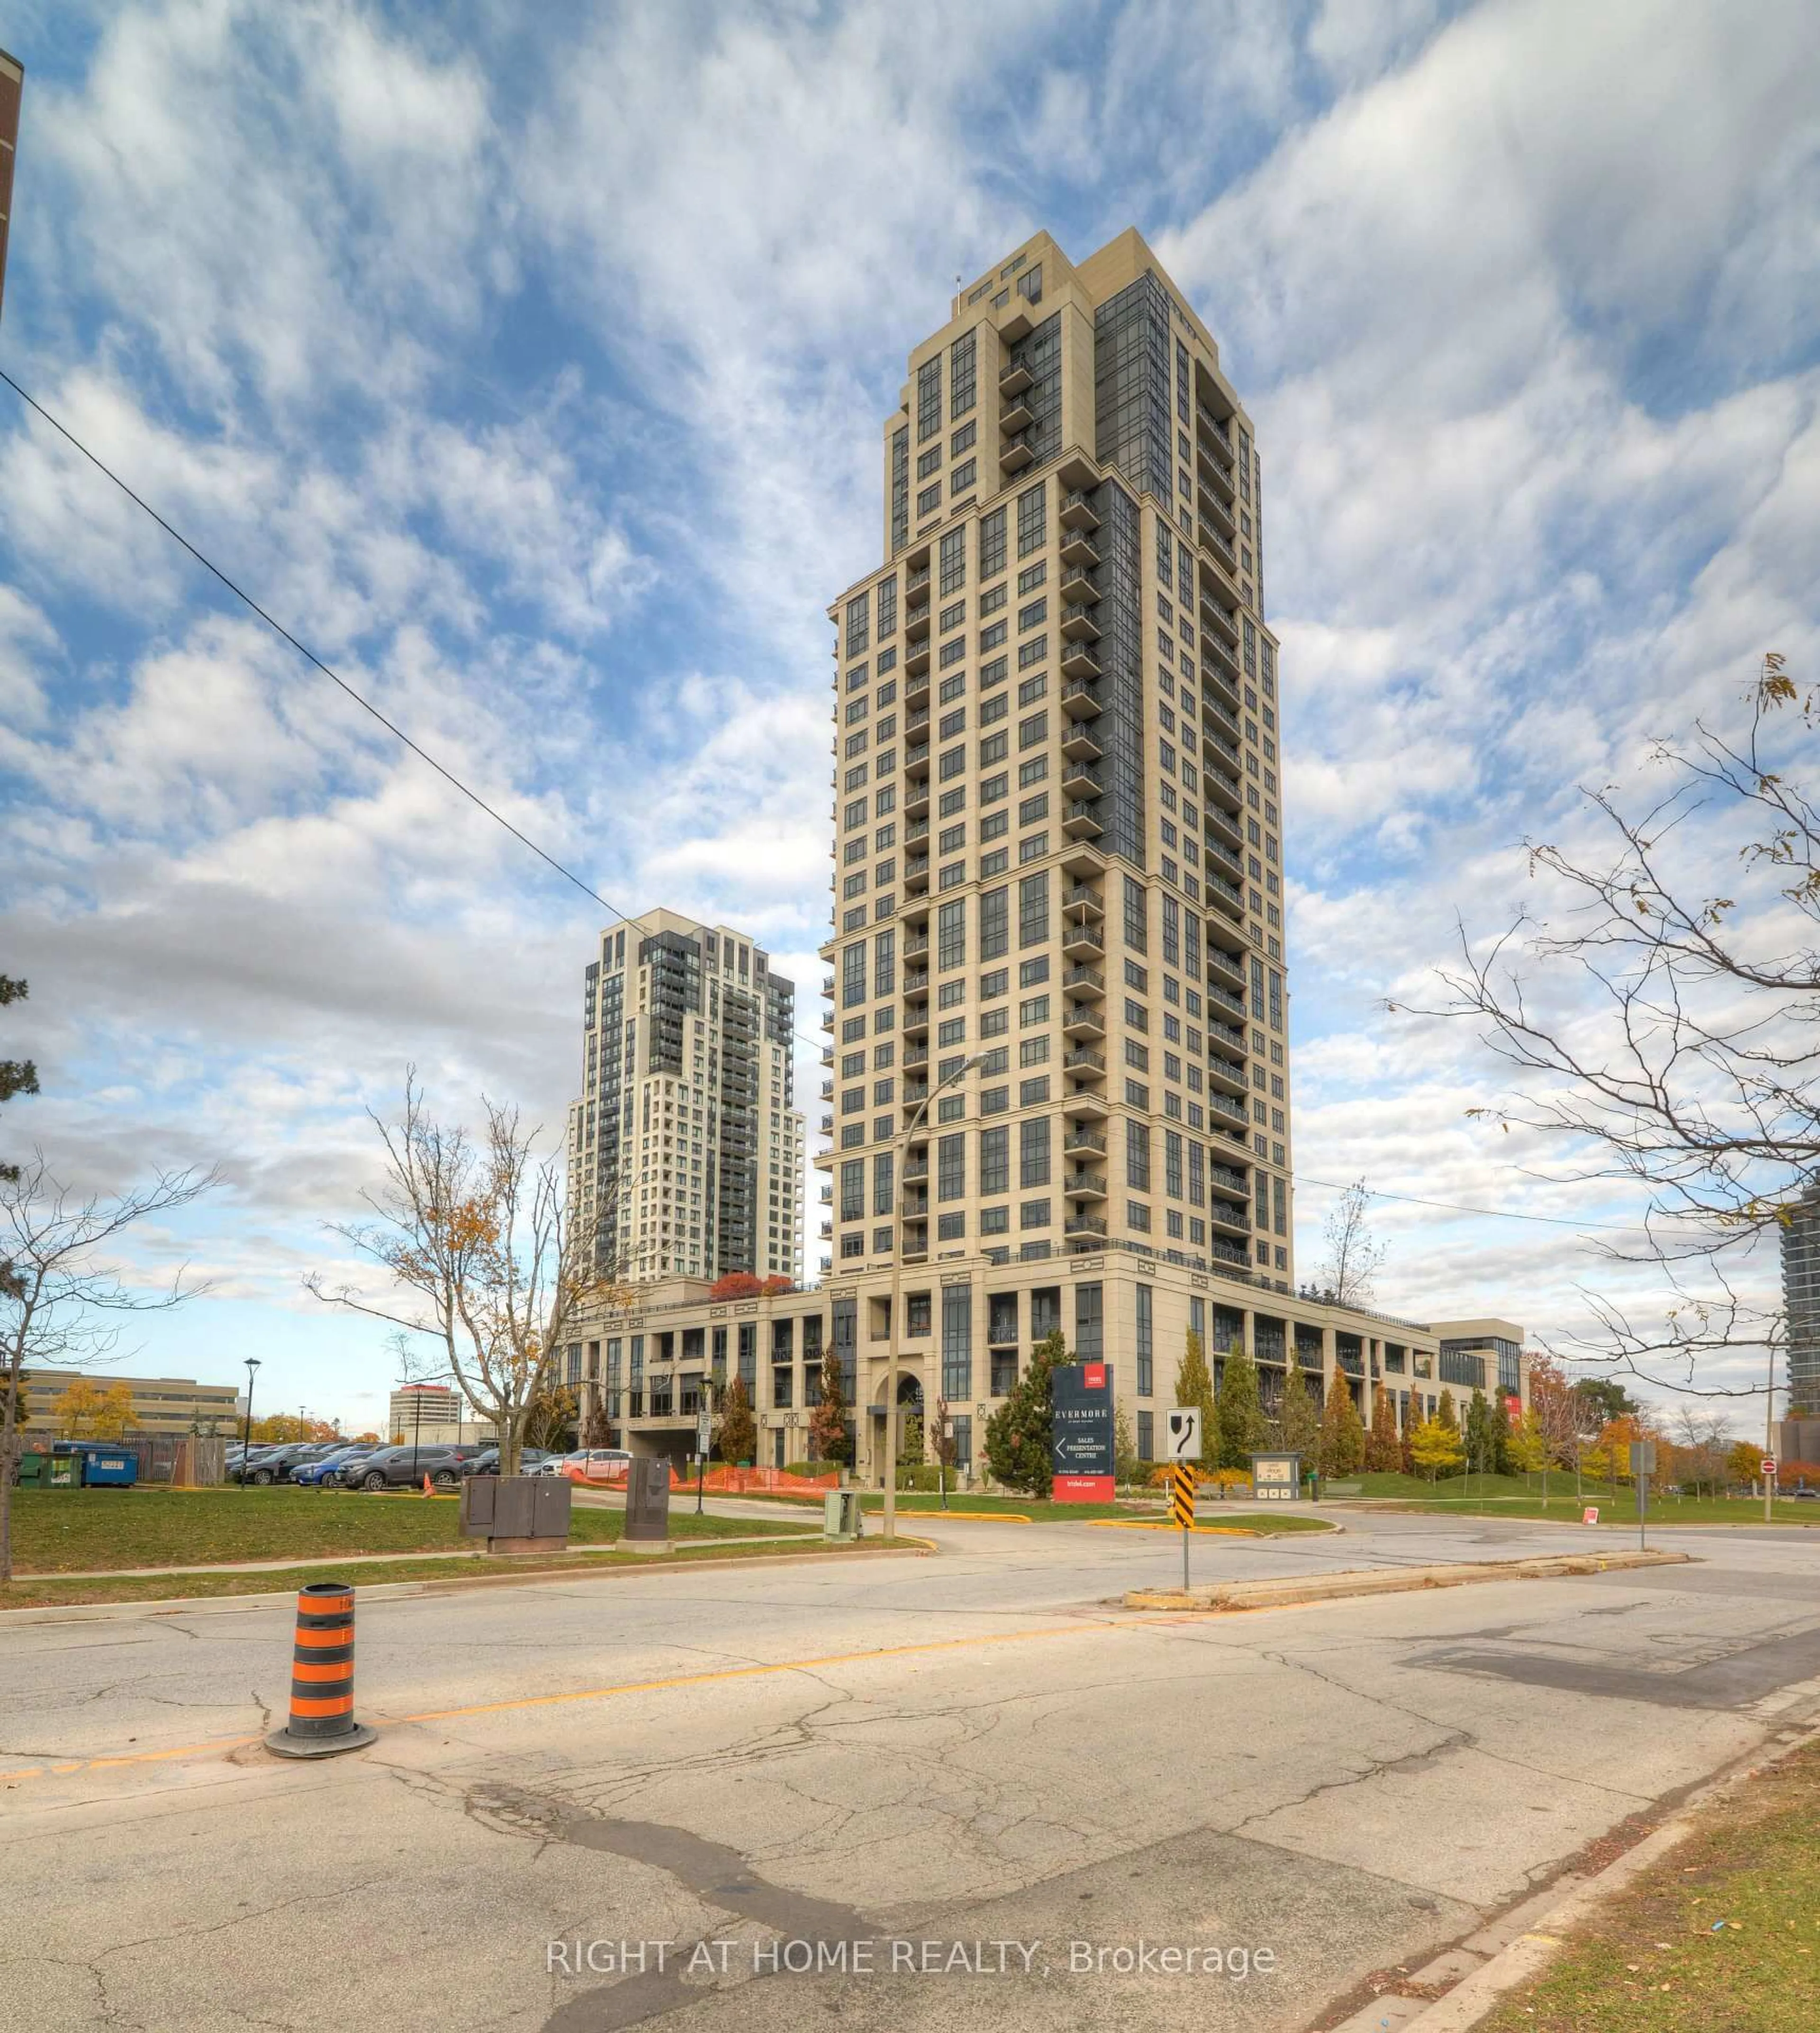
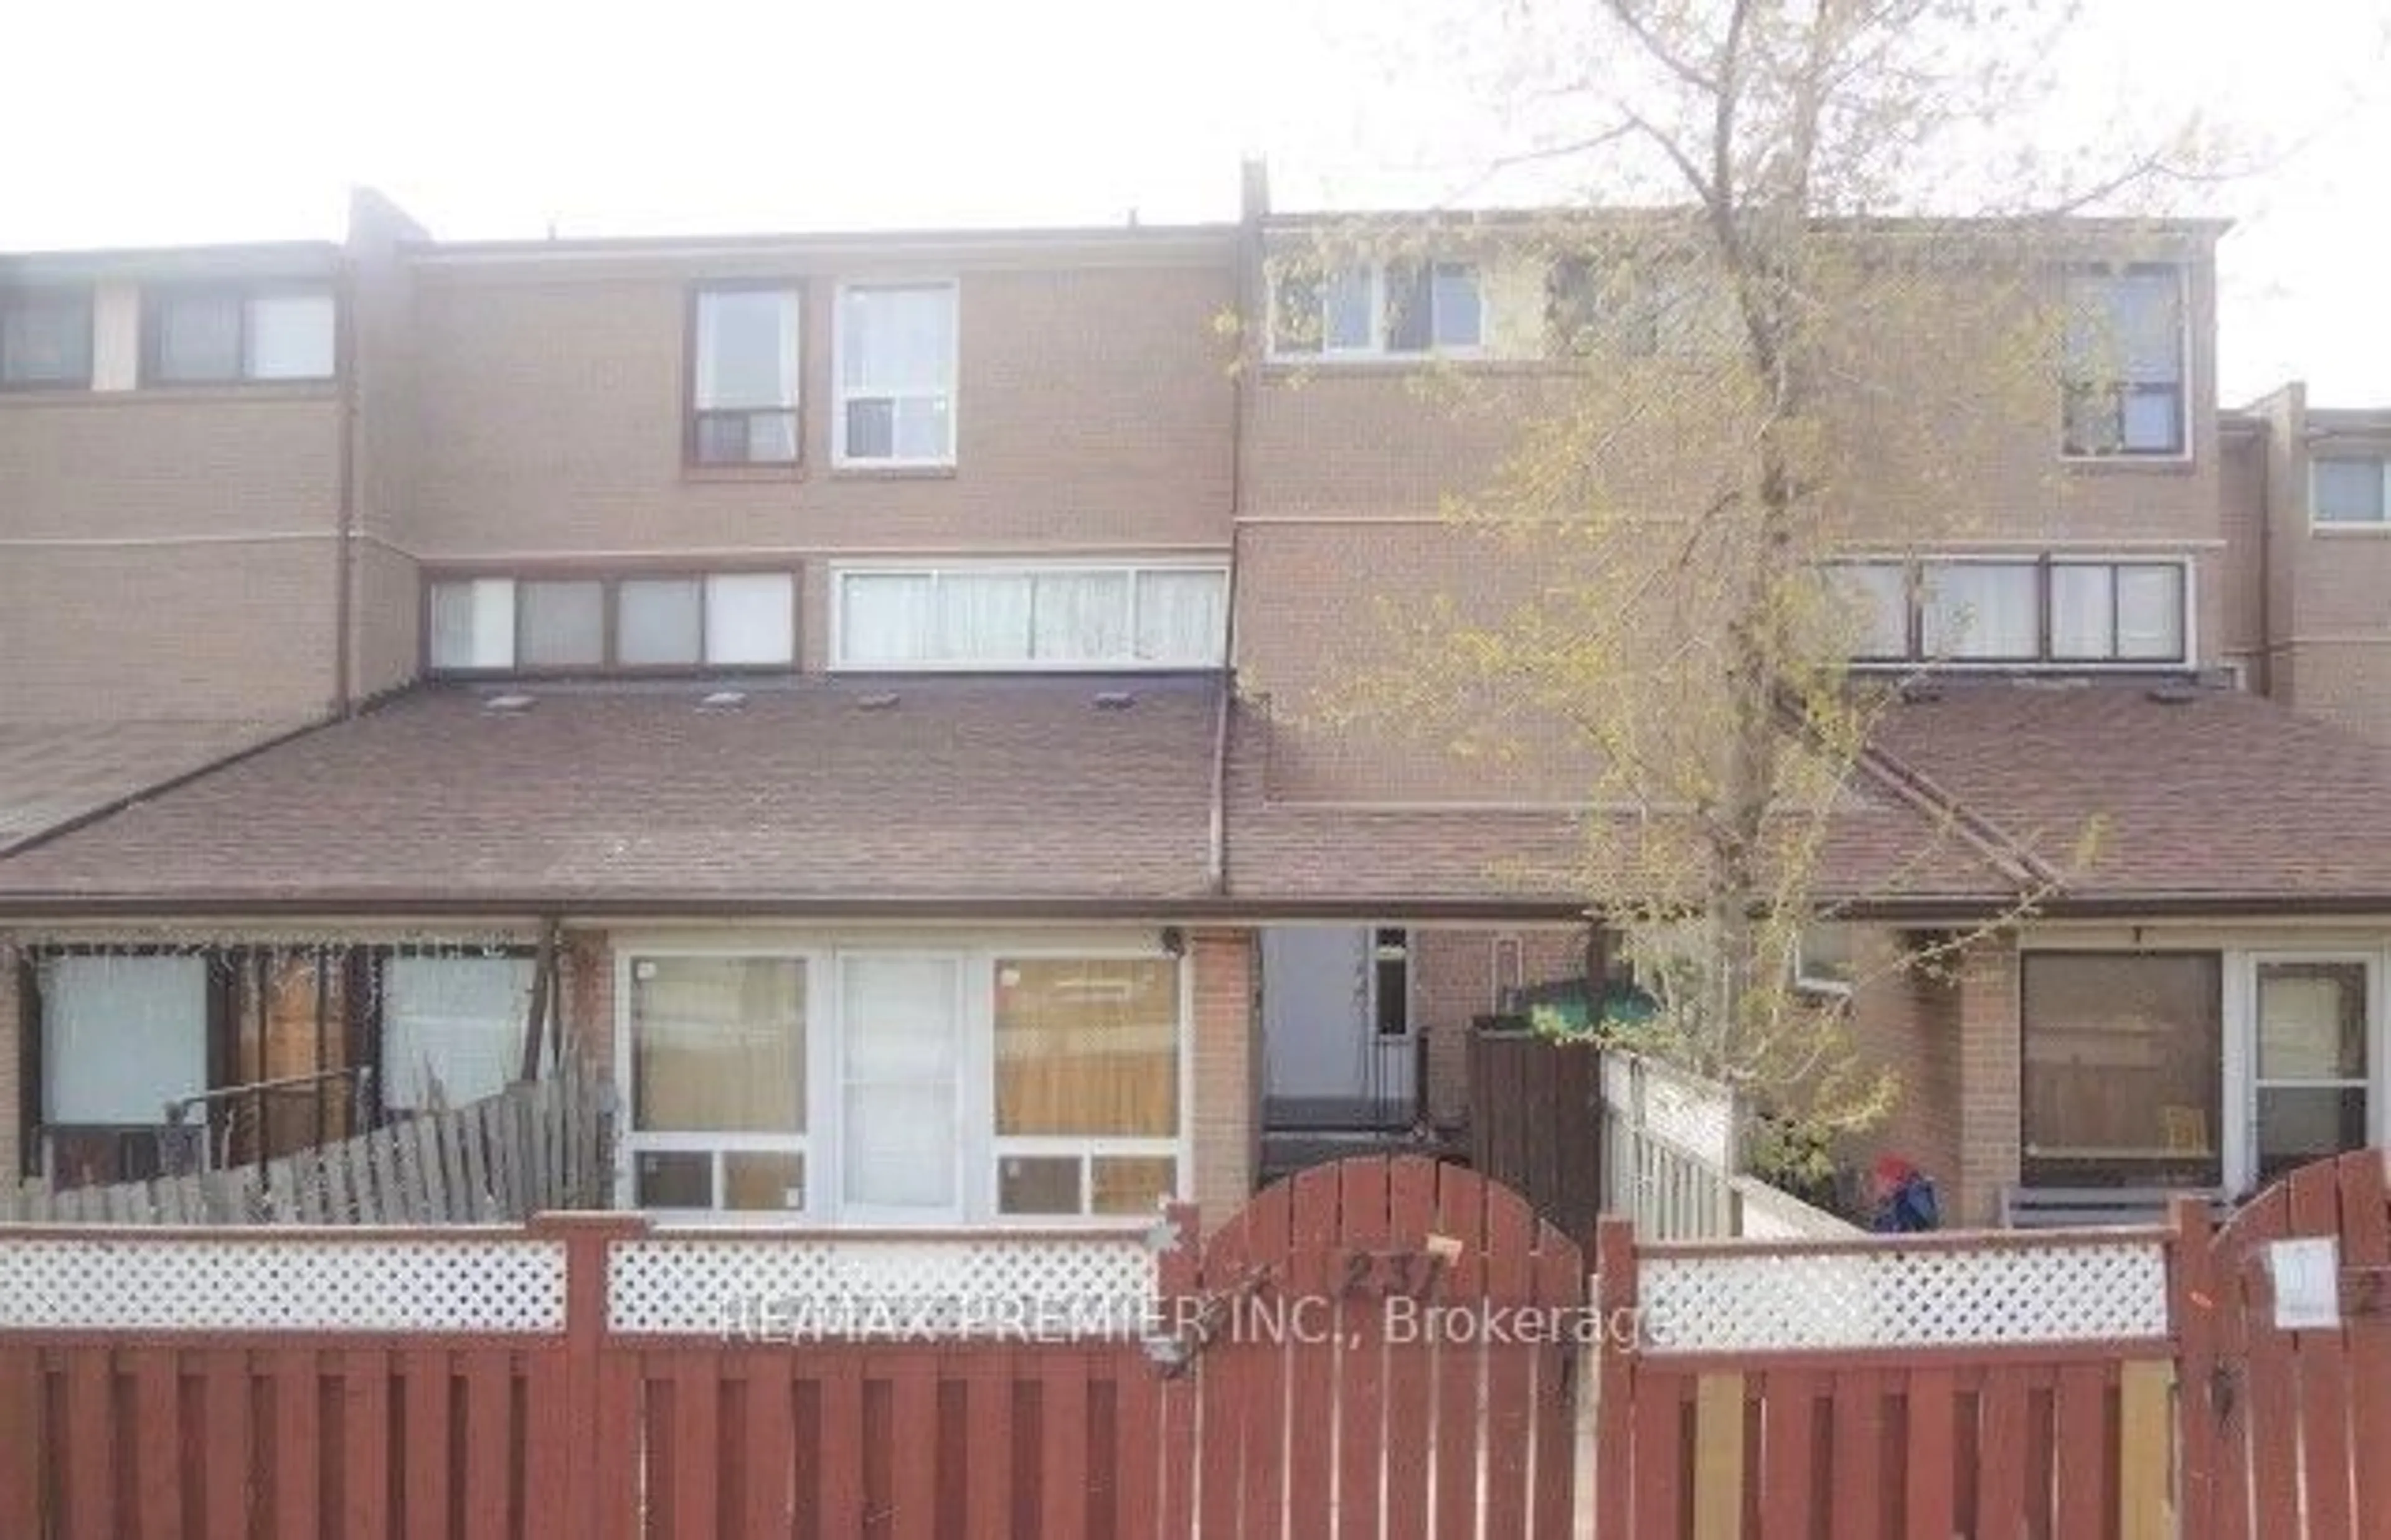
260 John Garland Blvd #231, Toronto, Ontario M9V 1N8
In the same building:
-
Condo
3
2
~1200-1399 sqft
$569,900
Get pre-qualifiedPowered by nesto
Condo
3
2
~1200-1399 sqft
Contact us about this property
Highlights
Days on market94 days
Estimated valueThis is the price Wahi expects this property to sell for.
The calculation is powered by our Instant Home Value Estimate, which uses current market and property price trends to estimate your home’s value with a 90% accuracy rate.Not available
Price/Sqft$441/sqft
Monthly cost
Open Calculator
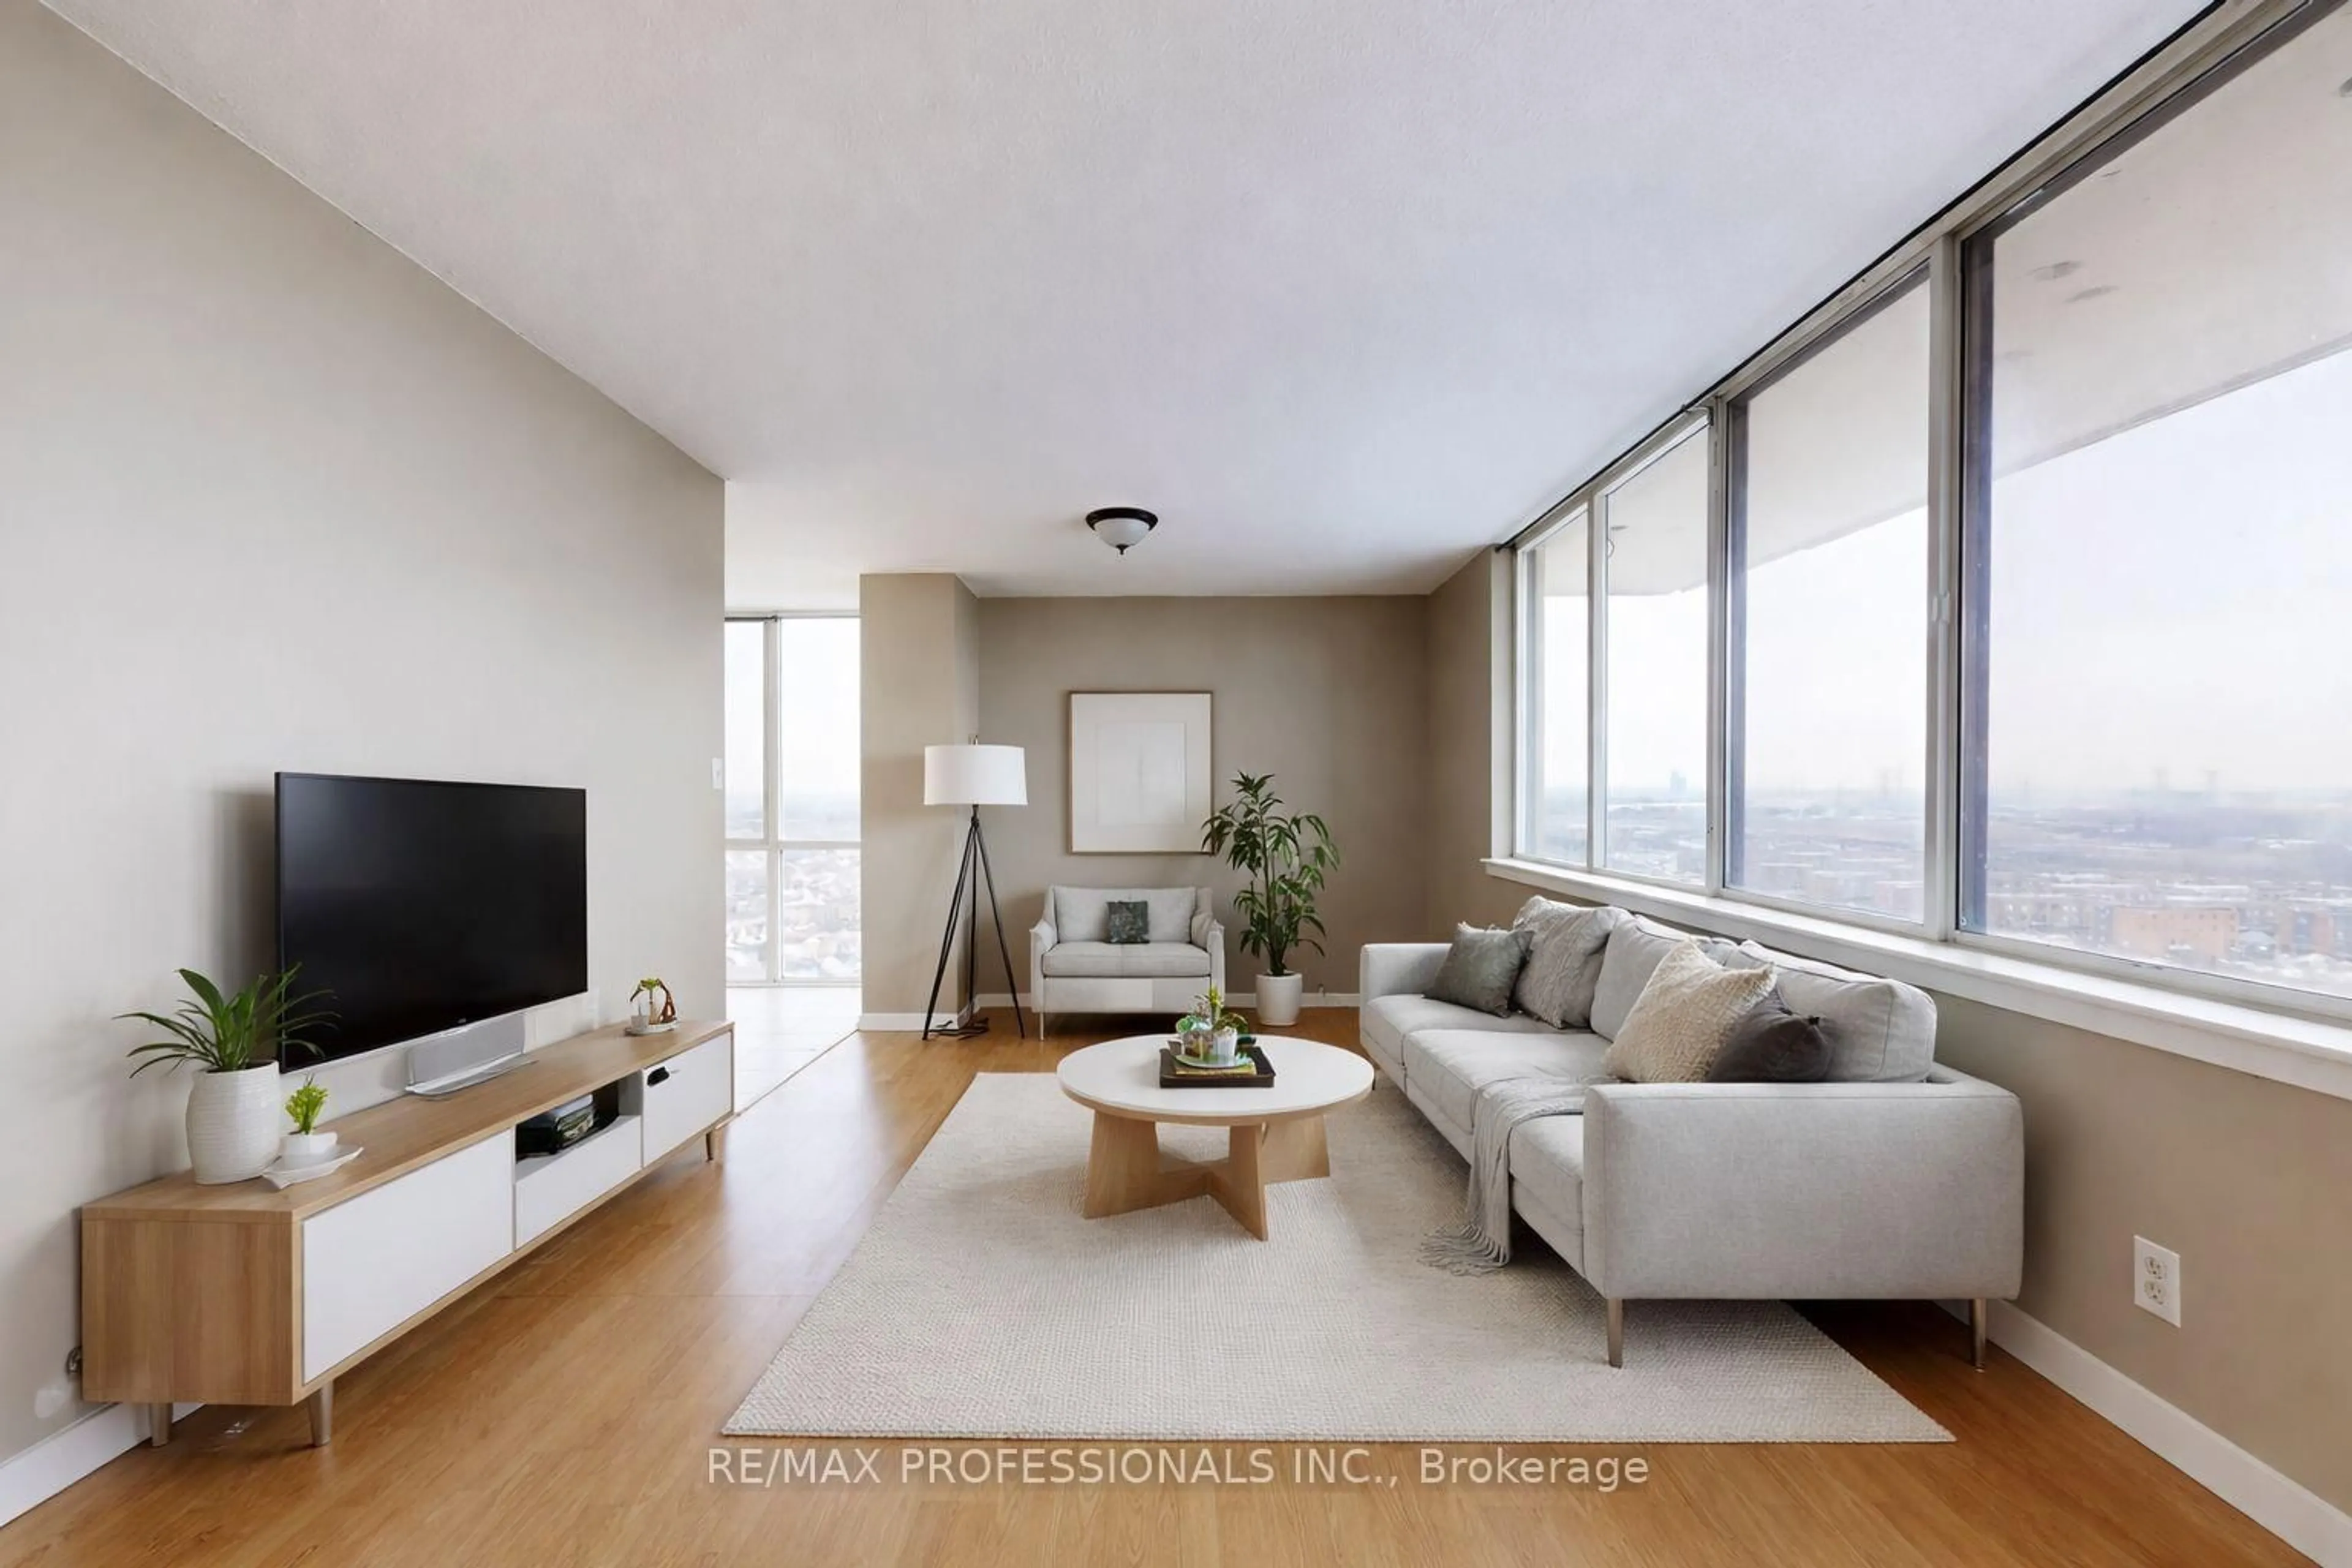
Description
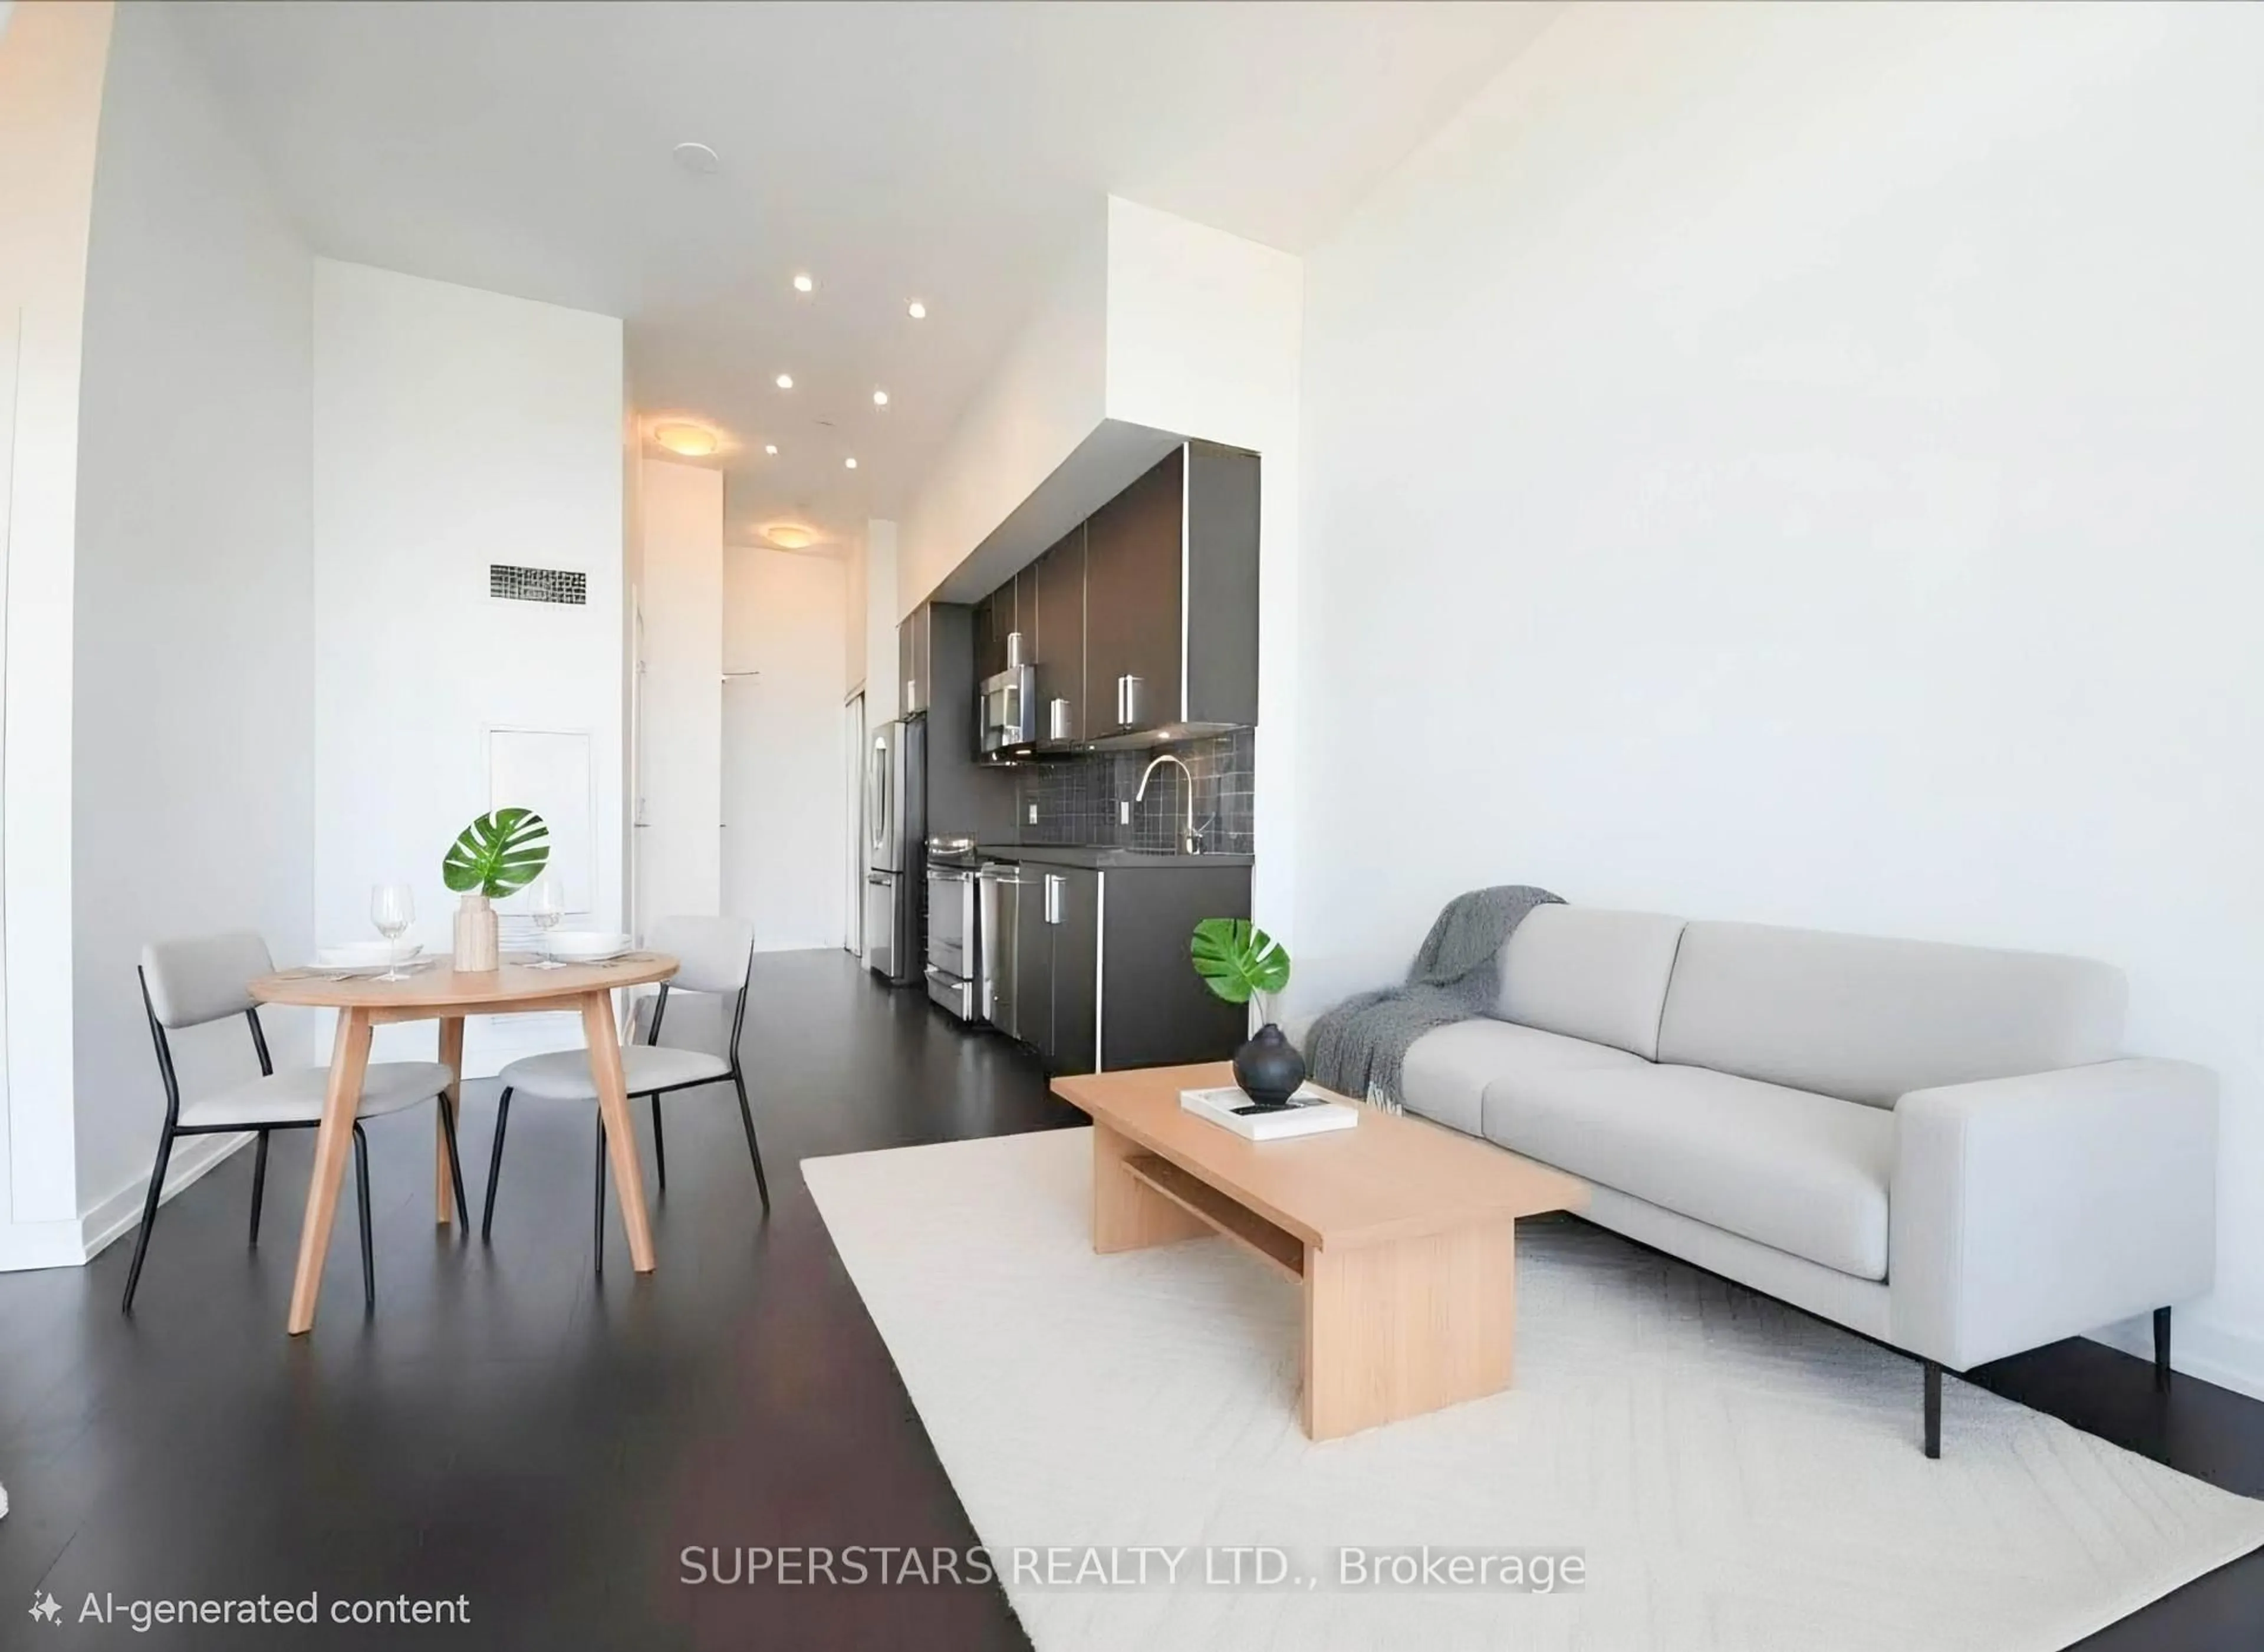
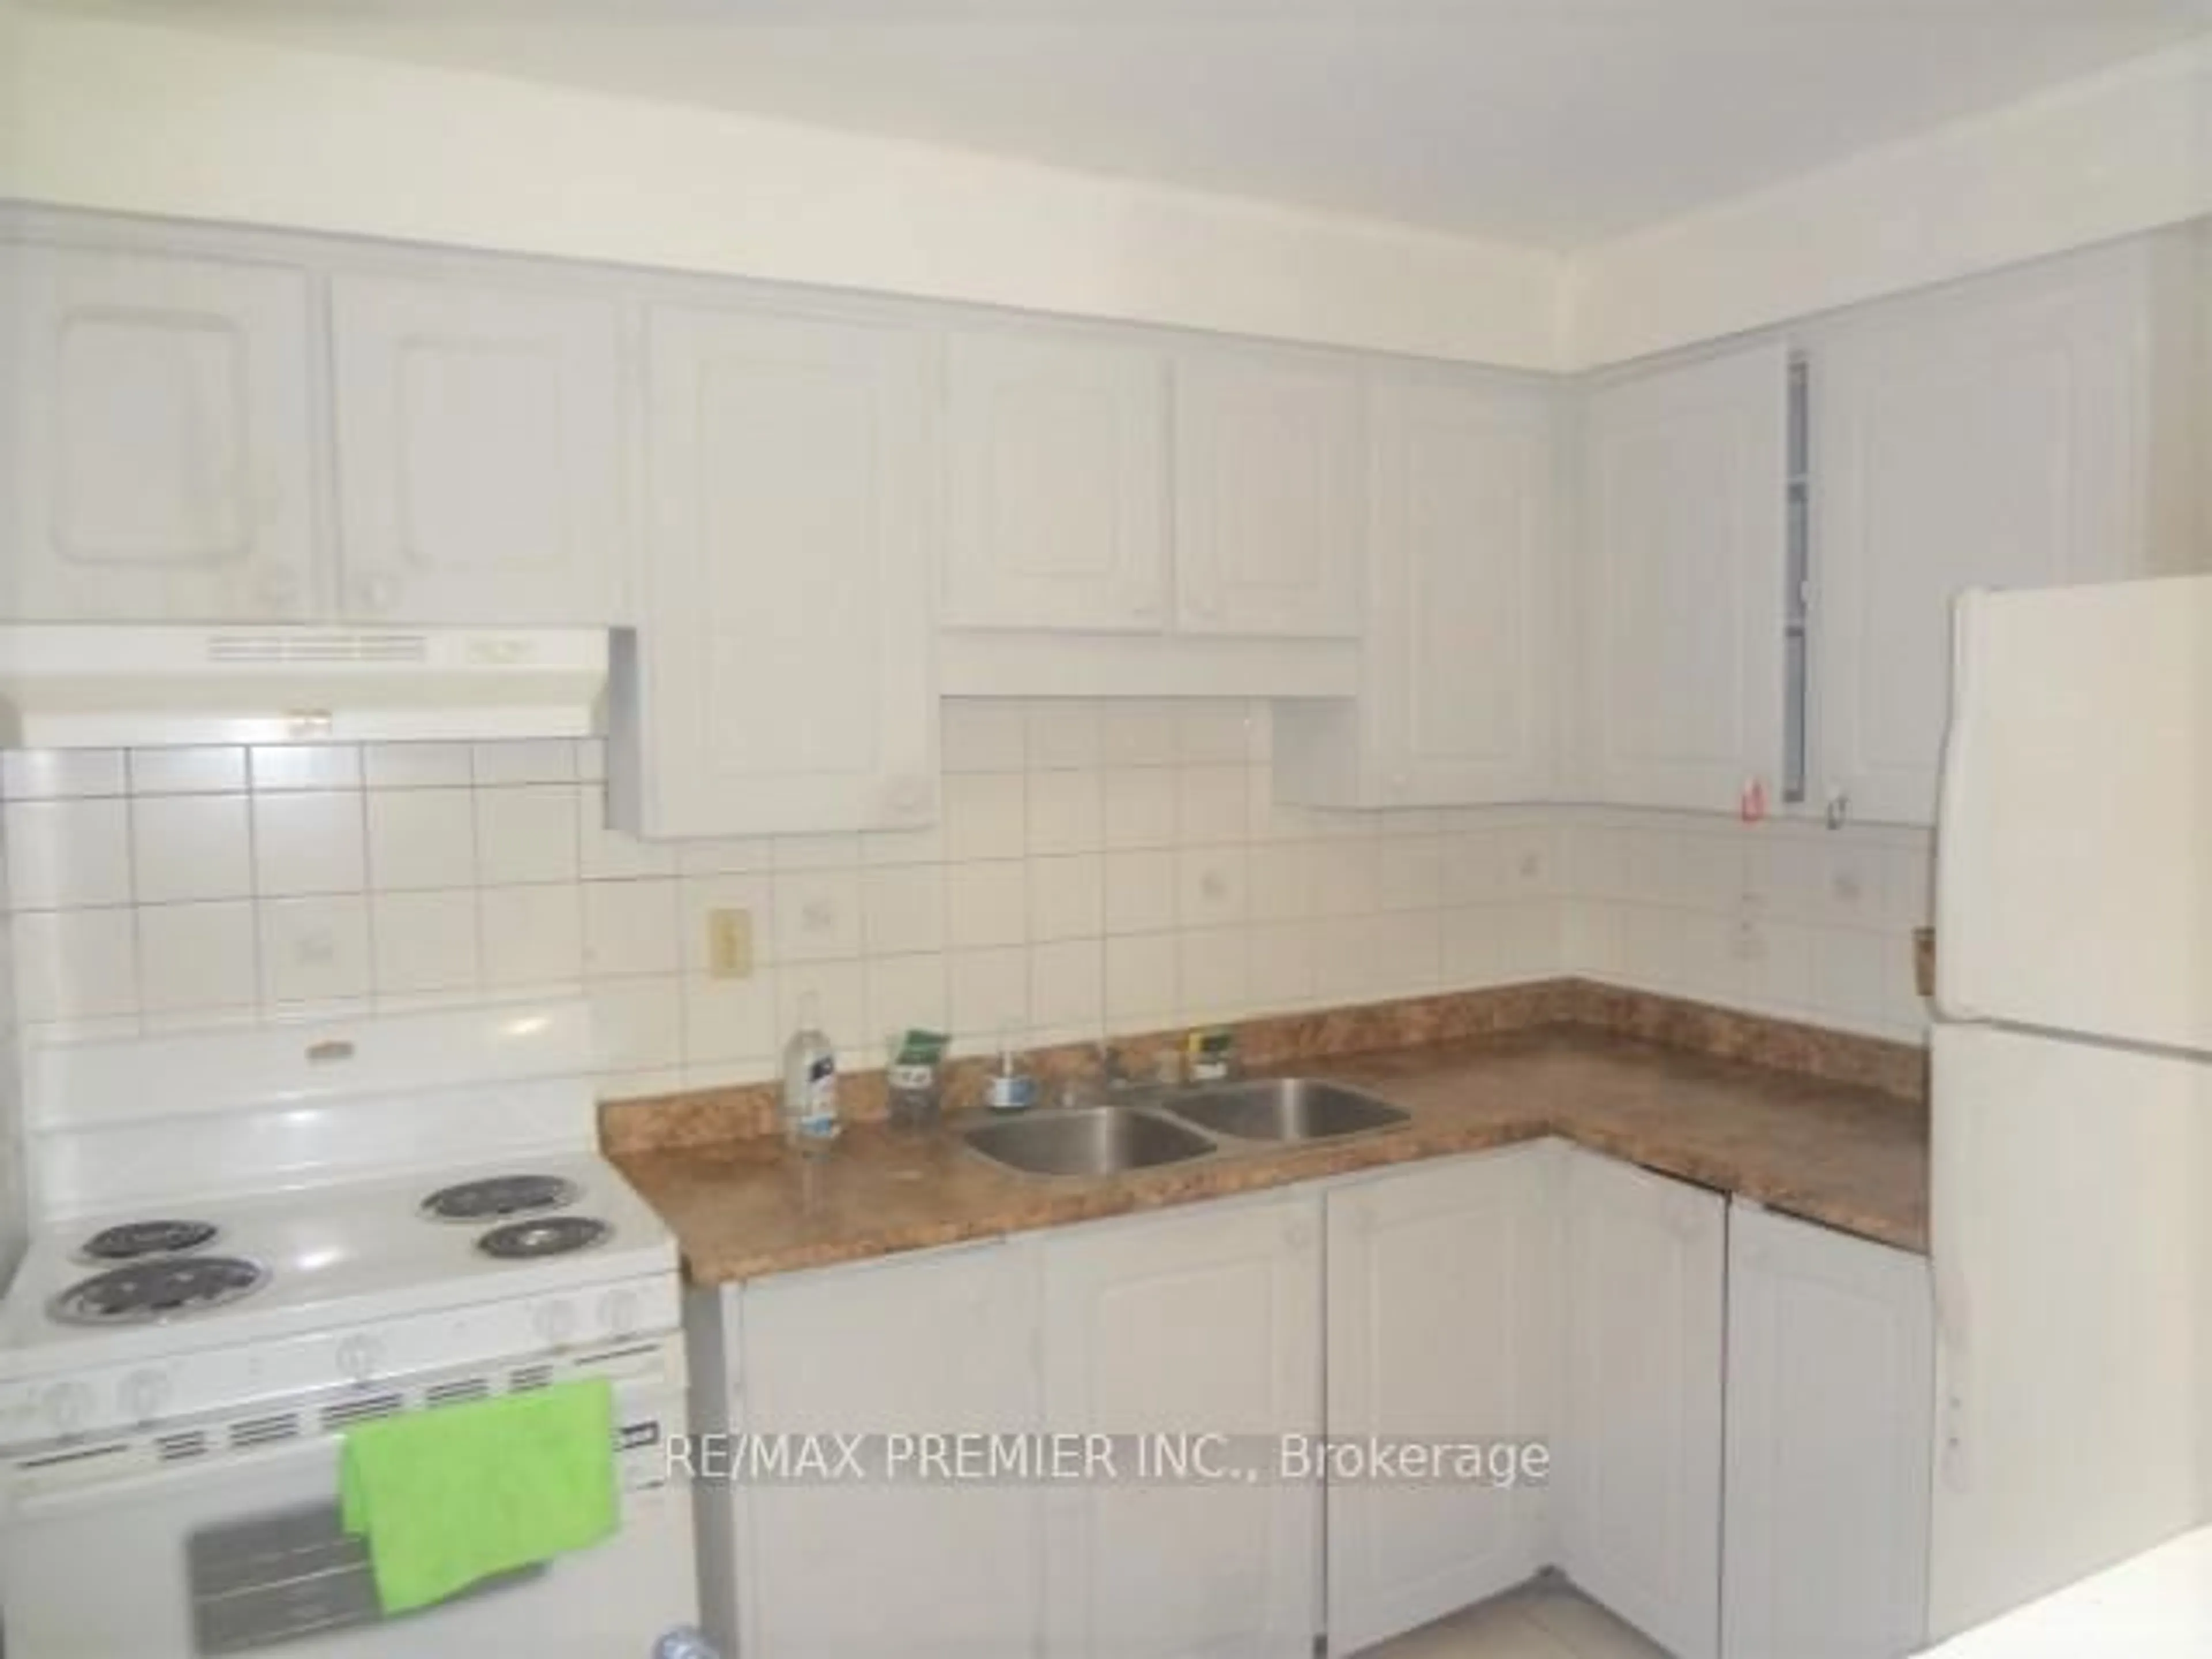
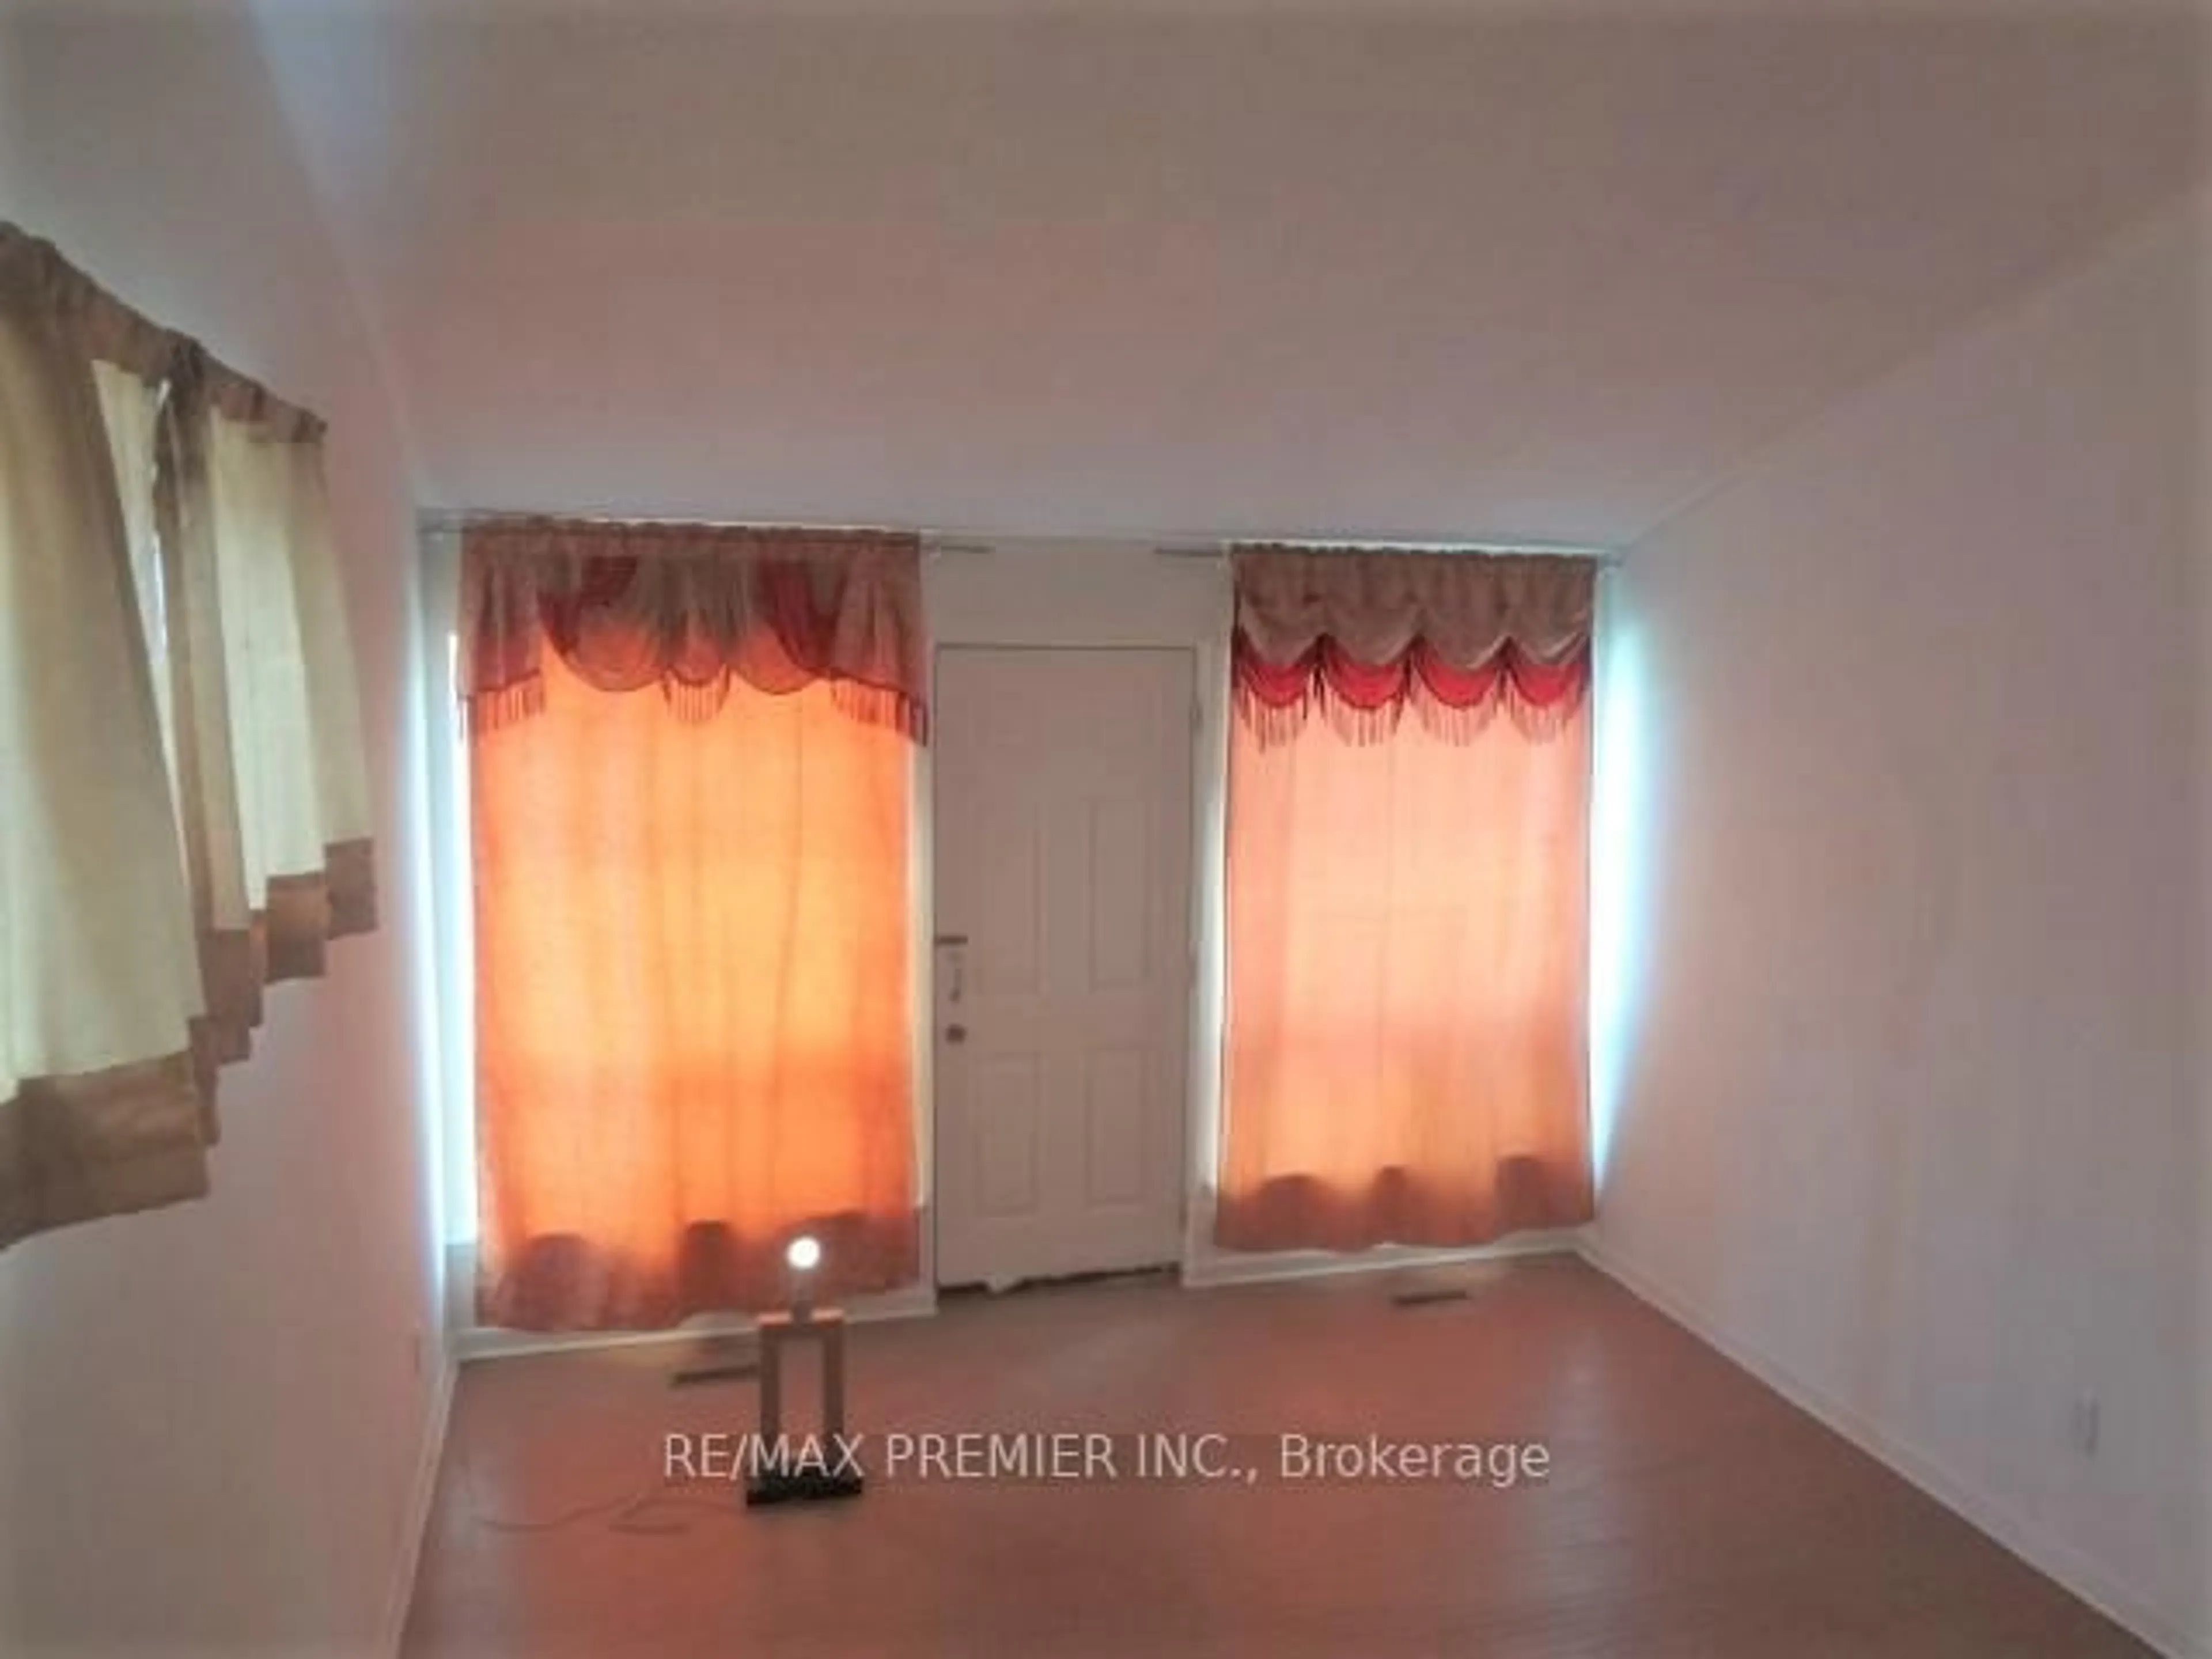
Bright & Spacious Three Bedroom Condo Townhome .... Nice Sized Three Bedrooms .... Two Bathrooms ... Hardwood Flooring ..... Finished Basement with Rec Room & Laundry & Much More .
Property Details
Style3-Storey
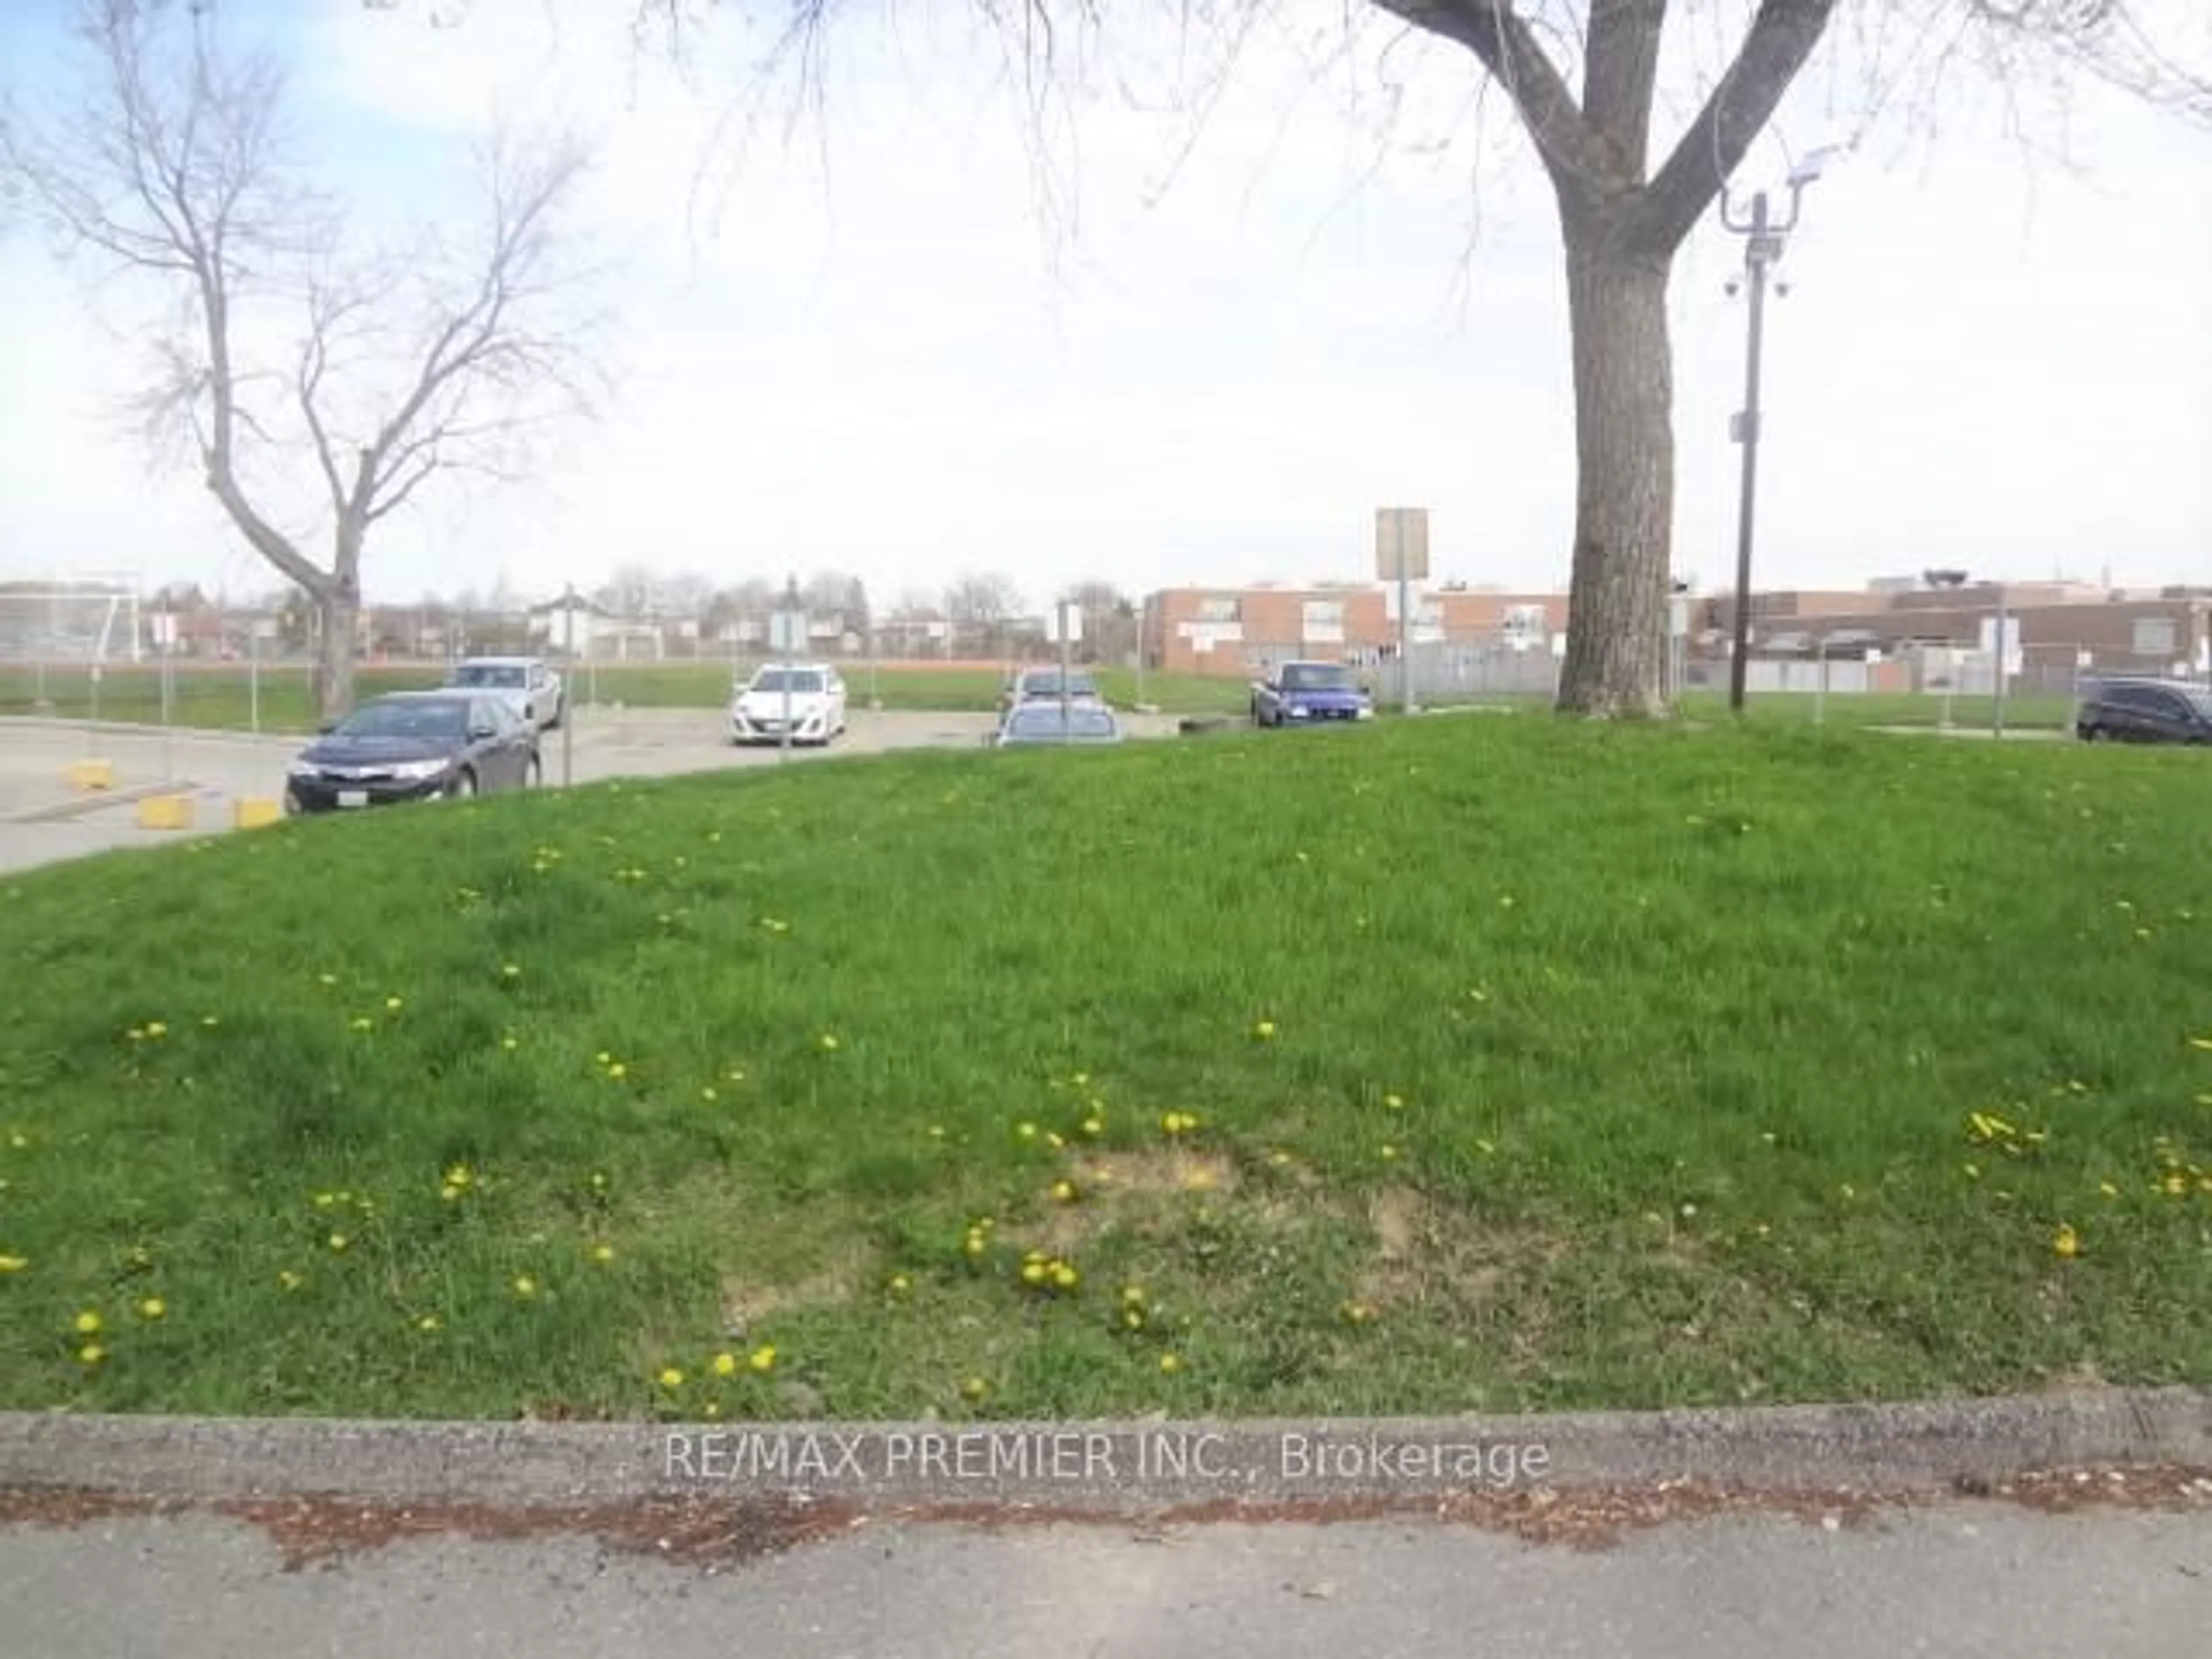
View-
Age of property-
SqFt~1200-1399 SqFt
Lot Size-
Parking Spaces1
MLS ®NumberW13045406
Community NameSmithfield-Clairville
Data SourceTRREB
Listing byRE/MAX PREMIER INC.
Interior
Features
Heating: Forced Air
Cooling: Central Air
Basement: Part Fin
2nd Floor
Primary
3.8 x 4.72Hardwood Floor
2nd Br
3.8 x 2.453rd Br
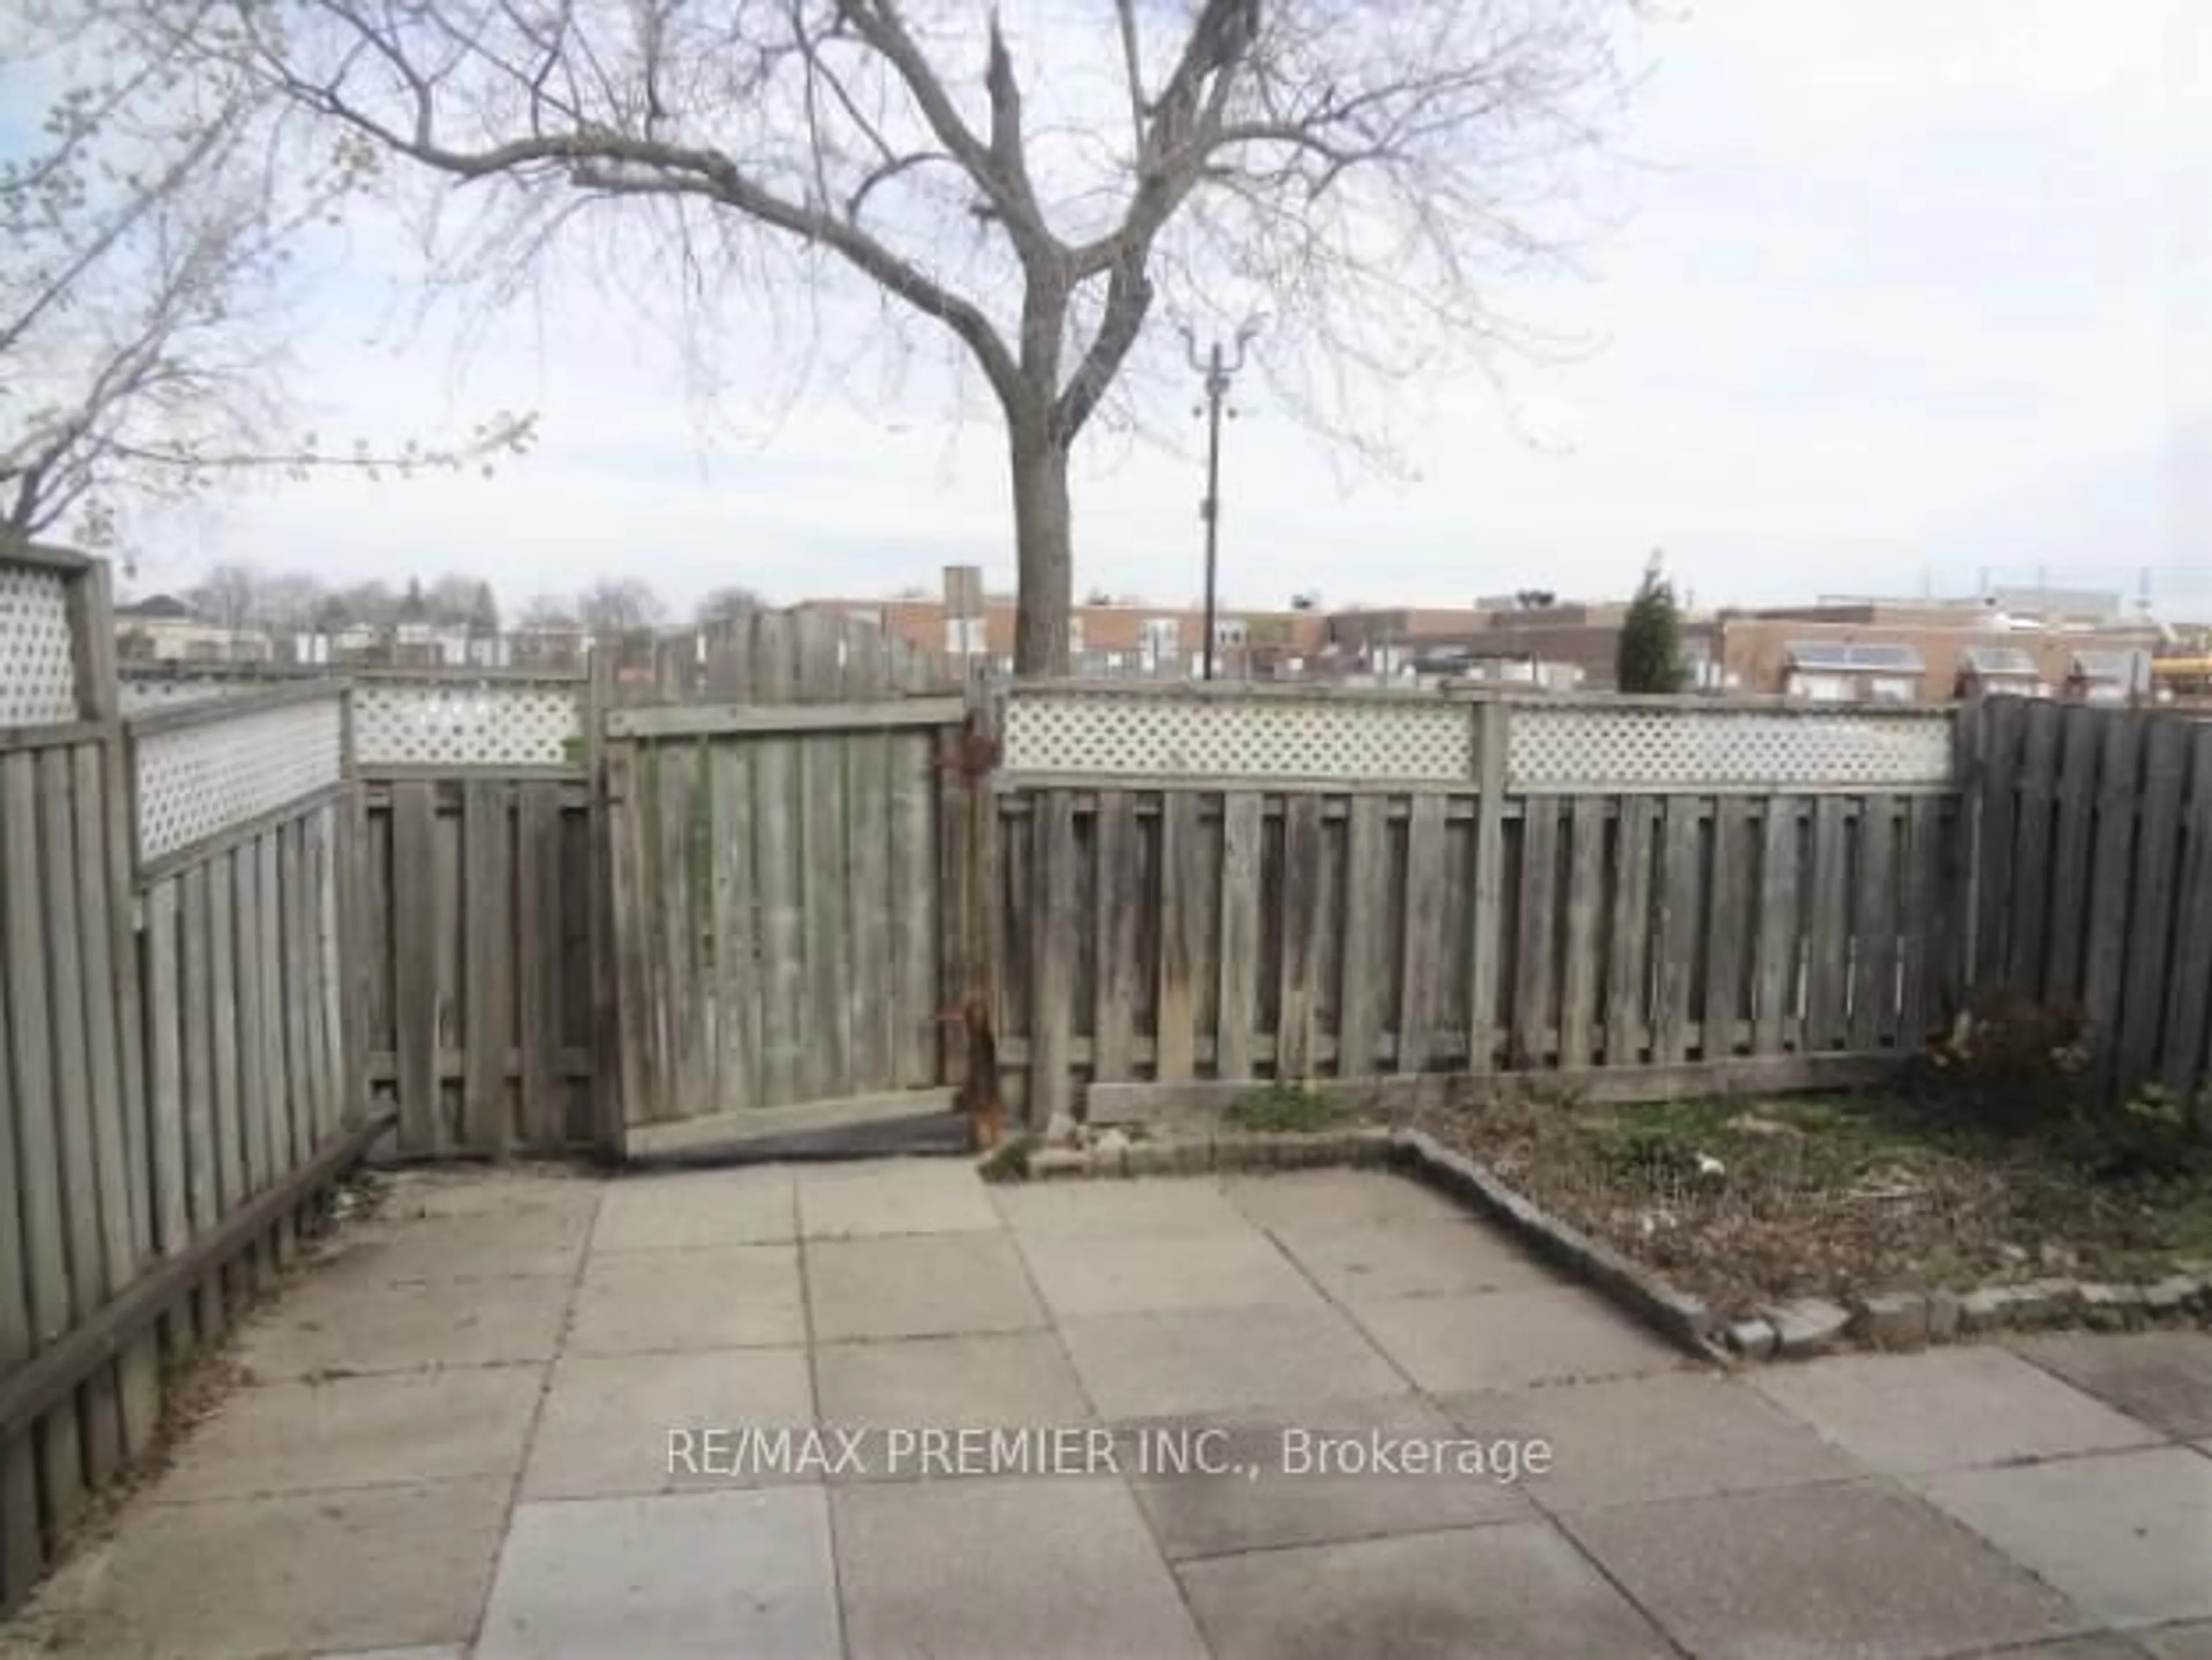
3.81 x 2.45Exterior
Parking
Garage spaces -
Garage type -
Total parking spaces 1
Condo Details
1Story
Inclusions
Hydro
Water
Parking
Cable
Heat
Property History
Apr 26, 2026
ListedActive
$569,900
94 days on market 22Listing by trreb®
22Login required
Expired
Login required
Listed
$•••,•••
Stayed --120 days on market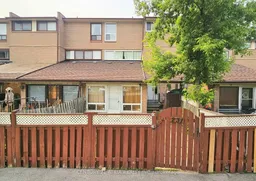 Listing by trreb®
Login required
Expired
Login required
Re-listed - Price change
$•••,•••
Stayed --169 days on market Listing by trreb®
Login required
Terminated
Login required
Listed
$•••,•••
Stayed --115 days on market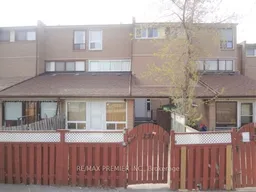 Listing by trreb®
Property listed by RE/MAX PREMIER INC., Brokerage

Interested in this property?Get in touch to get the inside scoop.