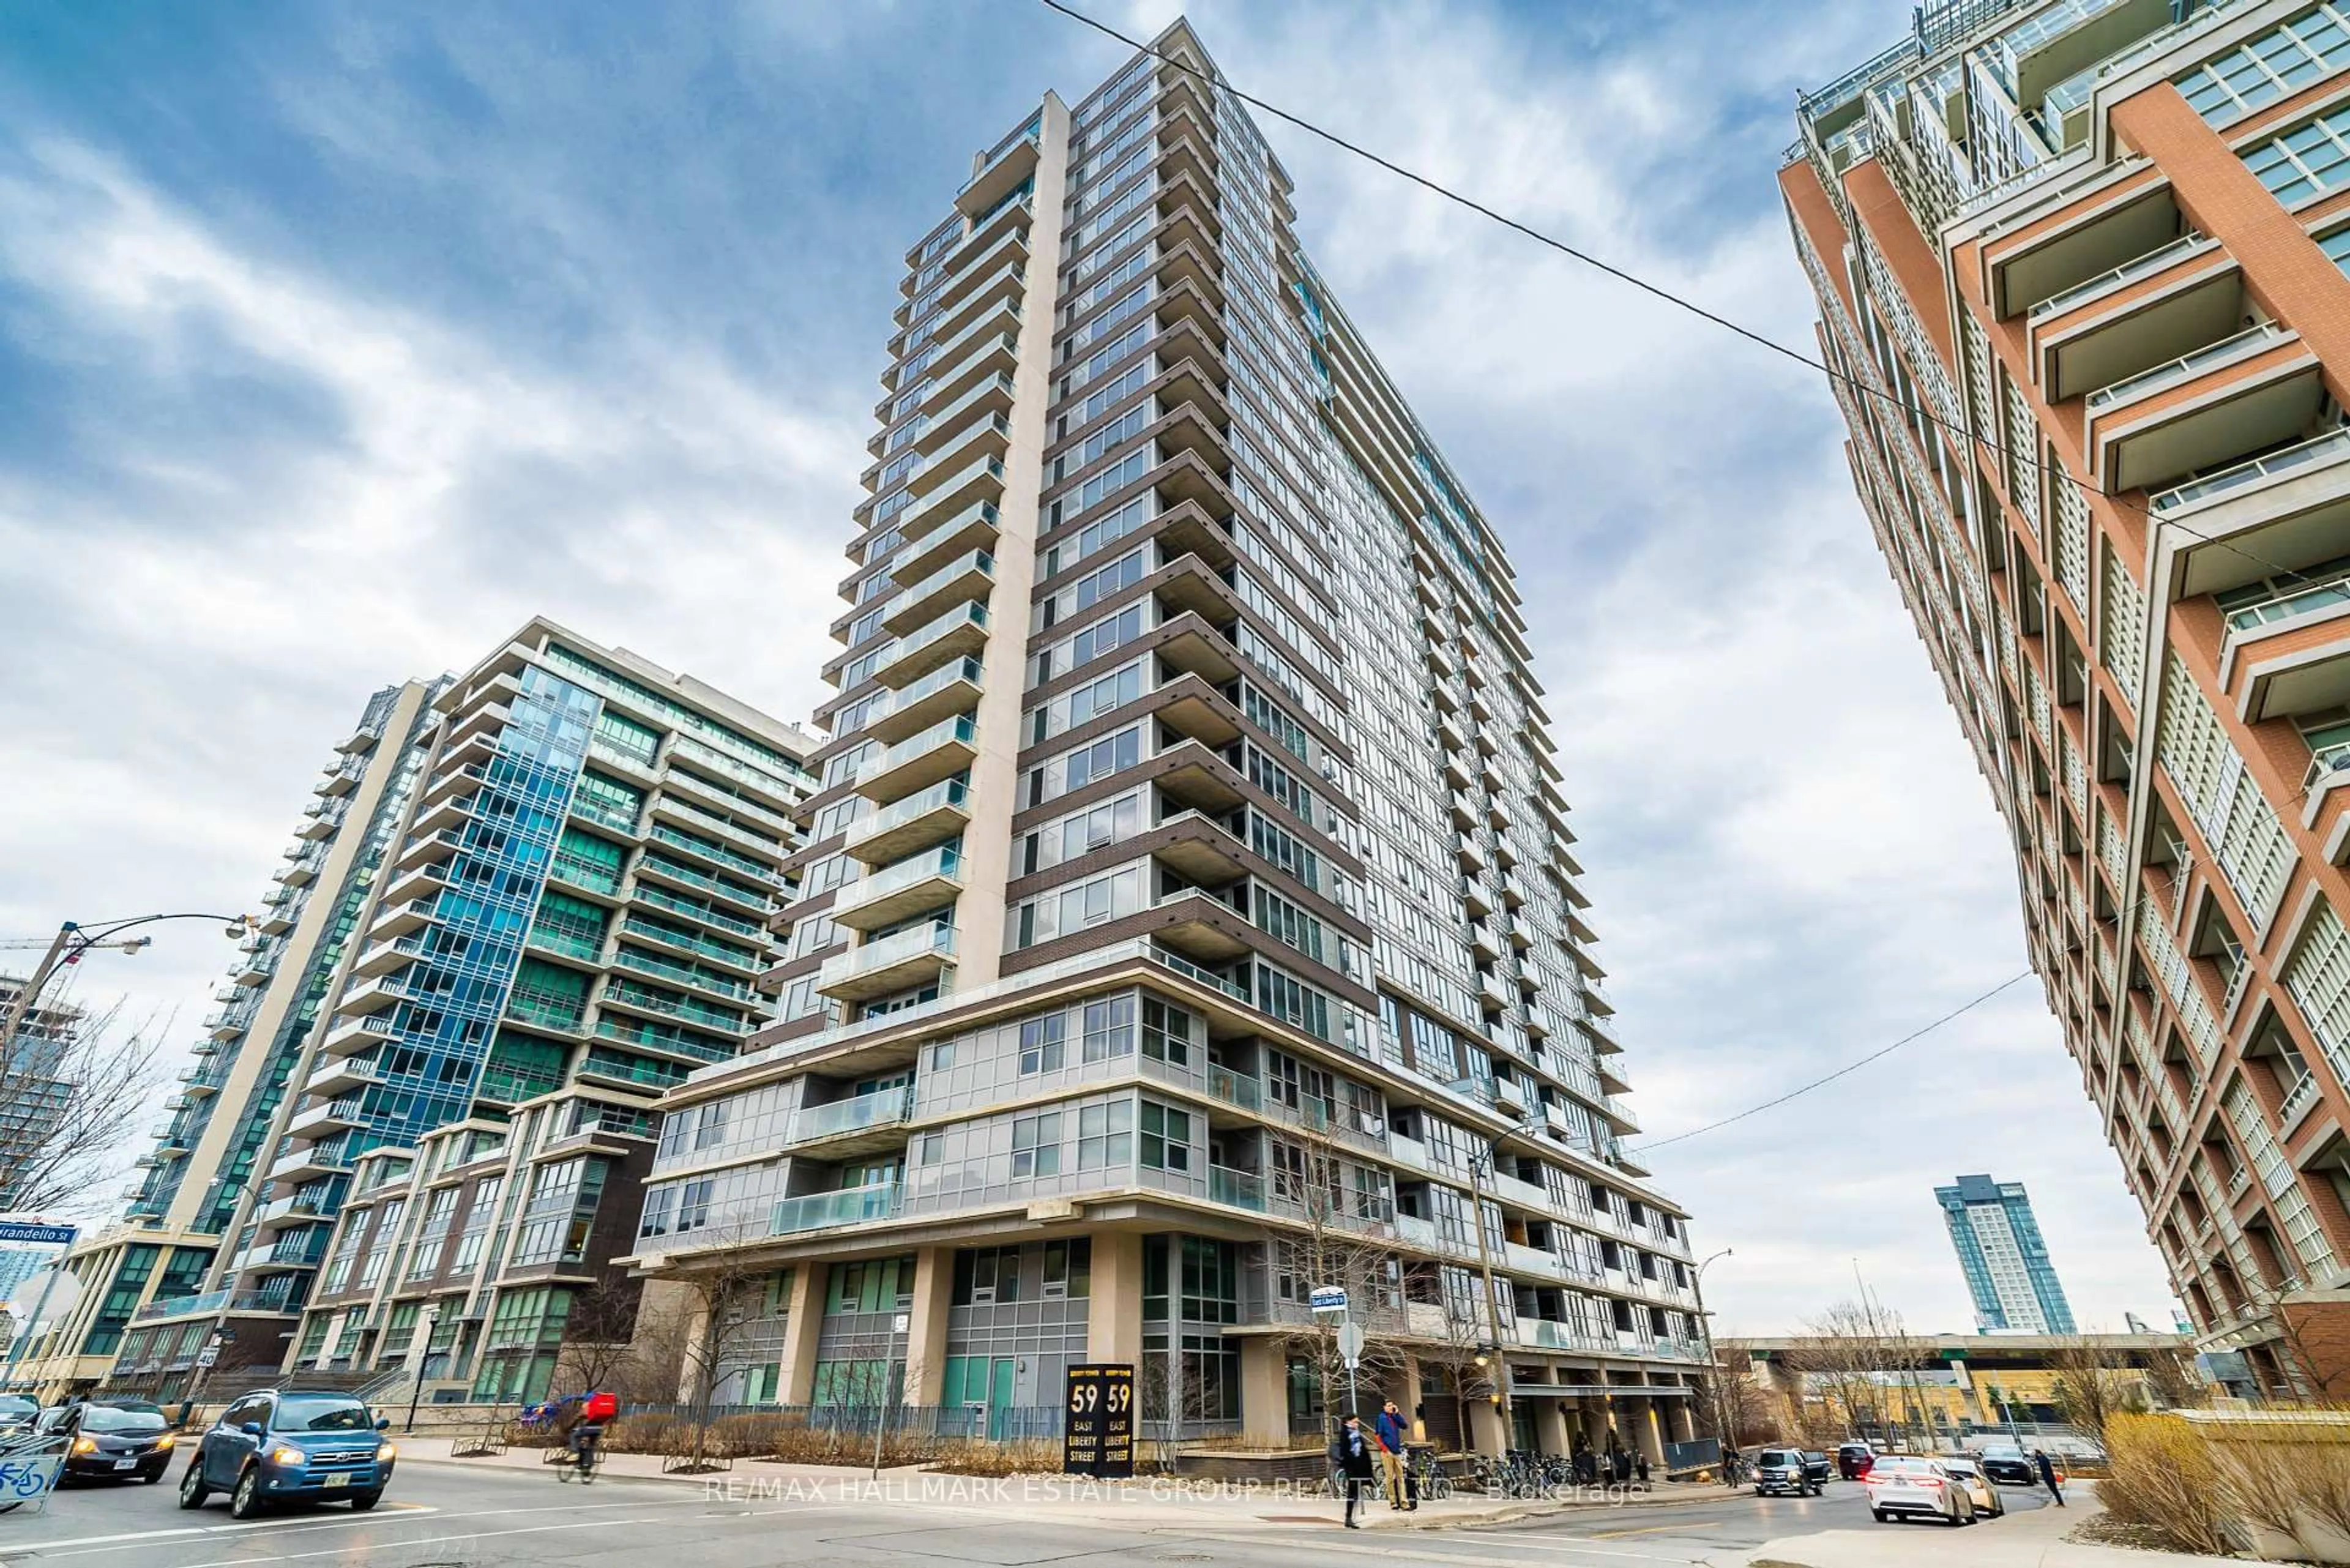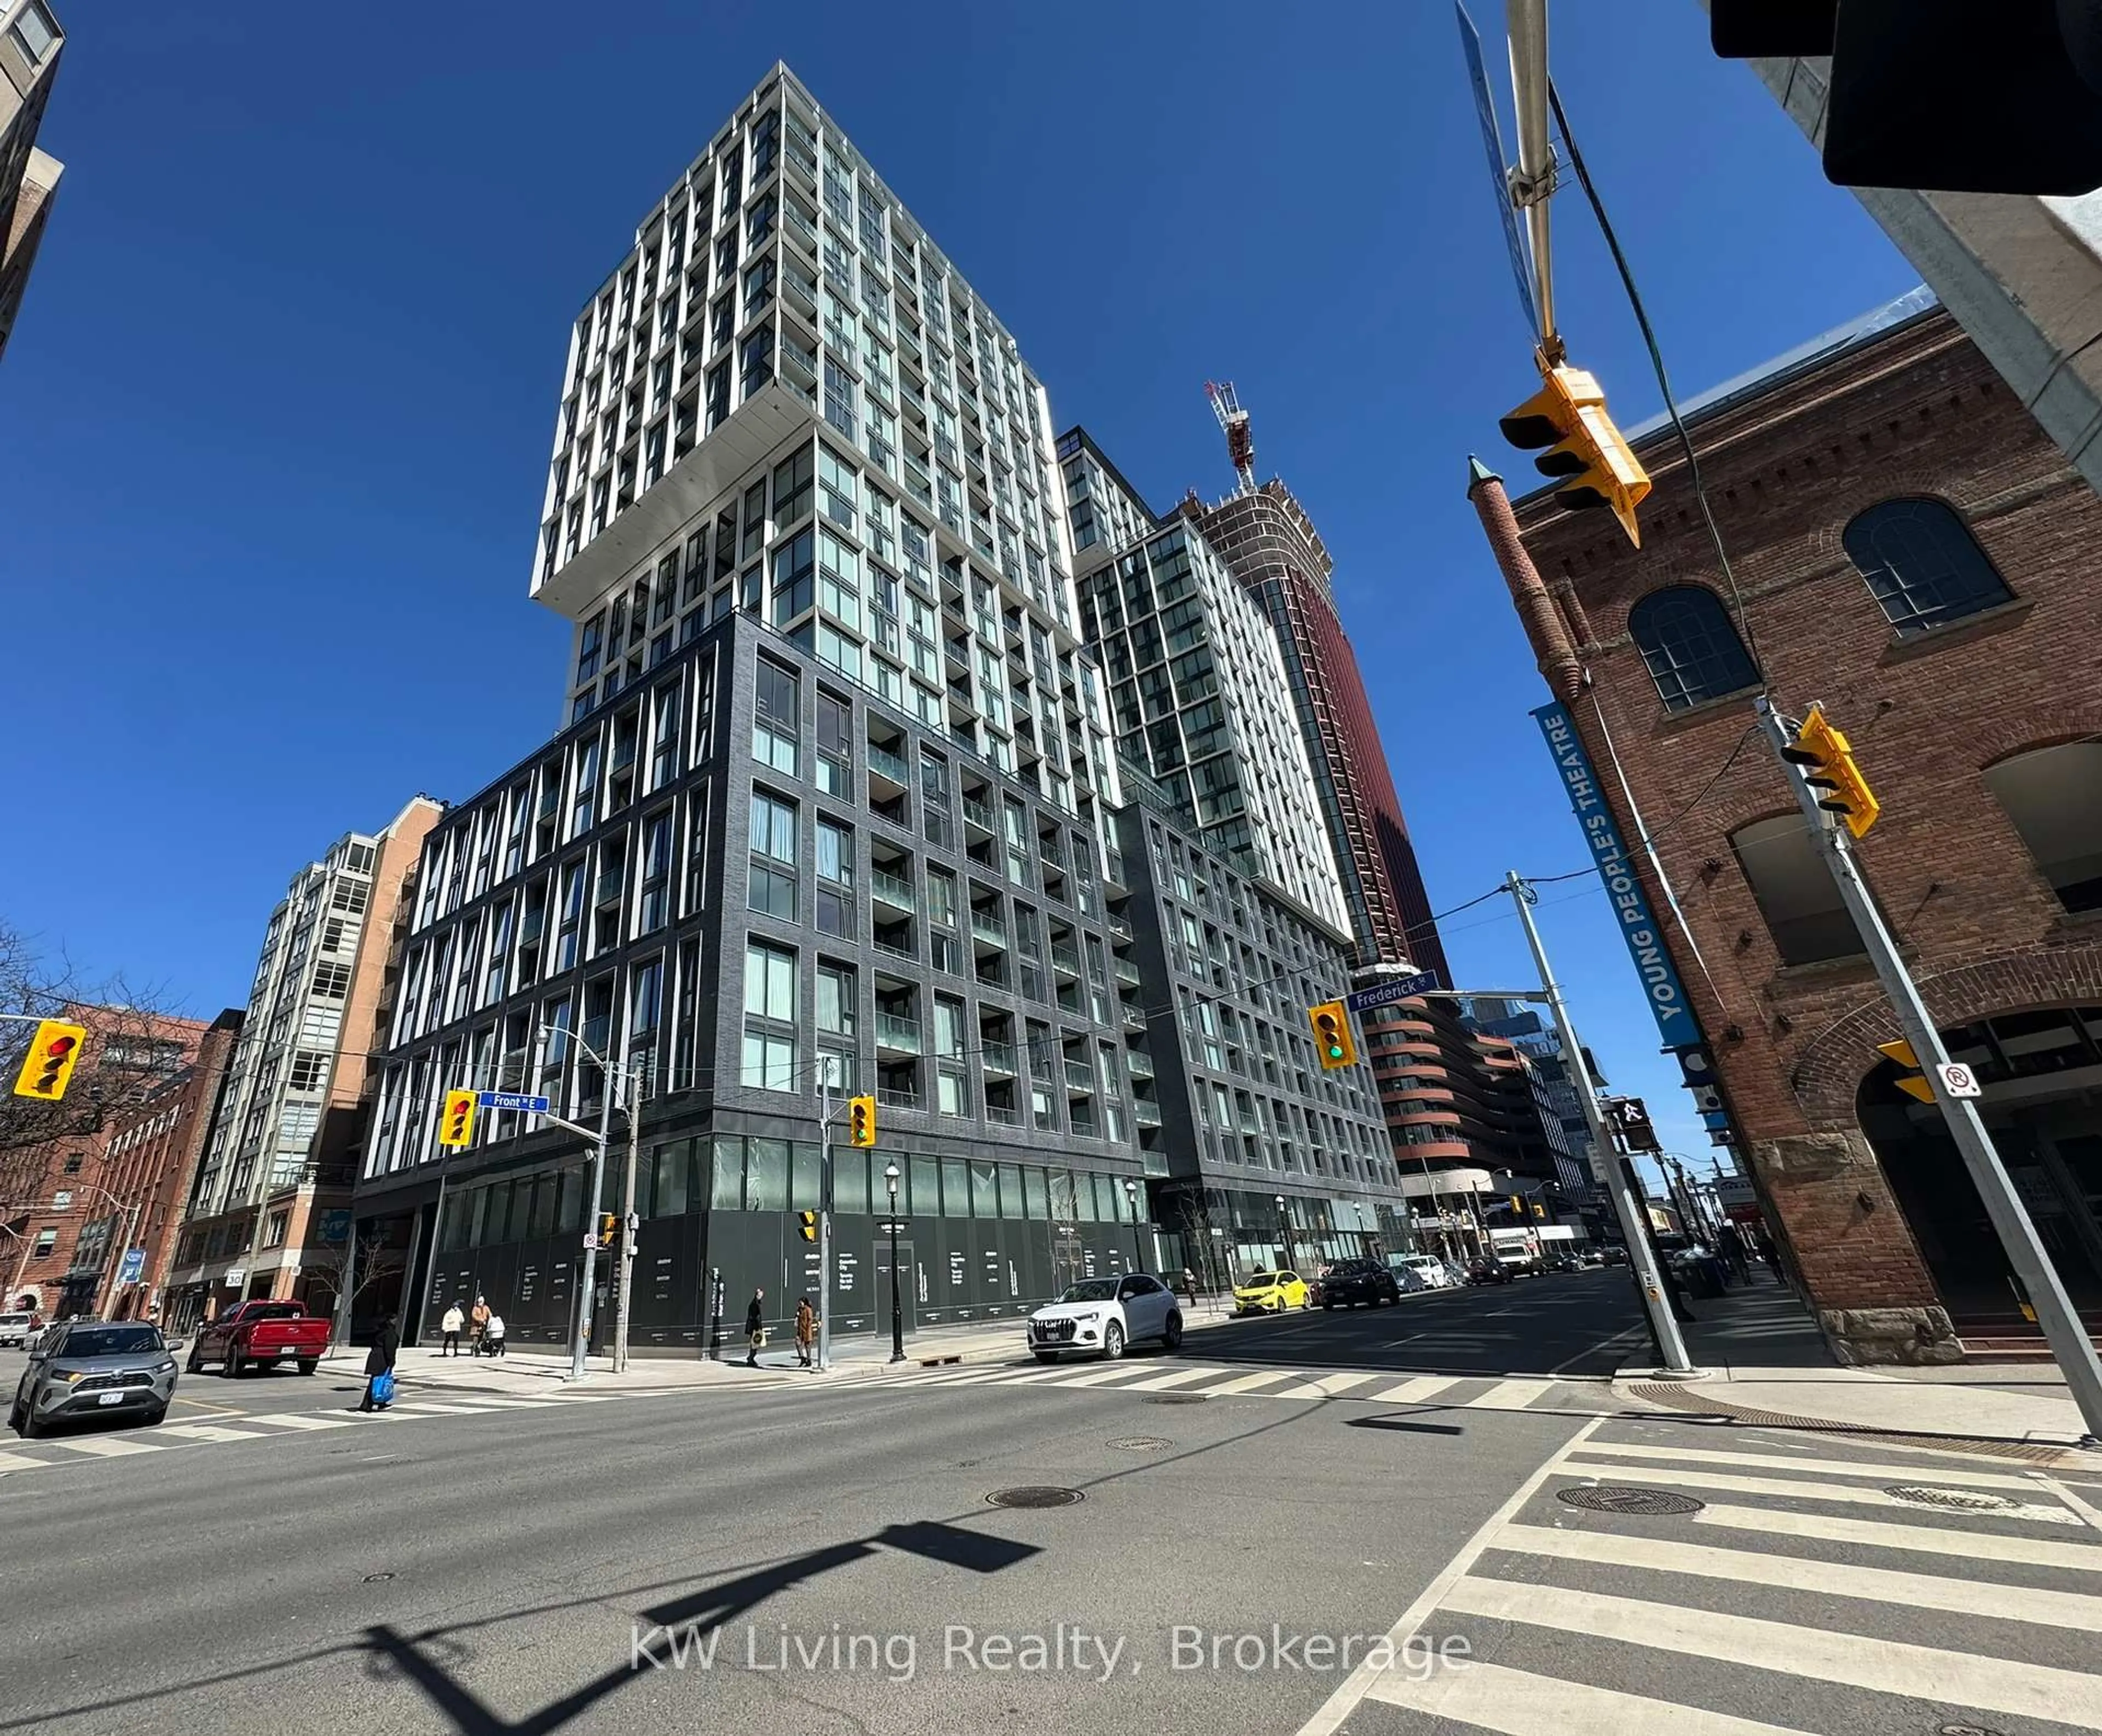
115 Blue Jays Way #705, Toronto, Ontario M5V 0N4
Contact us about this property
Highlights
Estimated valueThis is the price Wahi expects this property to sell for.
The calculation is powered by our Instant Home Value Estimate, which uses current market and property price trends to estimate your home’s value with a 90% accuracy rate.Not available
Price/Sqft$401/sqft
Monthly cost
Open Calculator
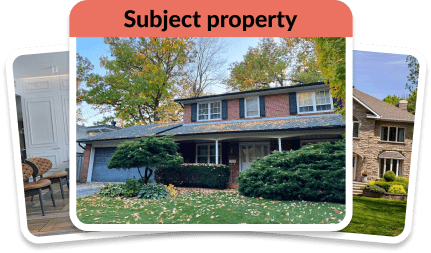
Curious about what homes are selling for in this area?
Get a report on comparable homes with helpful insights and trends.
+63
Properties sold*
$690K
Median sold price*
*Based on last 30 days
Description
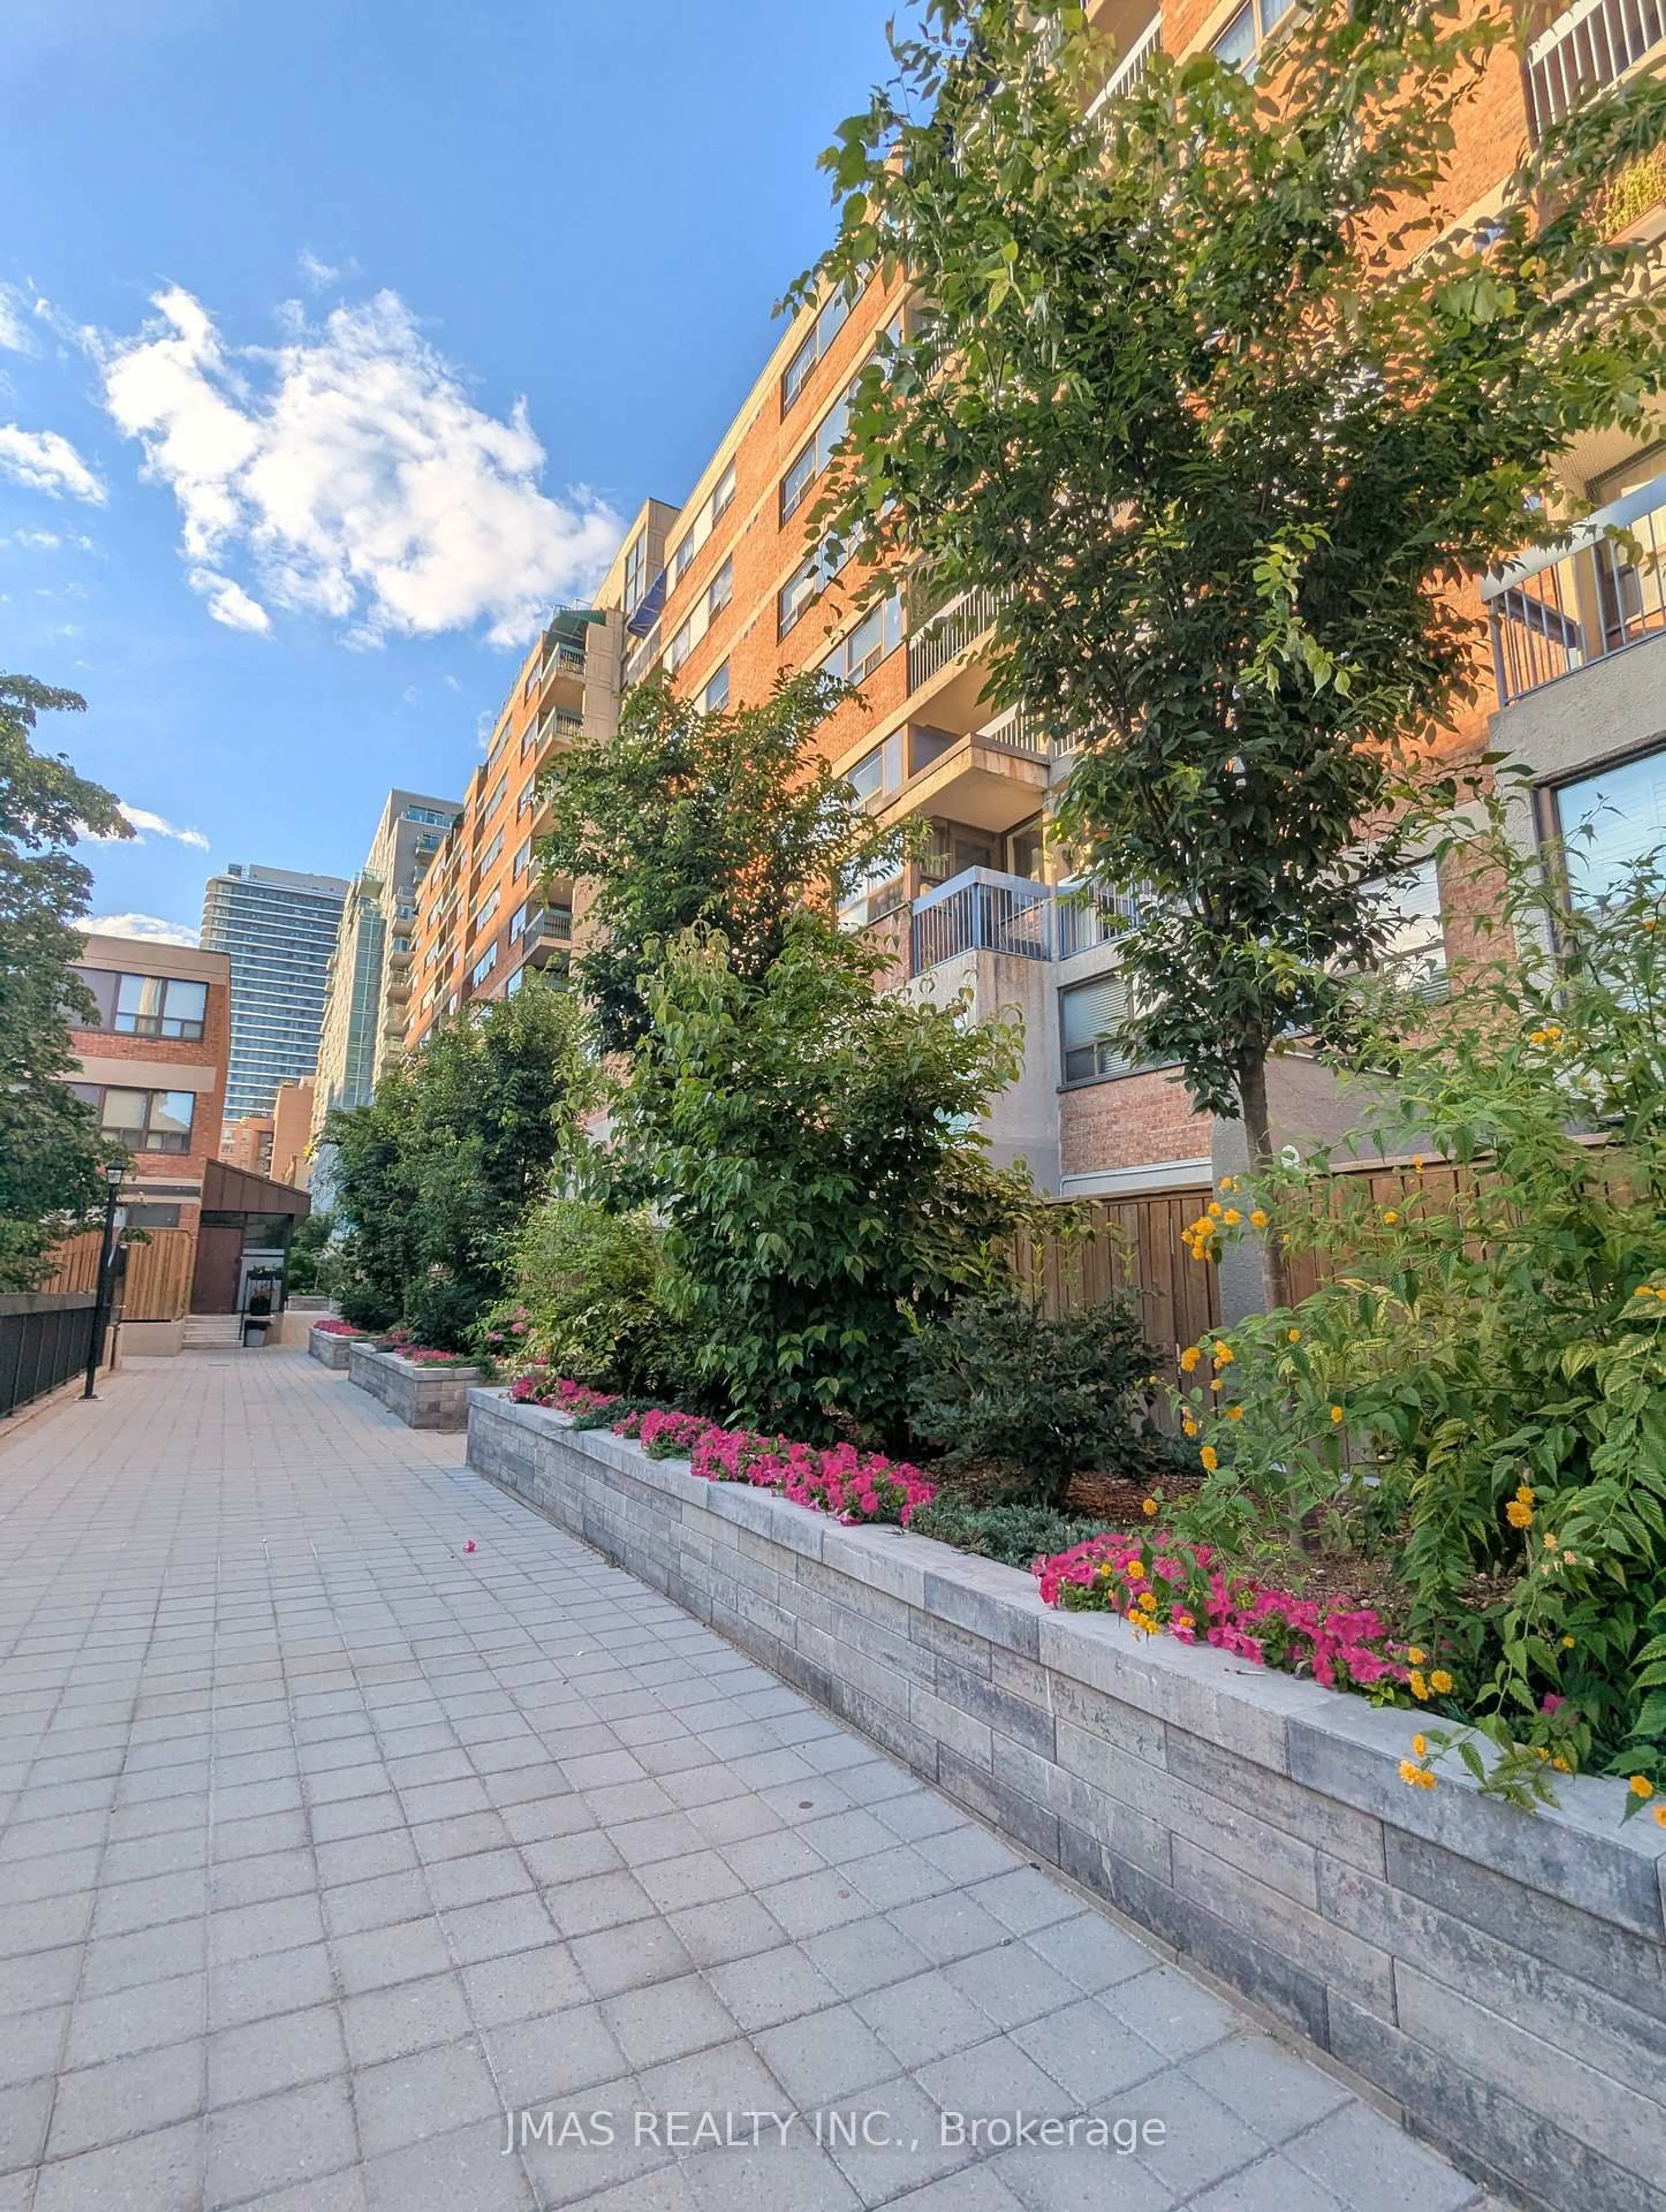
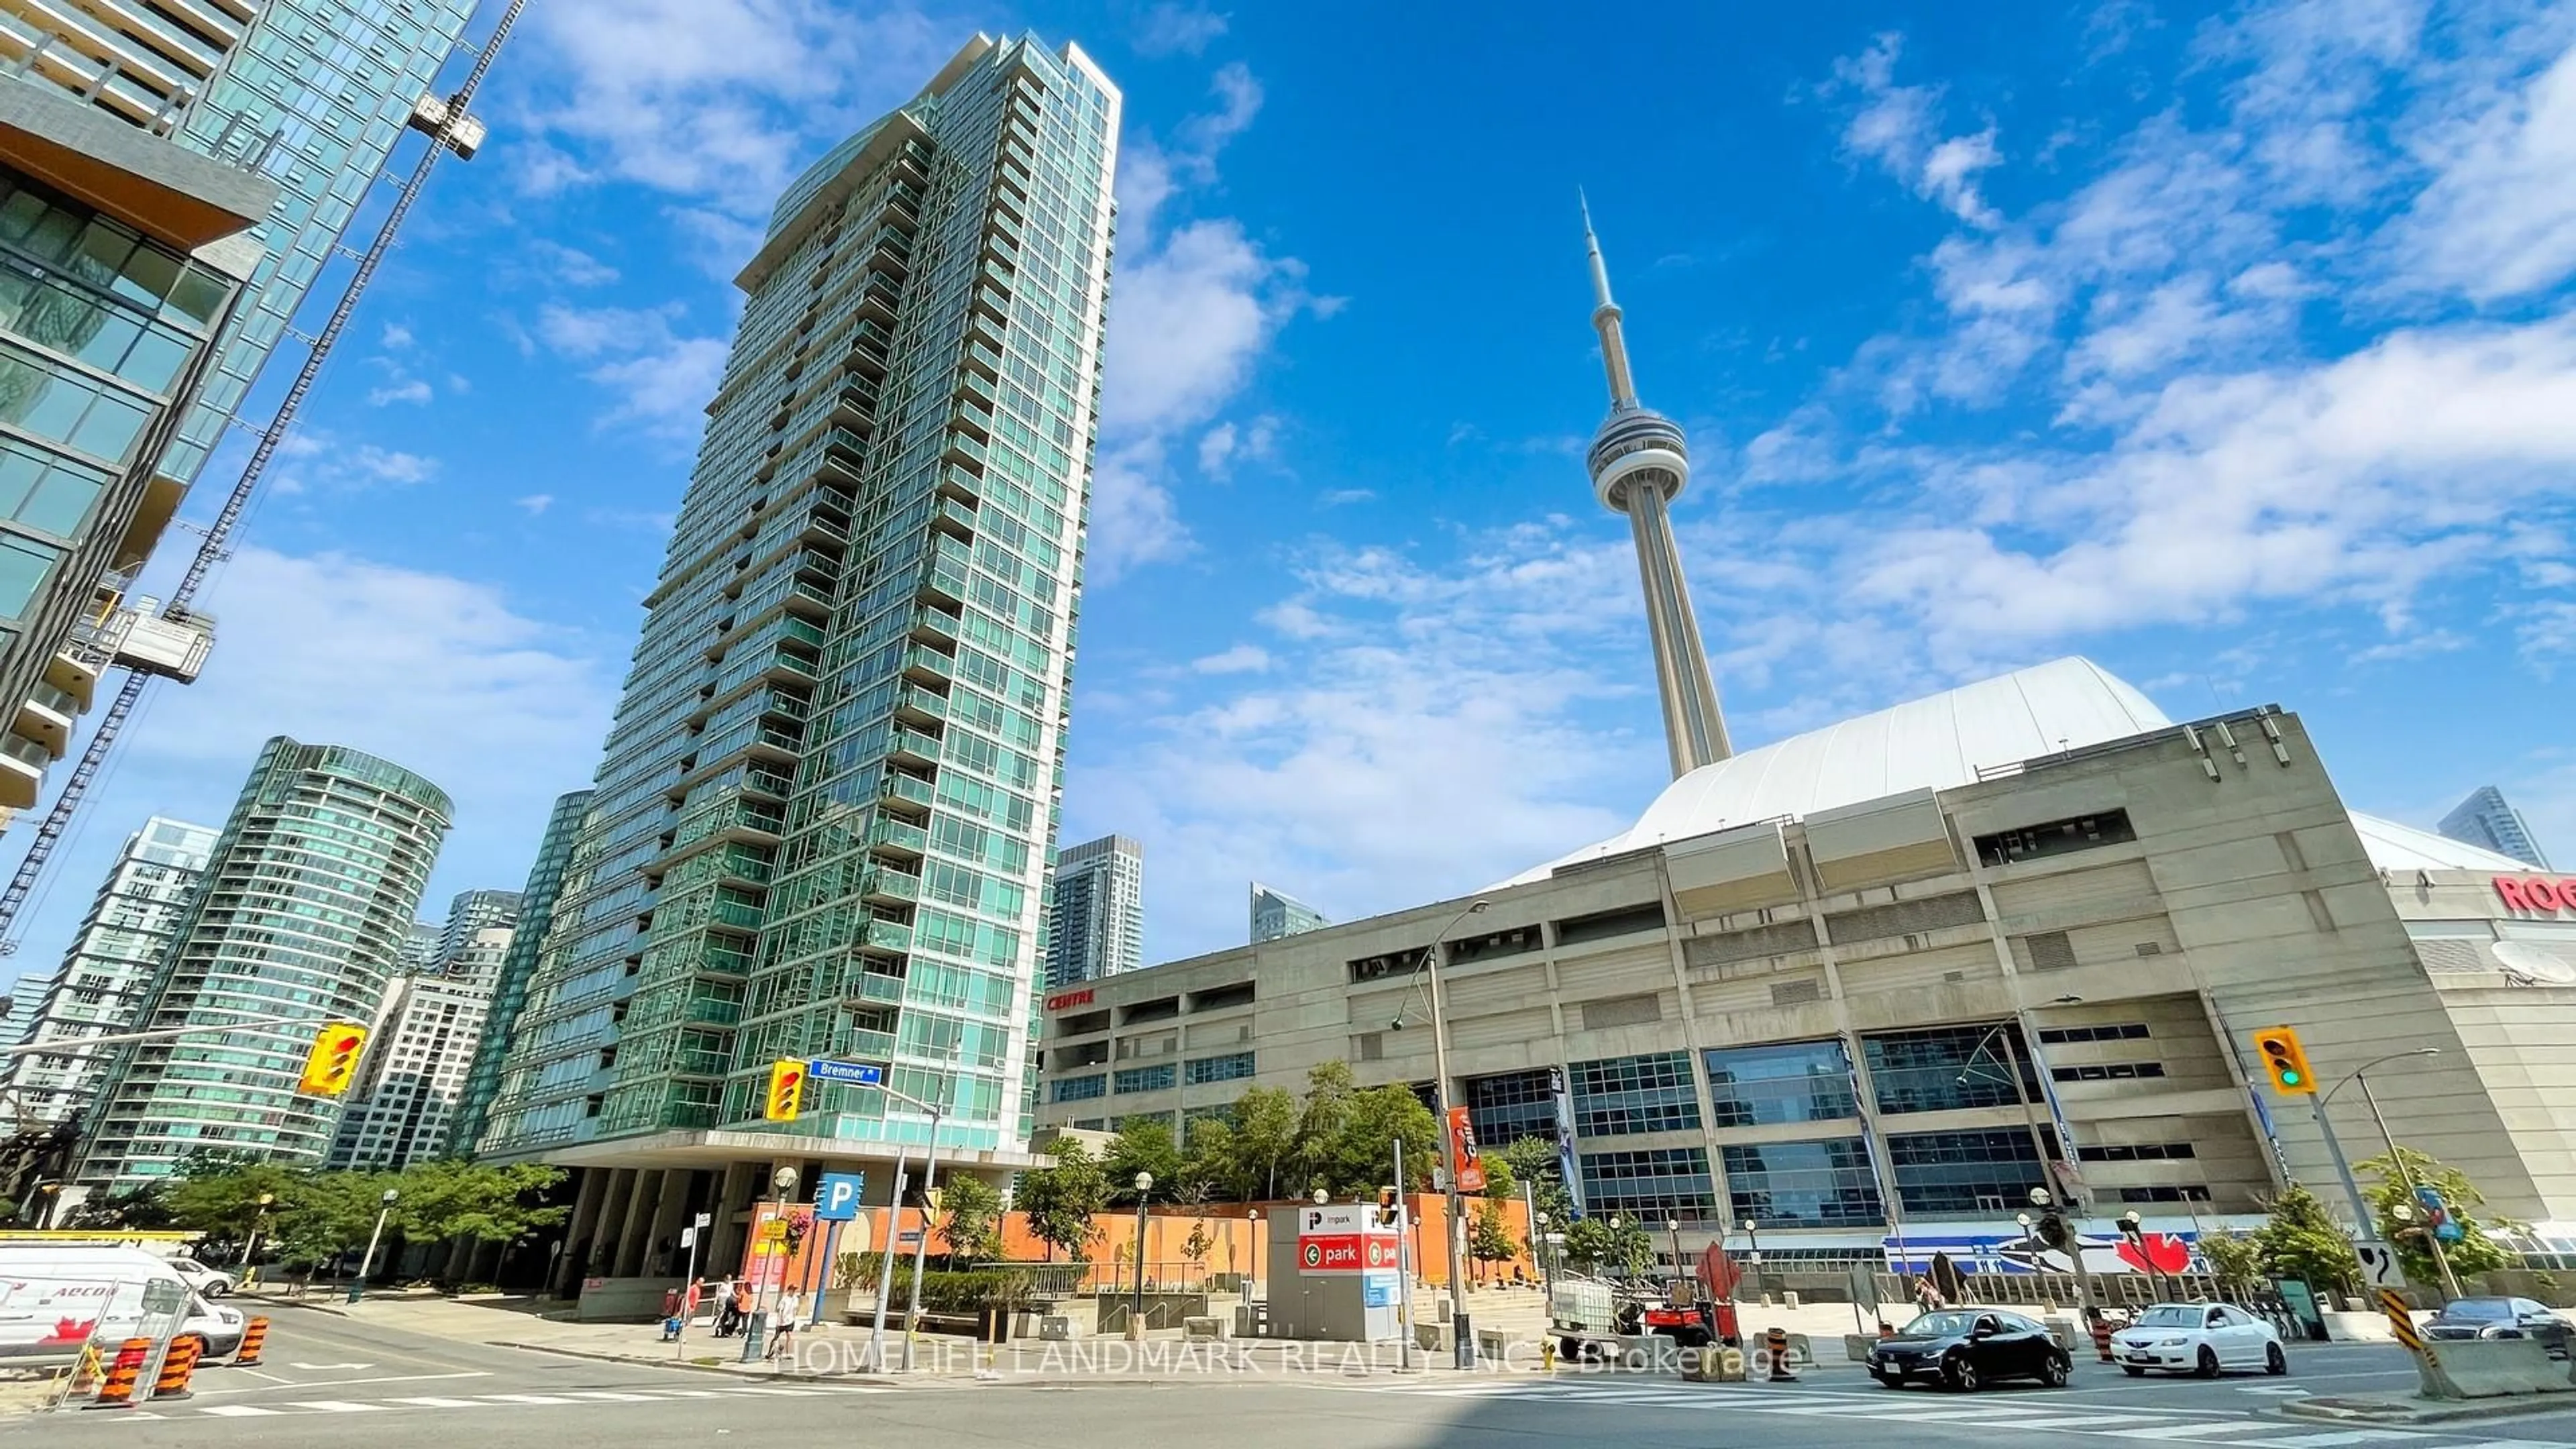
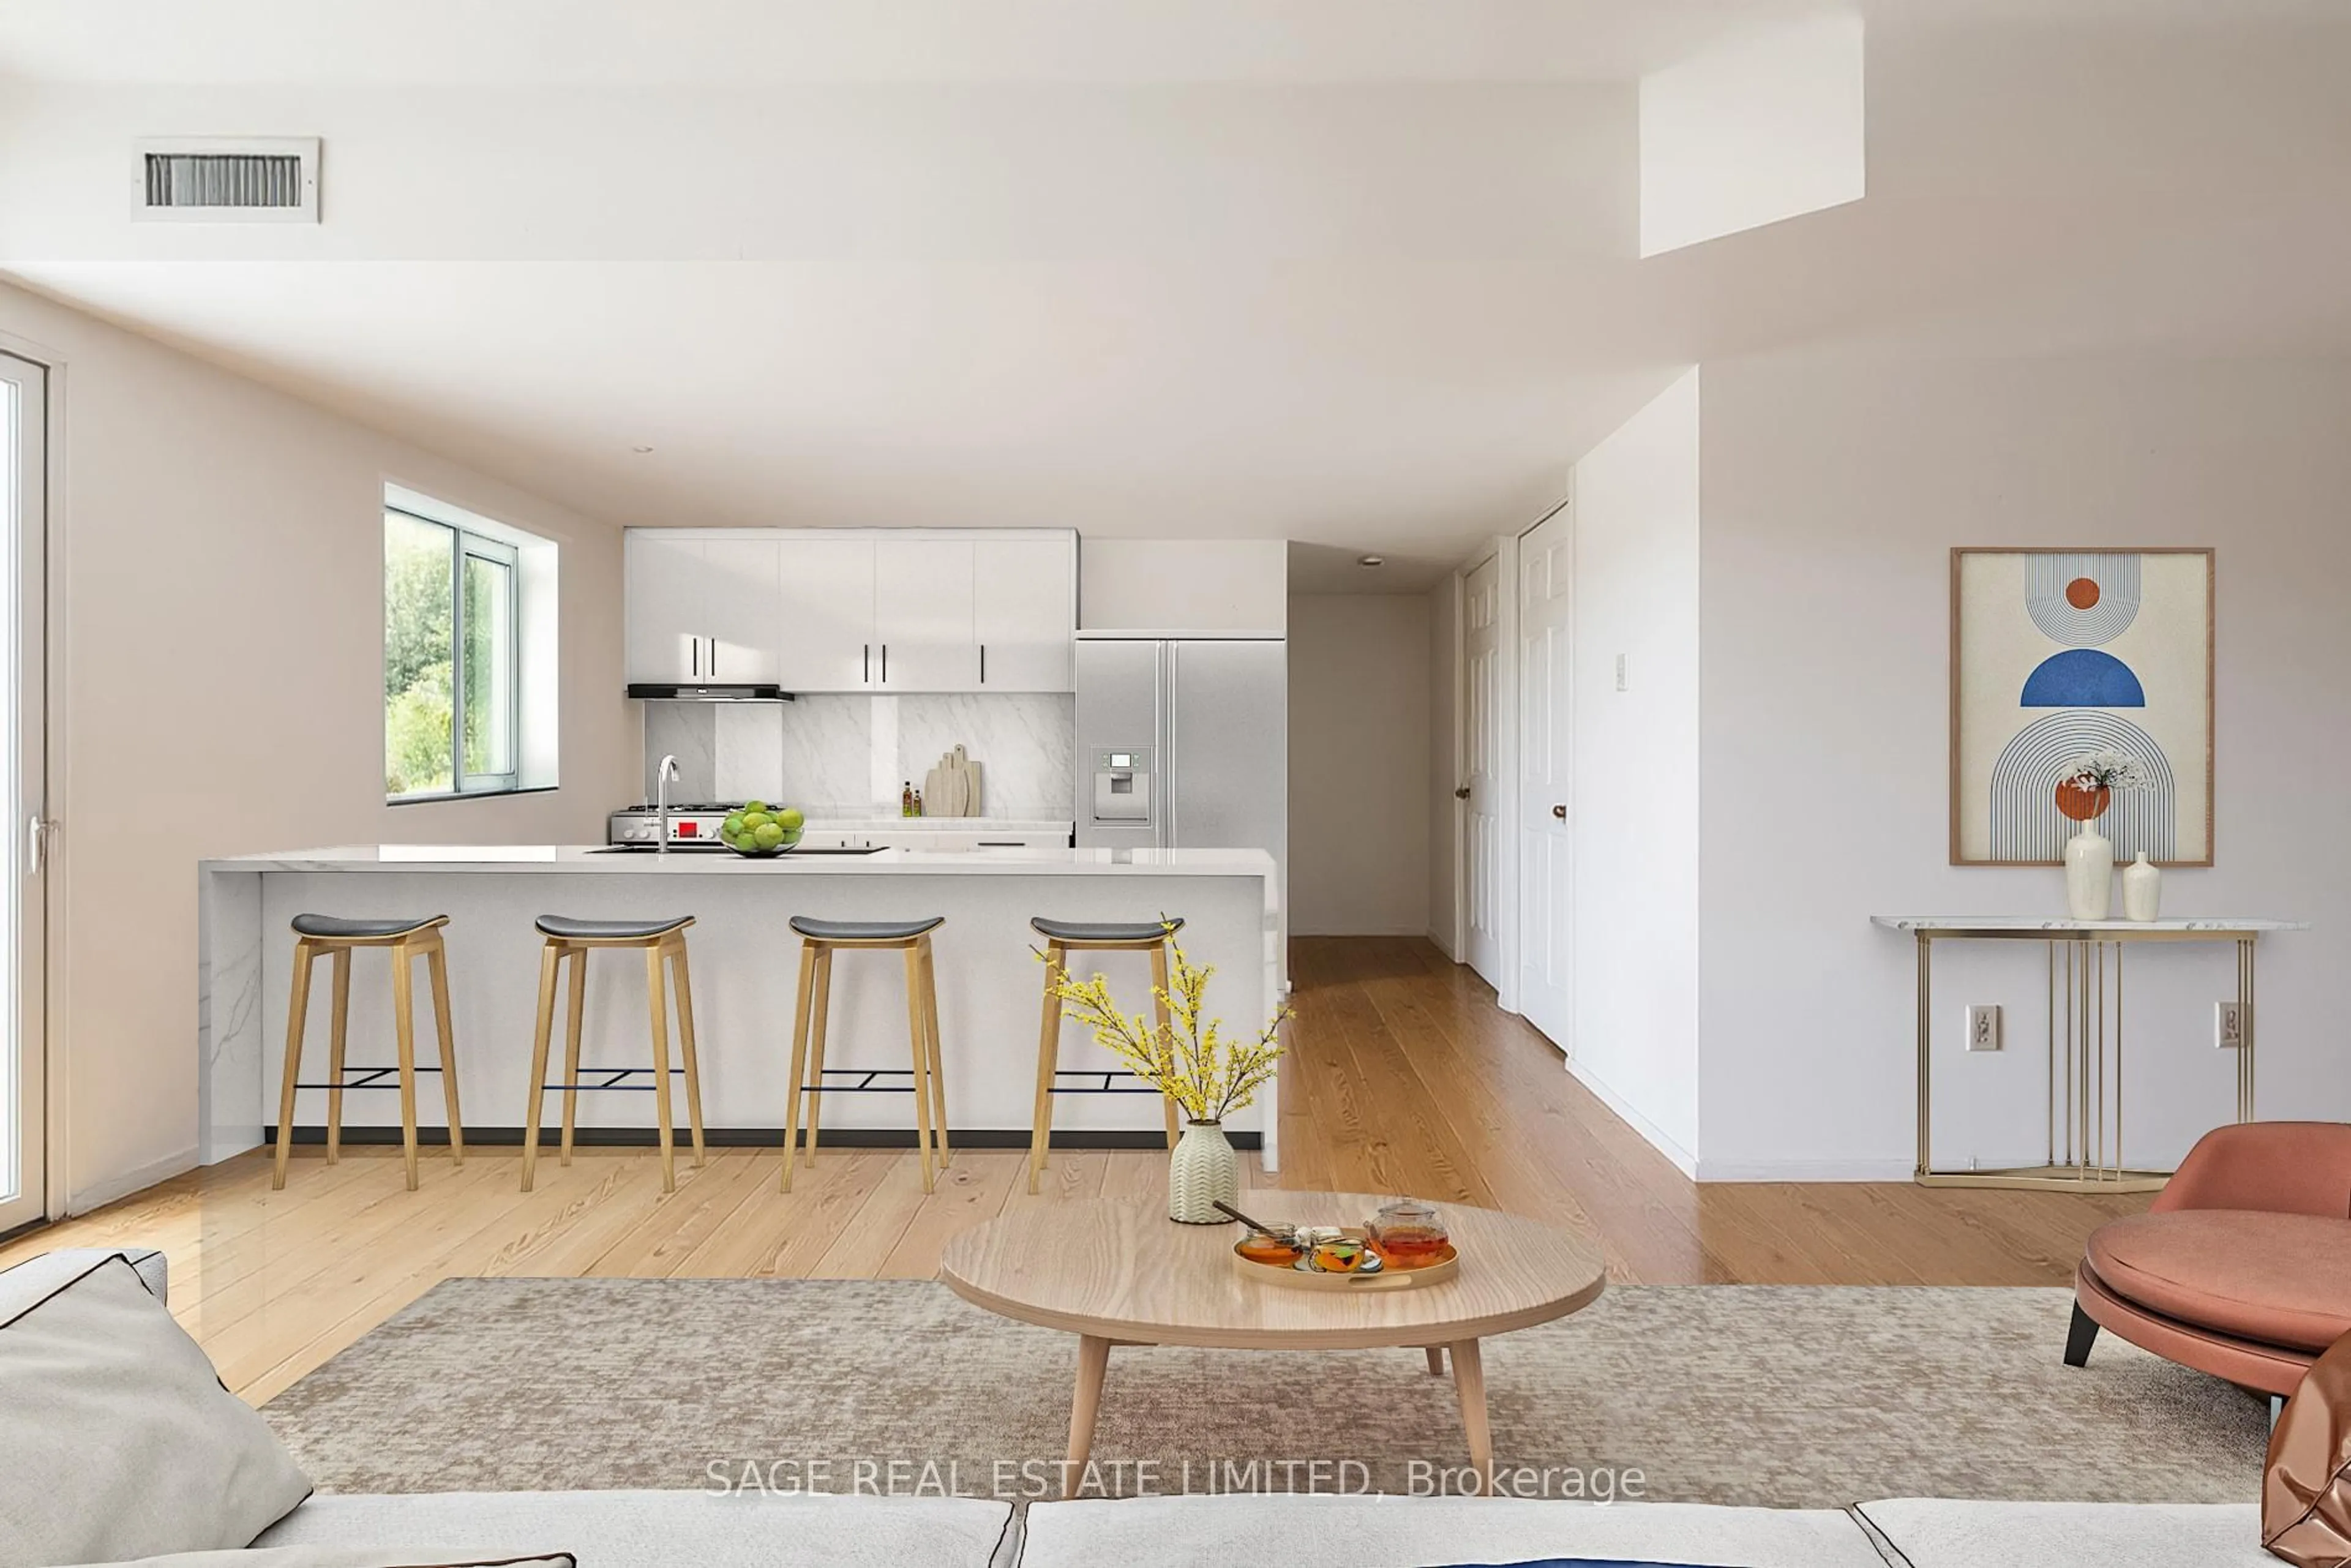
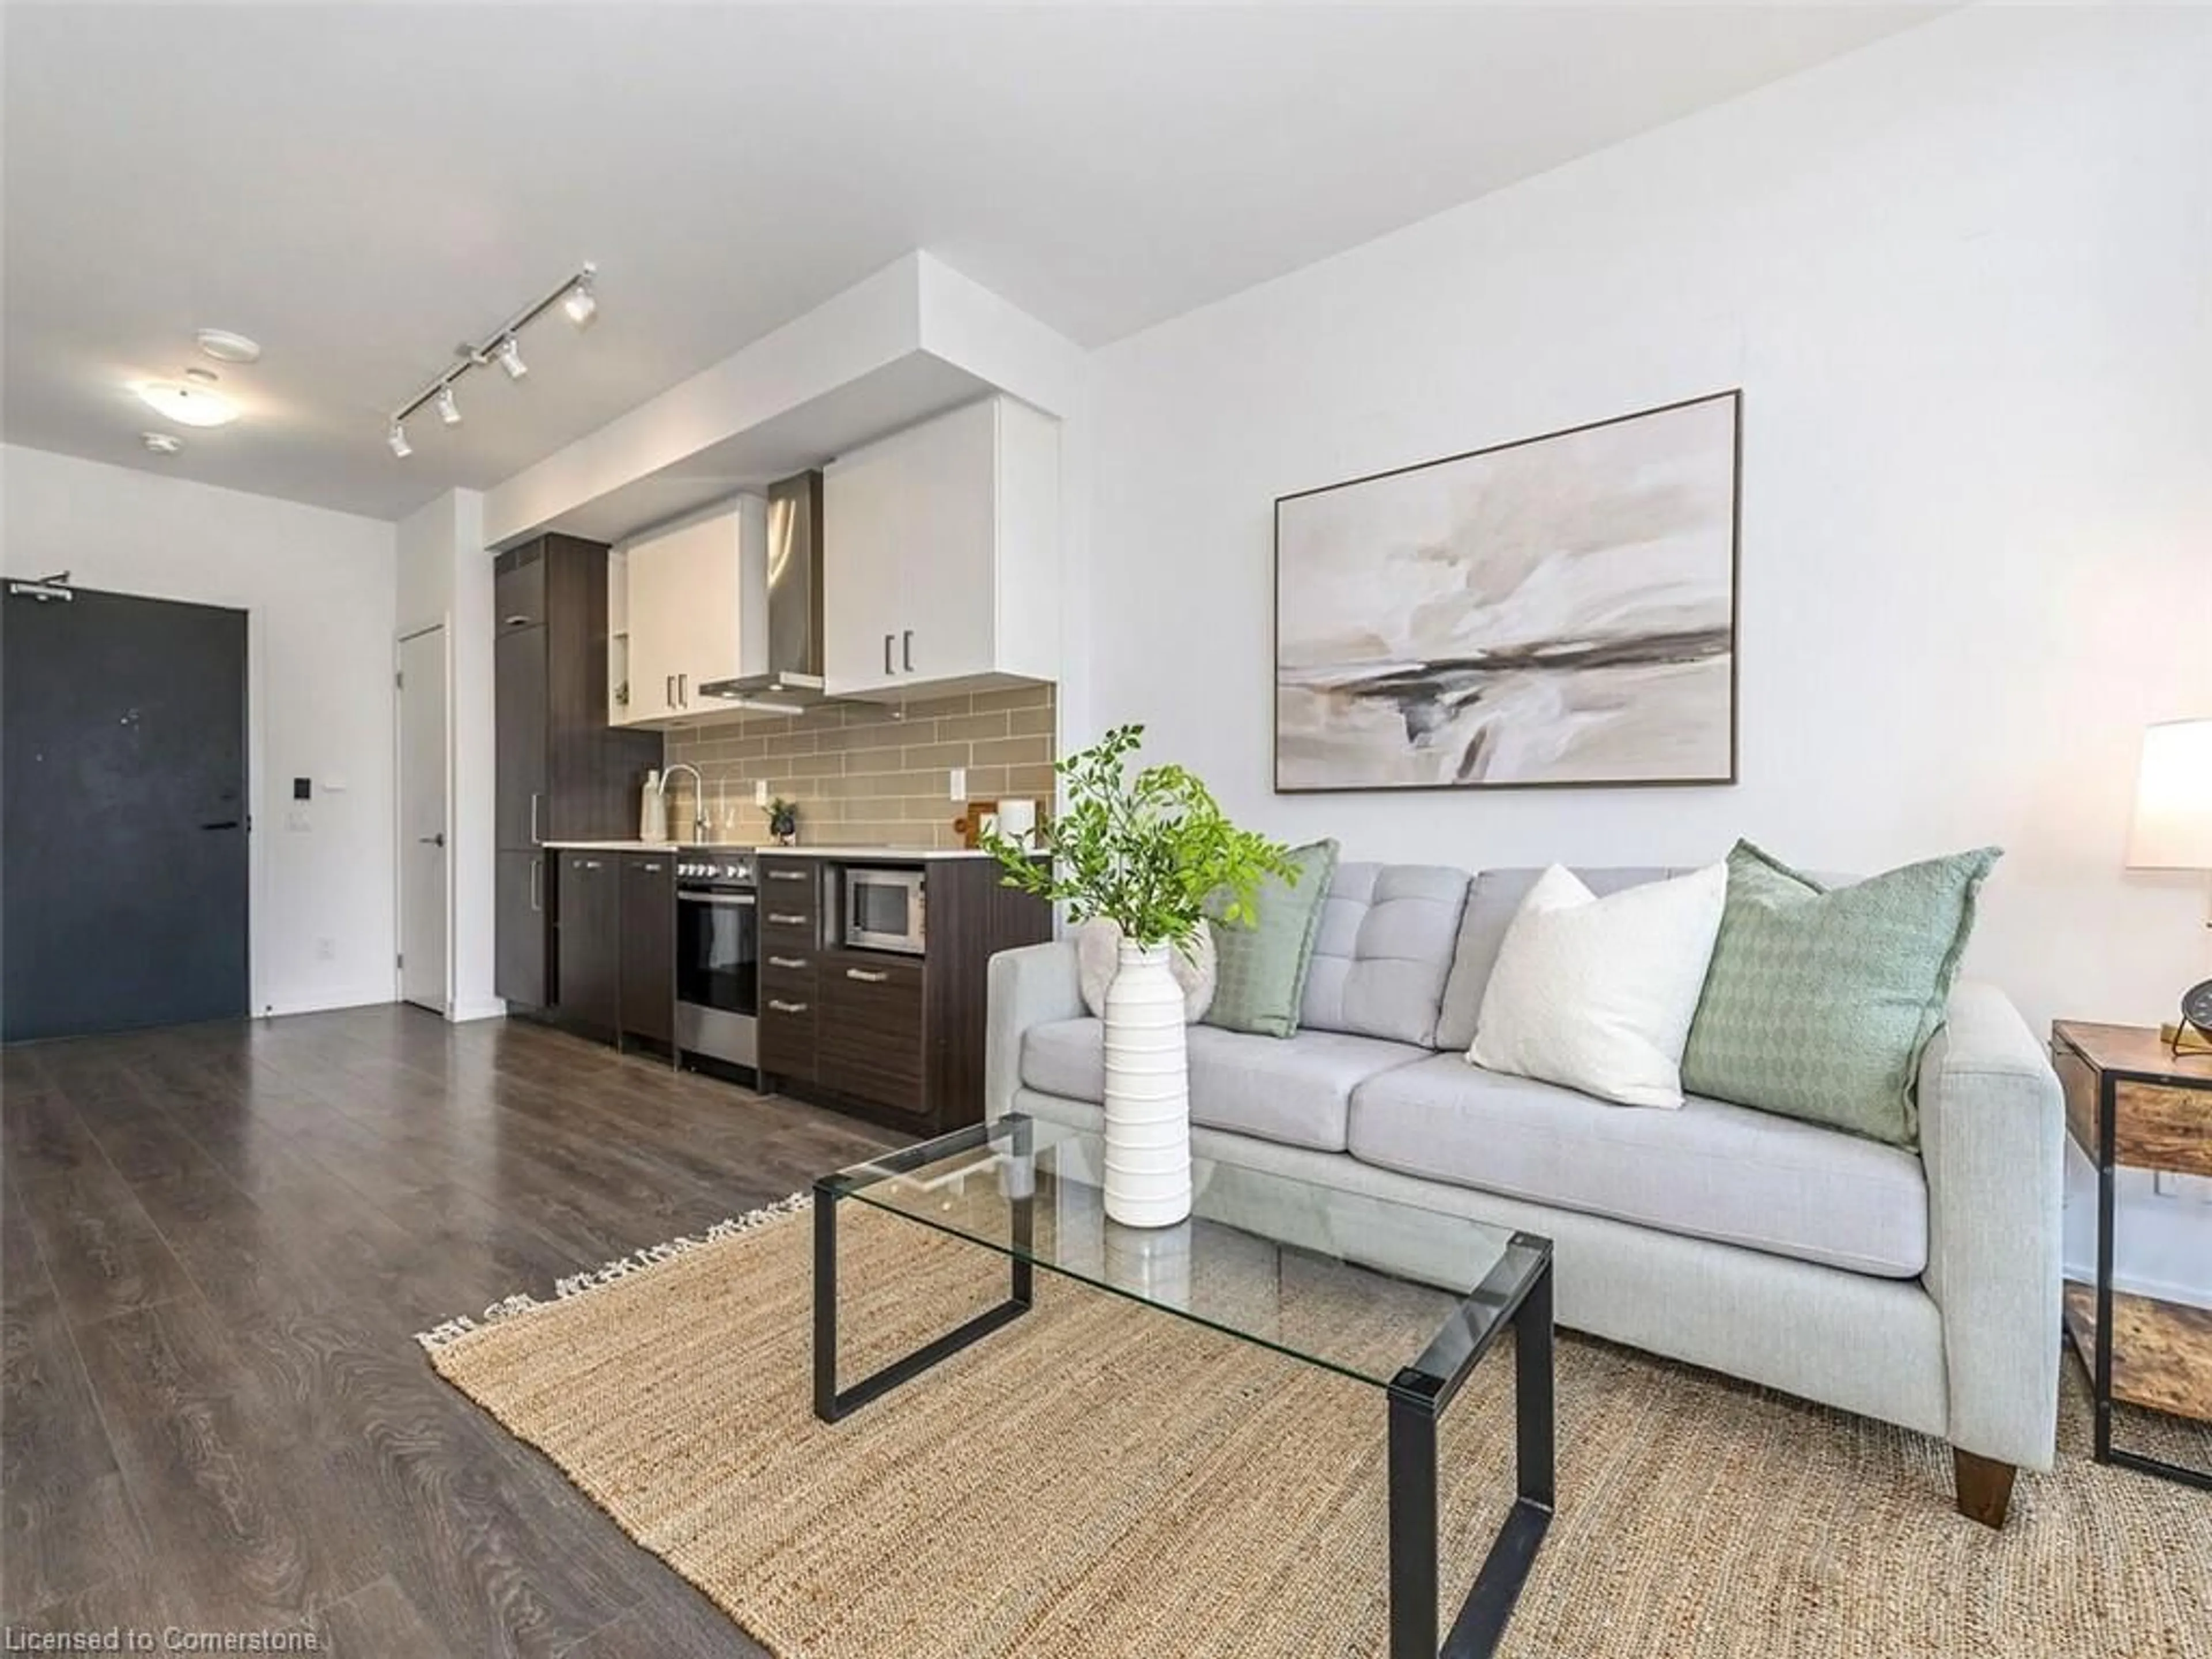
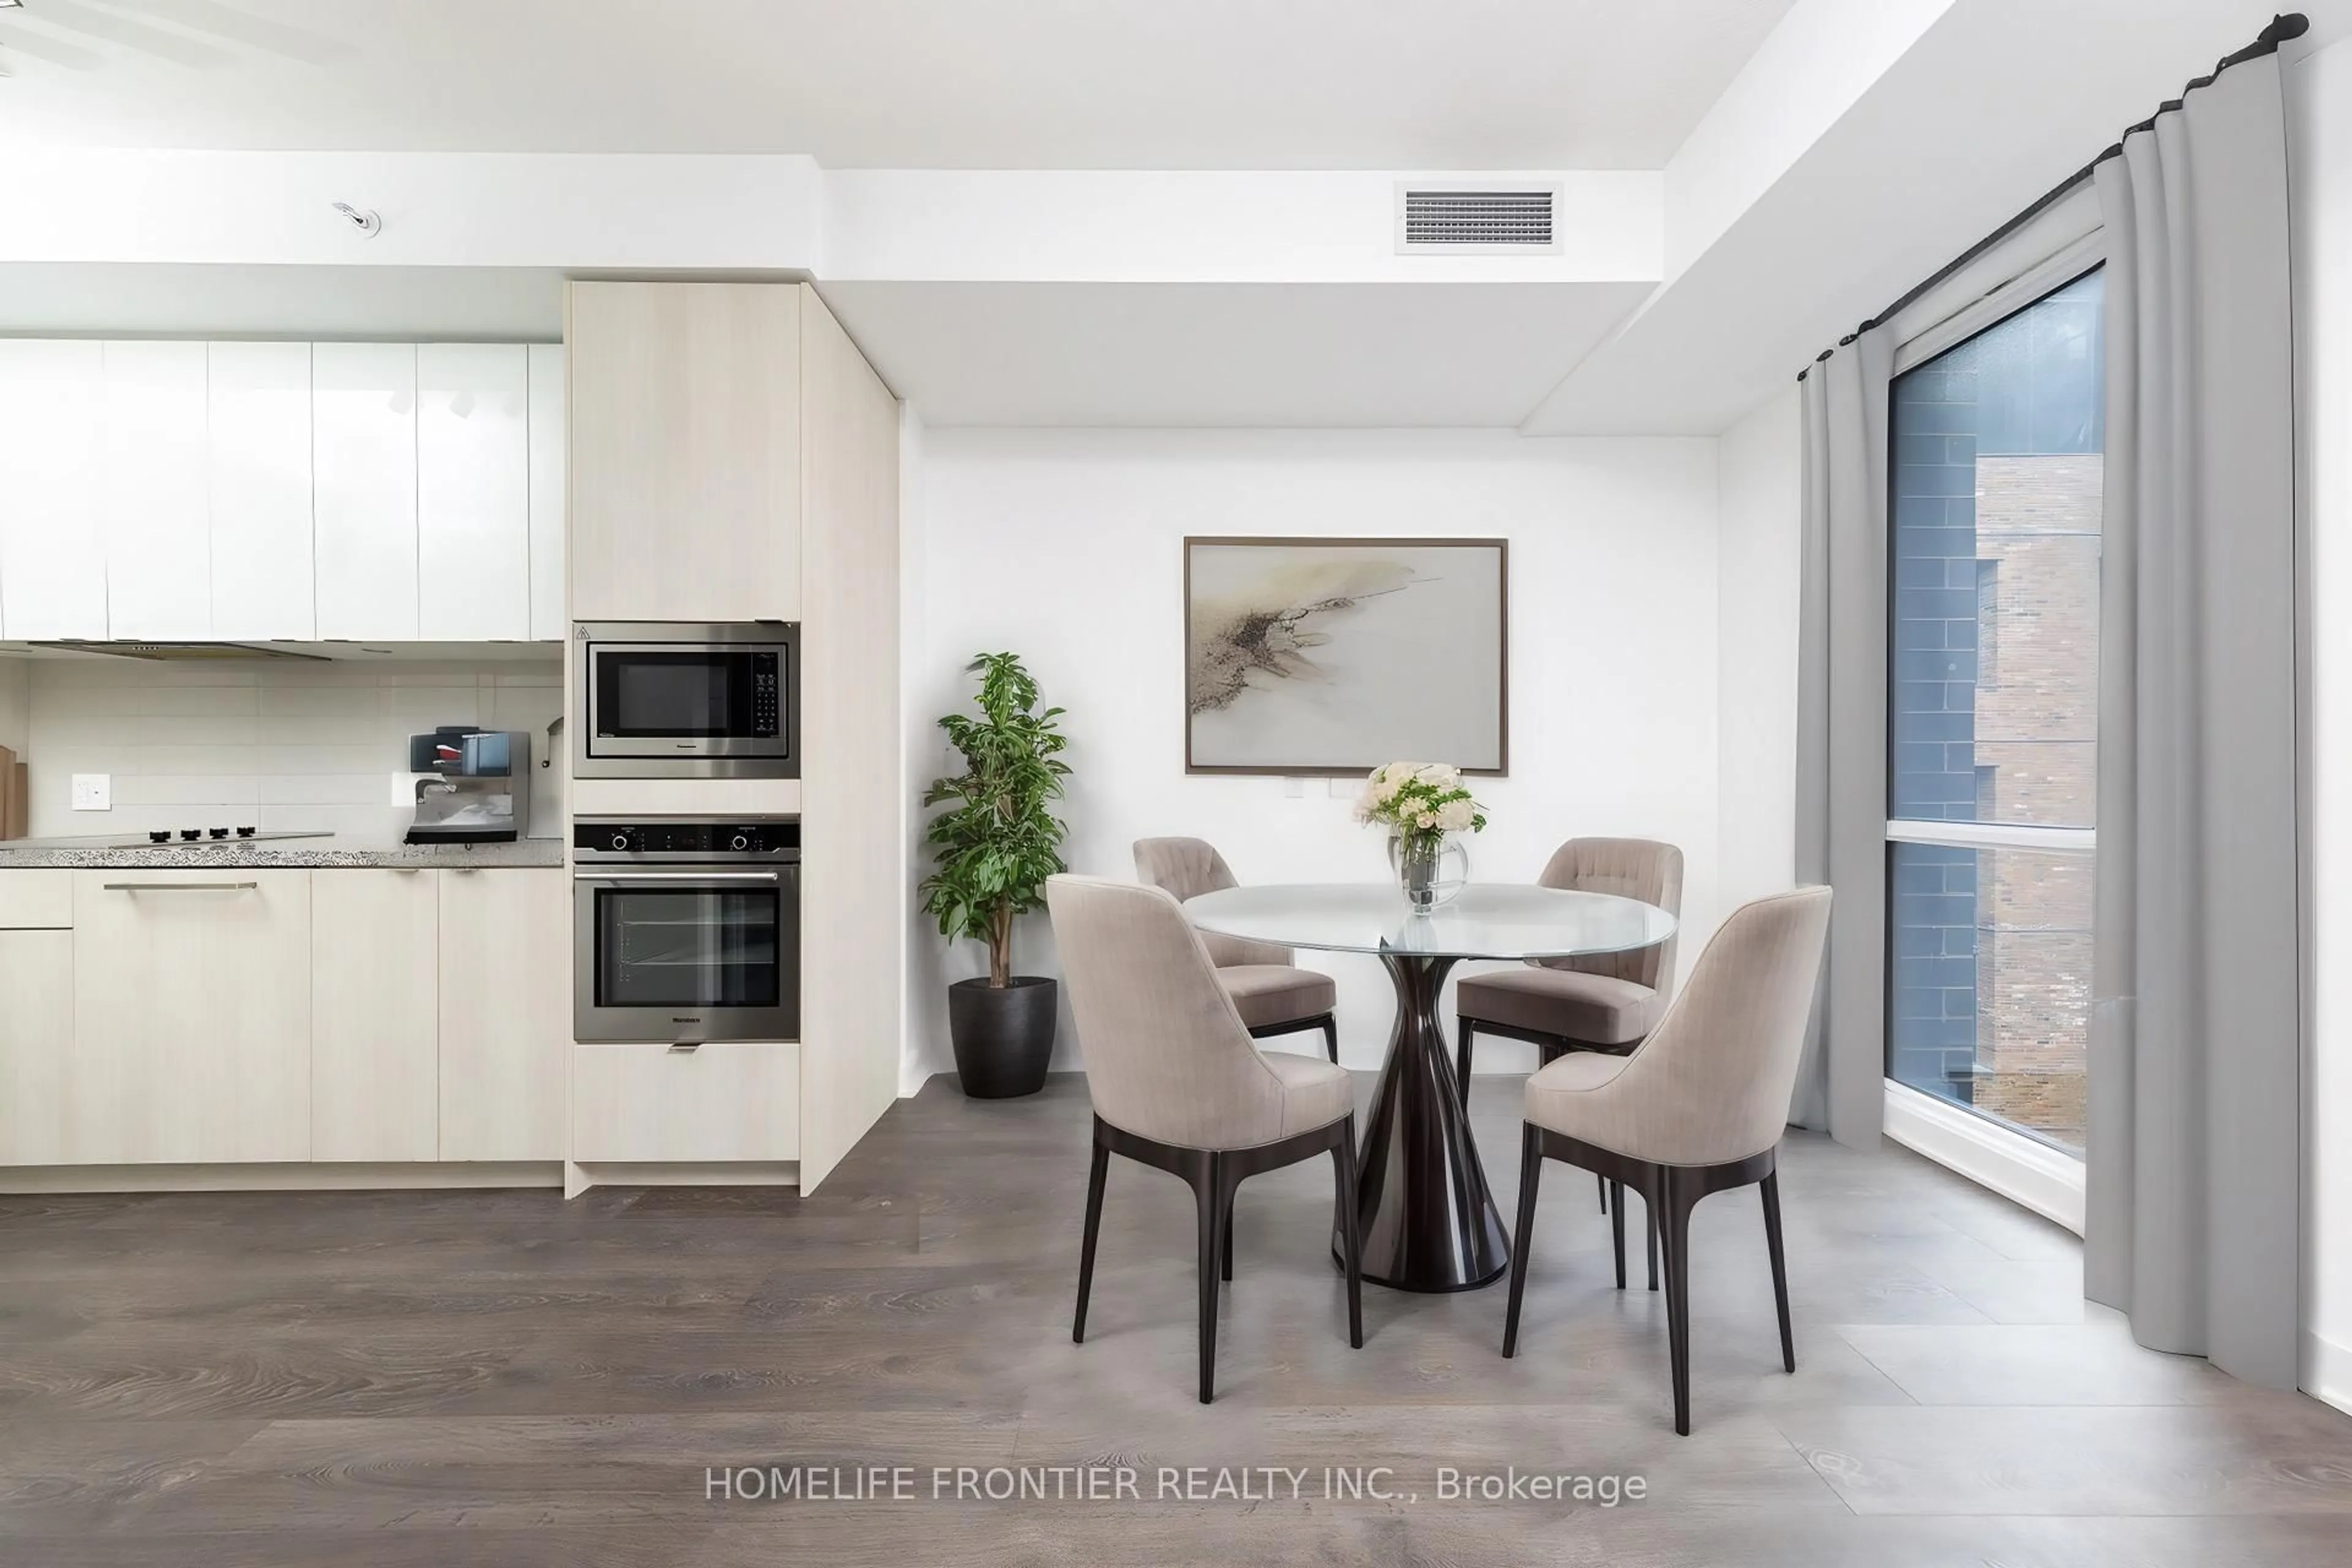
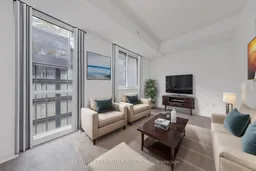
Want to have a quiet life in busy Downtown area & want to live in a safeand luxury area in downtown area? Then this unit will bring you the wonderful life! There is a path that leads directly to the subway station. You can jog everyday with your pets and spend mindful days in harbourfront. Why hesitate? Go and see it today!!
Property Details
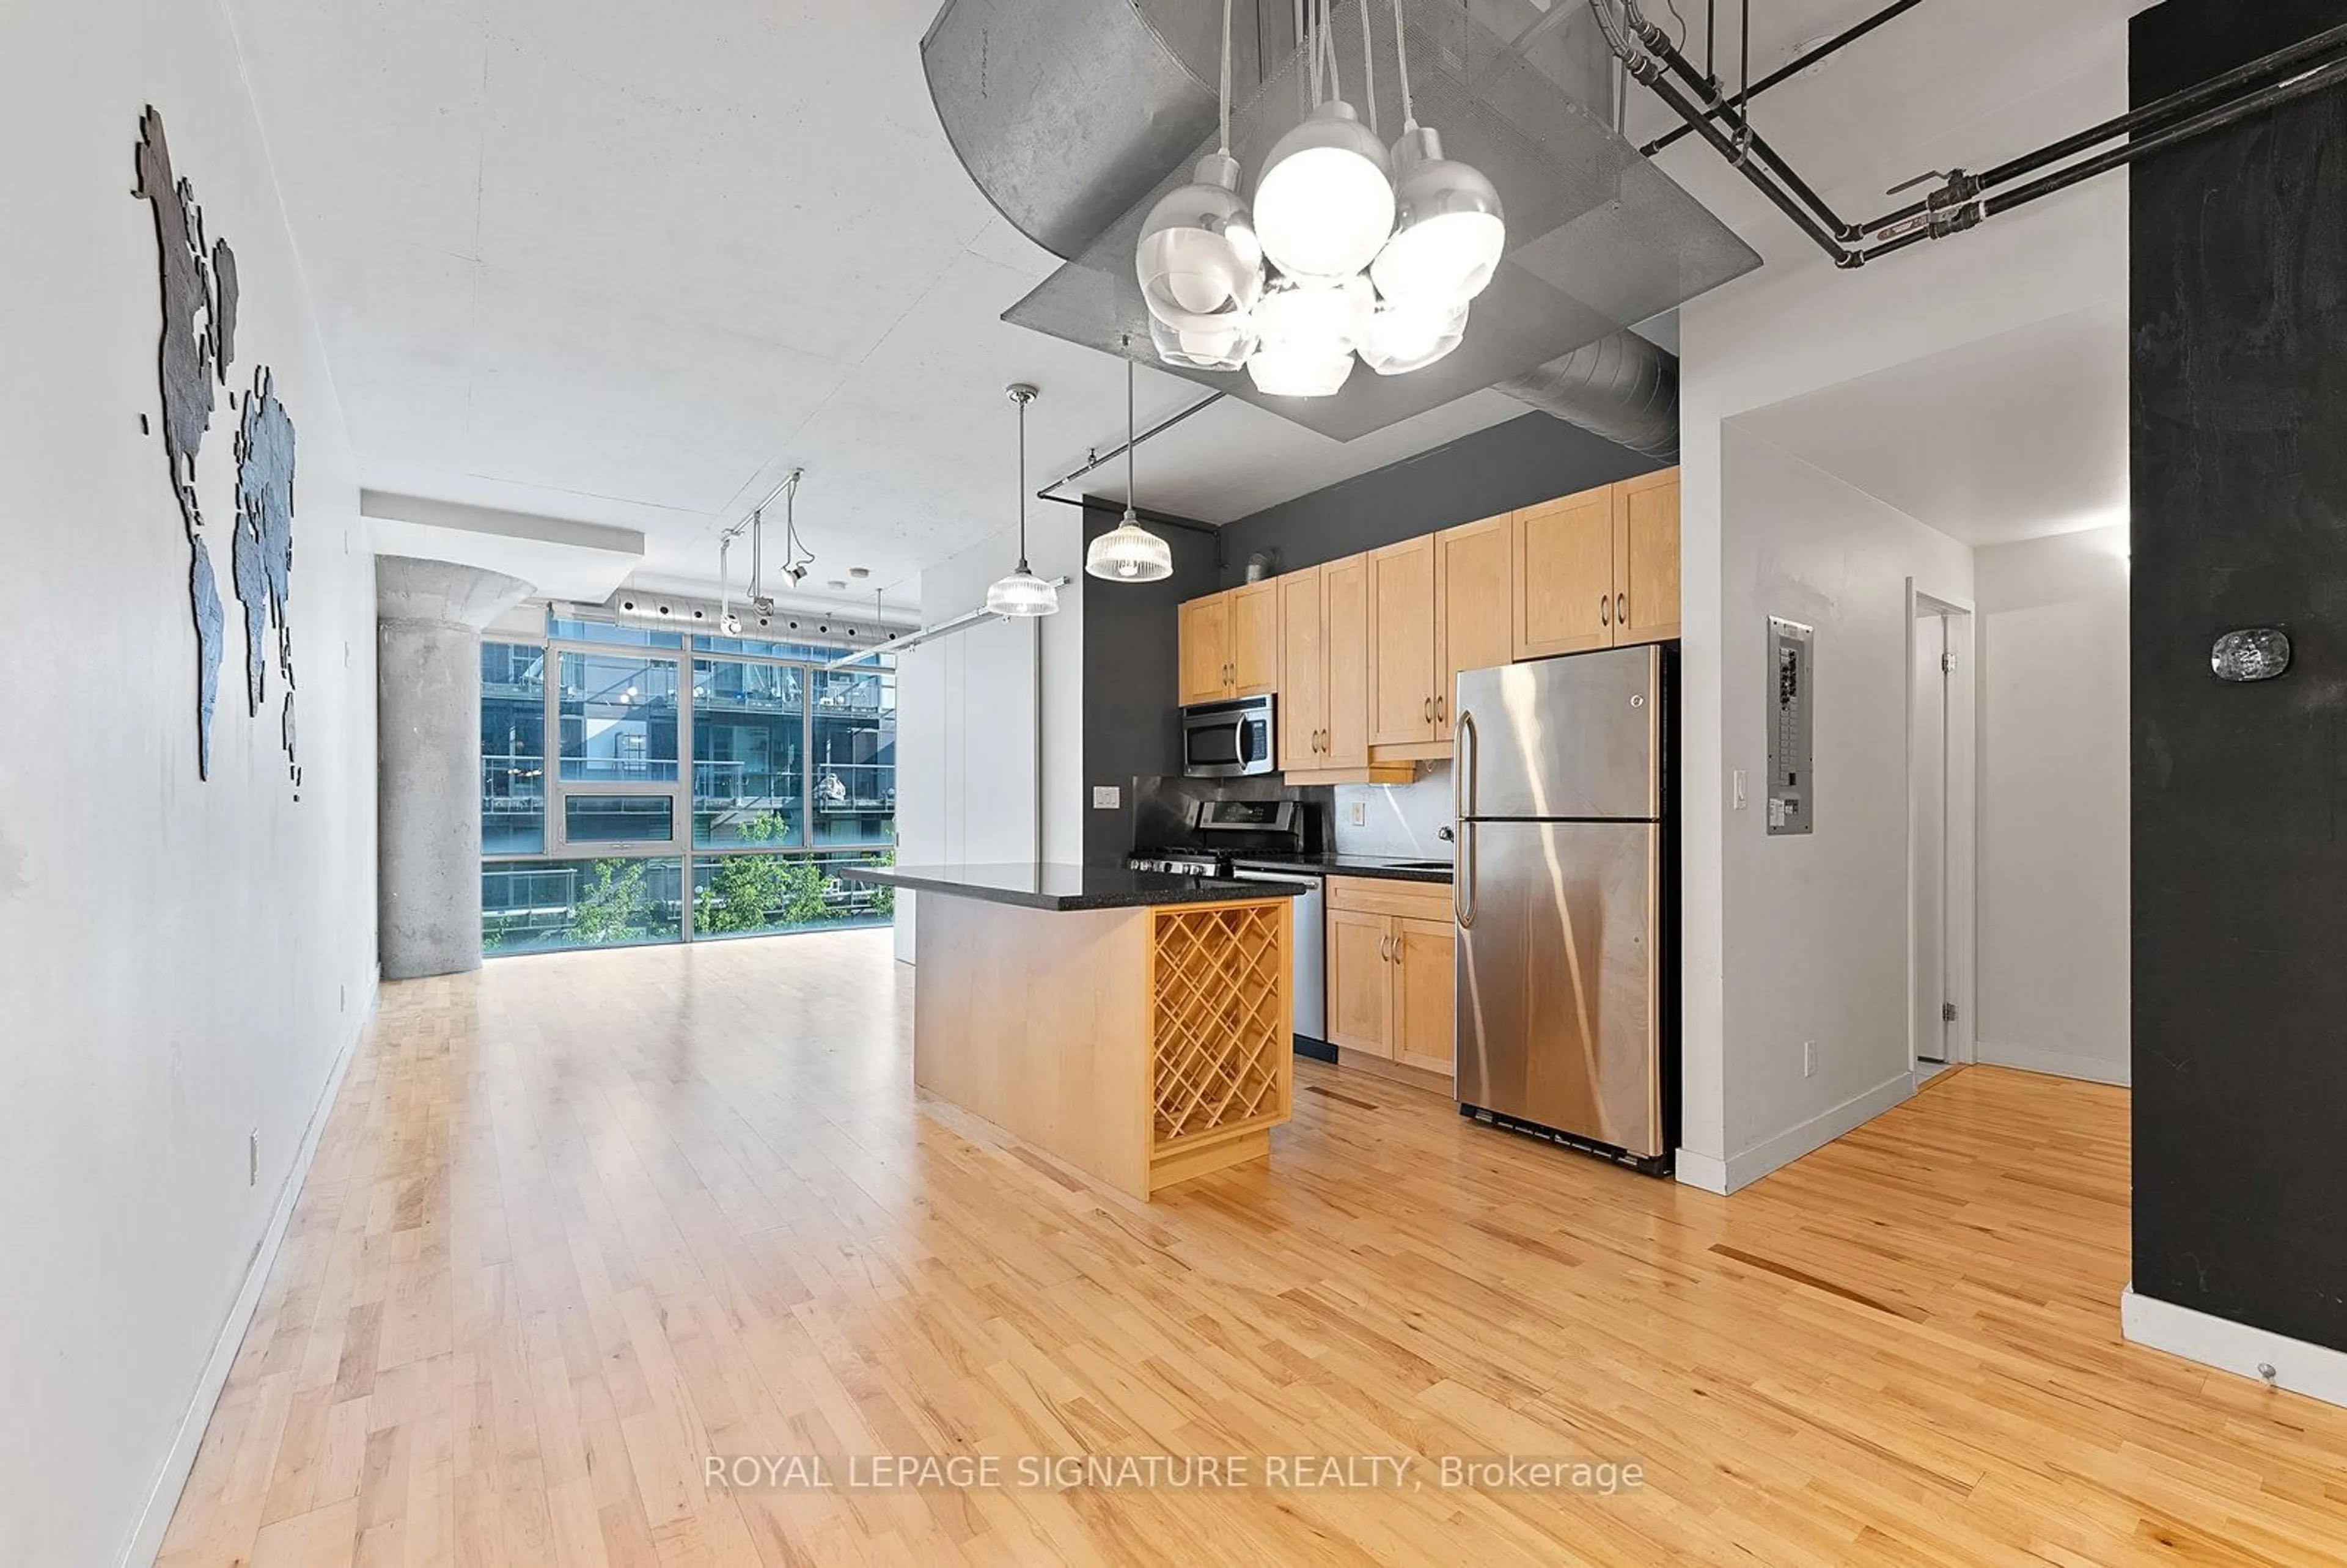
Interior
Features
Flat Floor
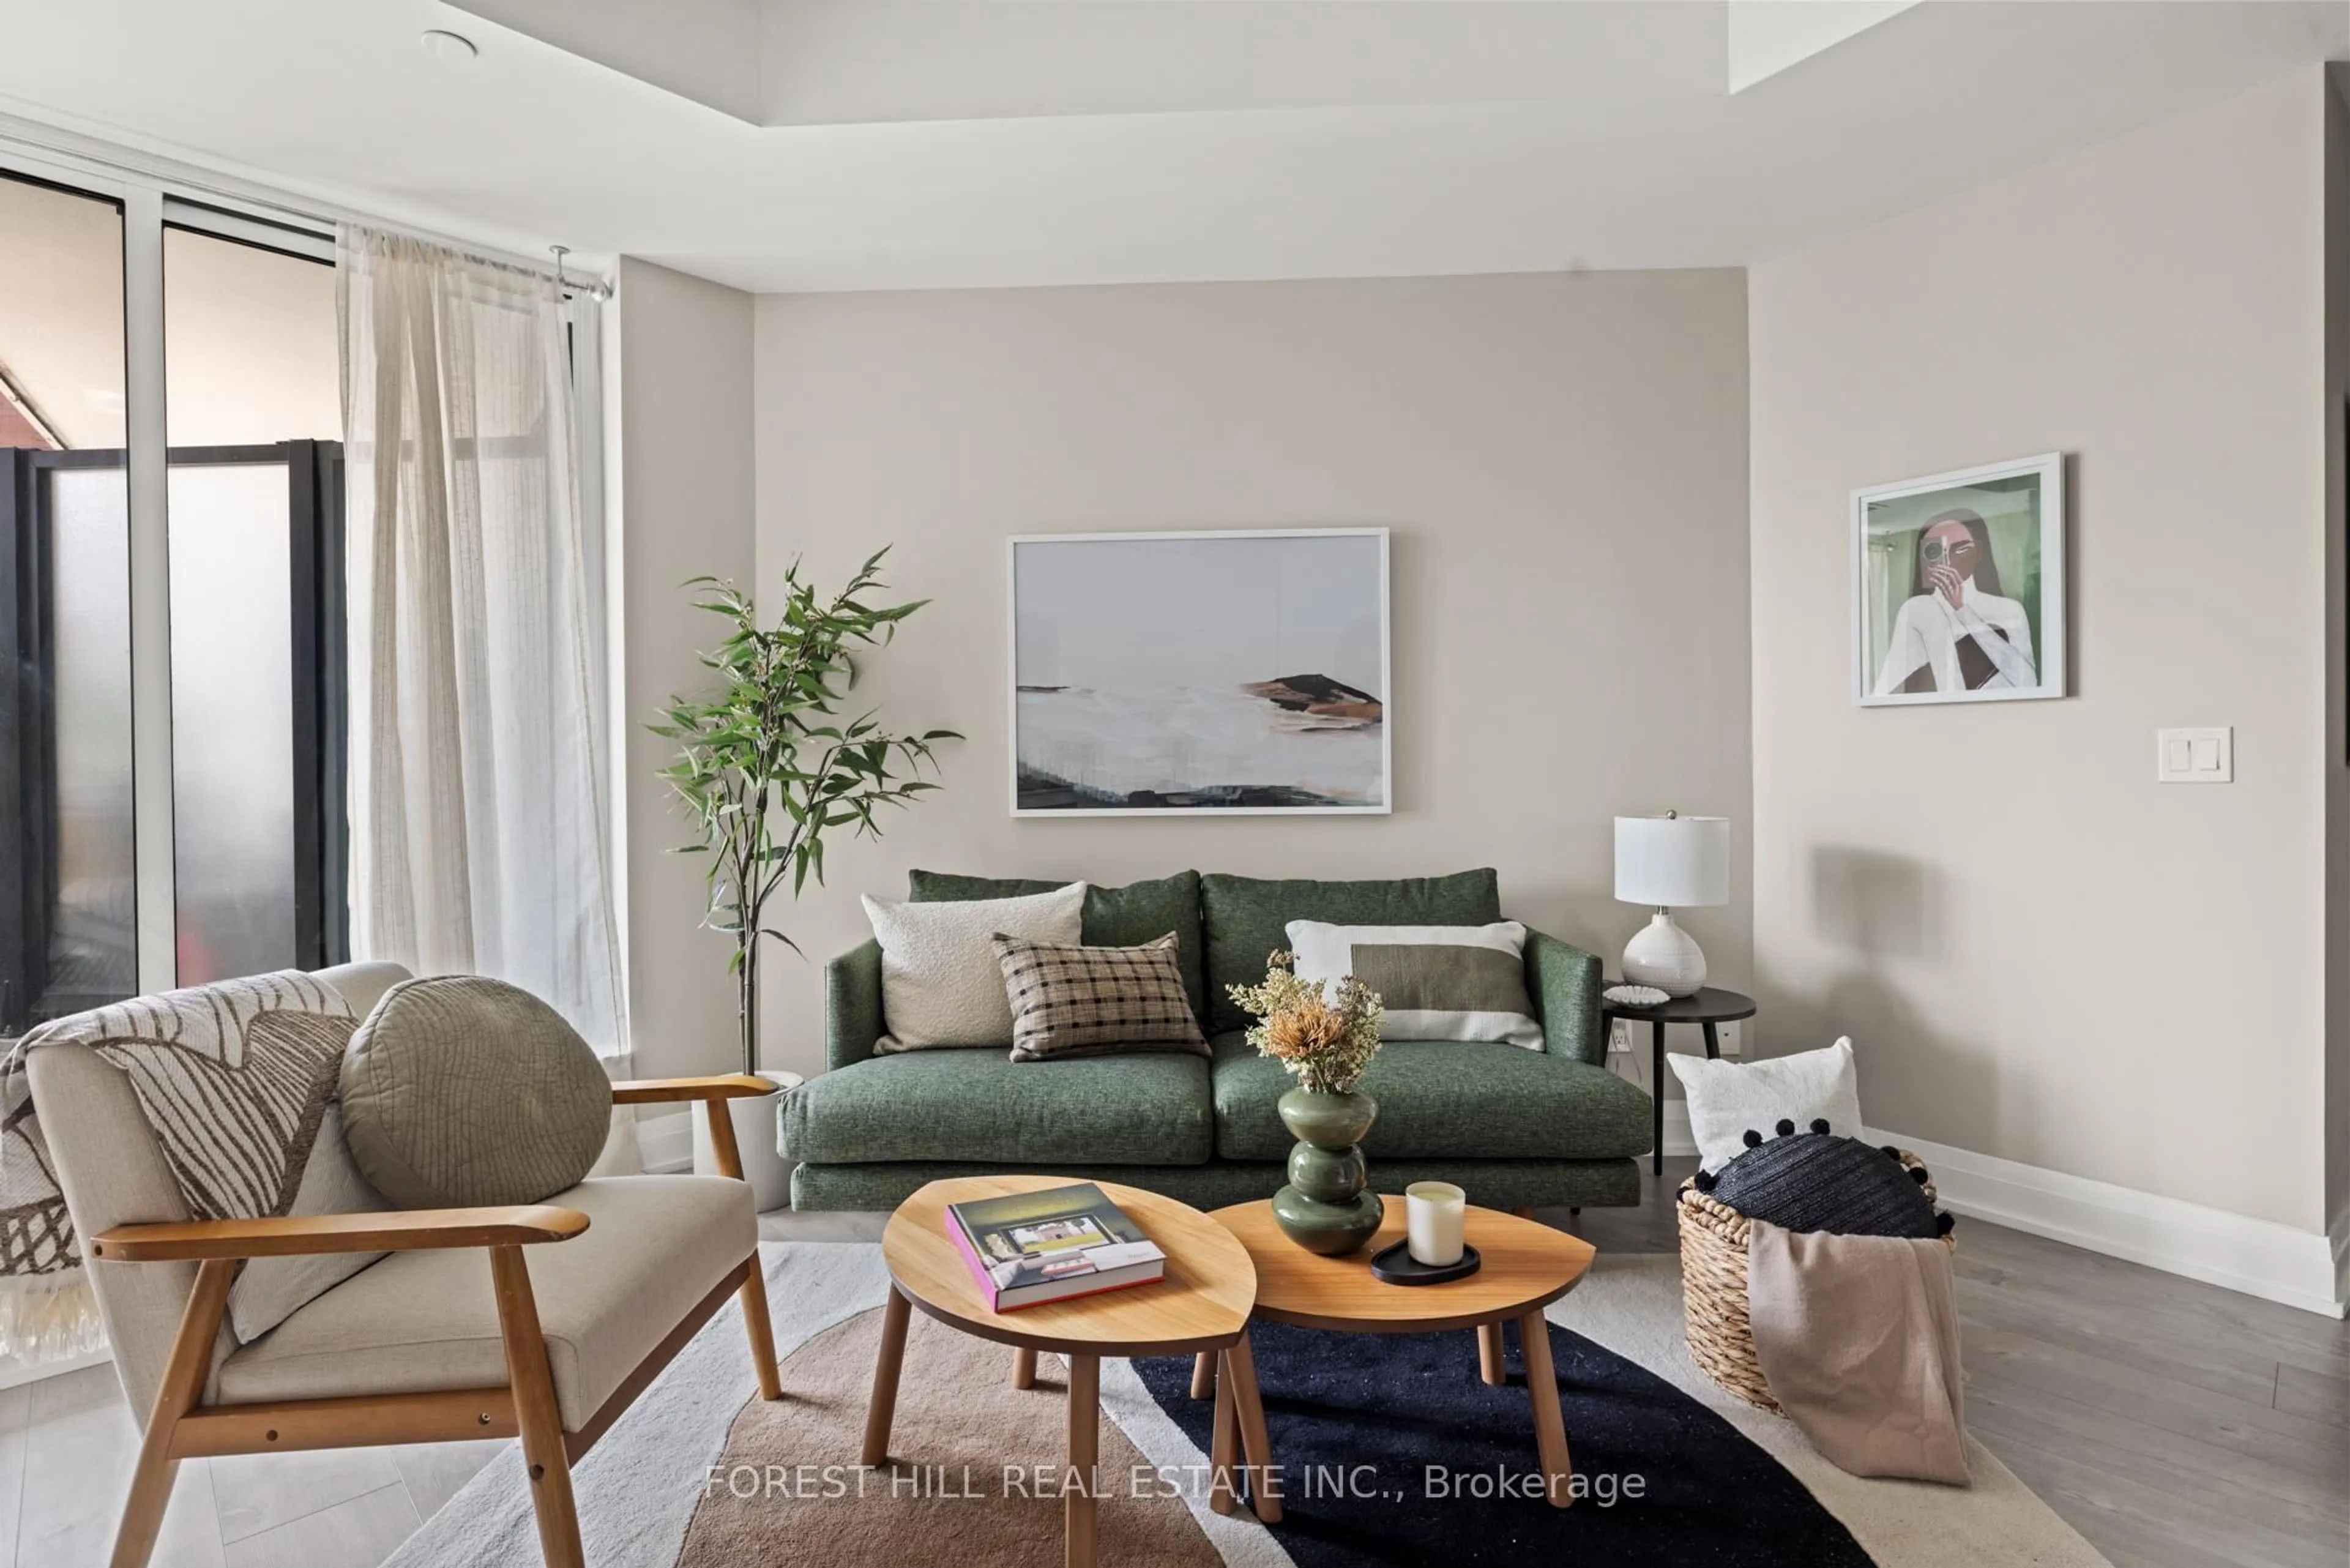
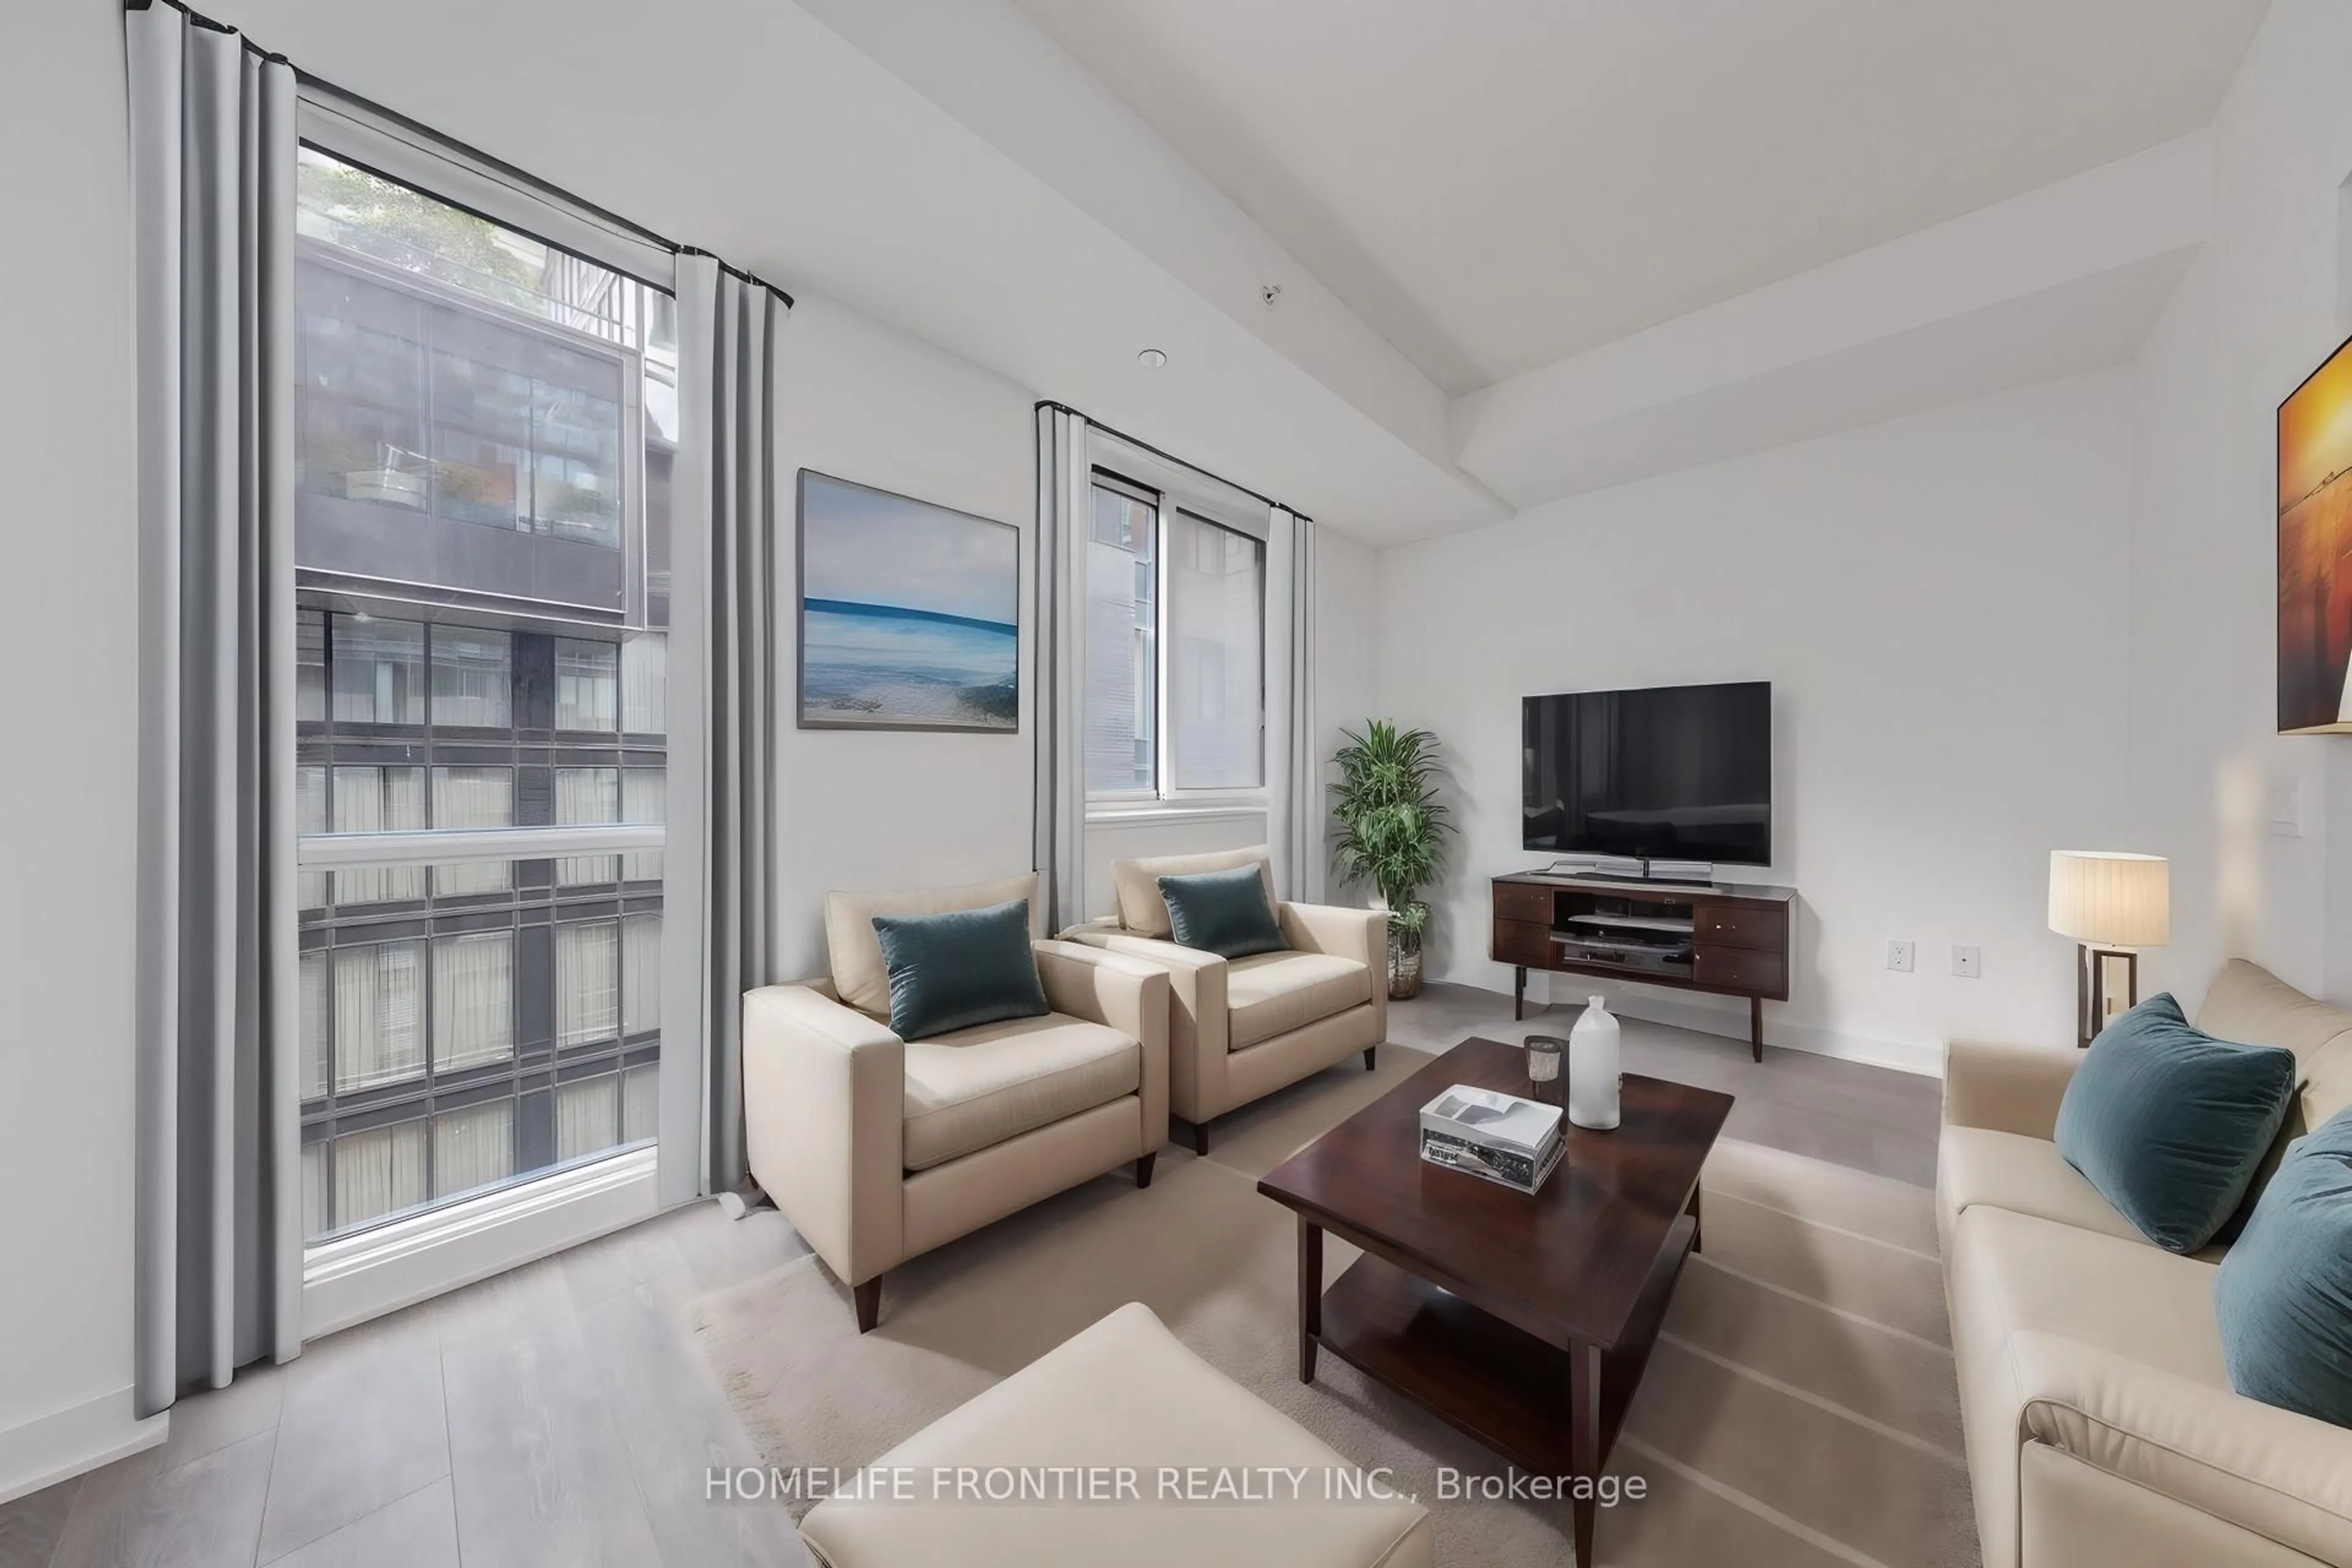
Living
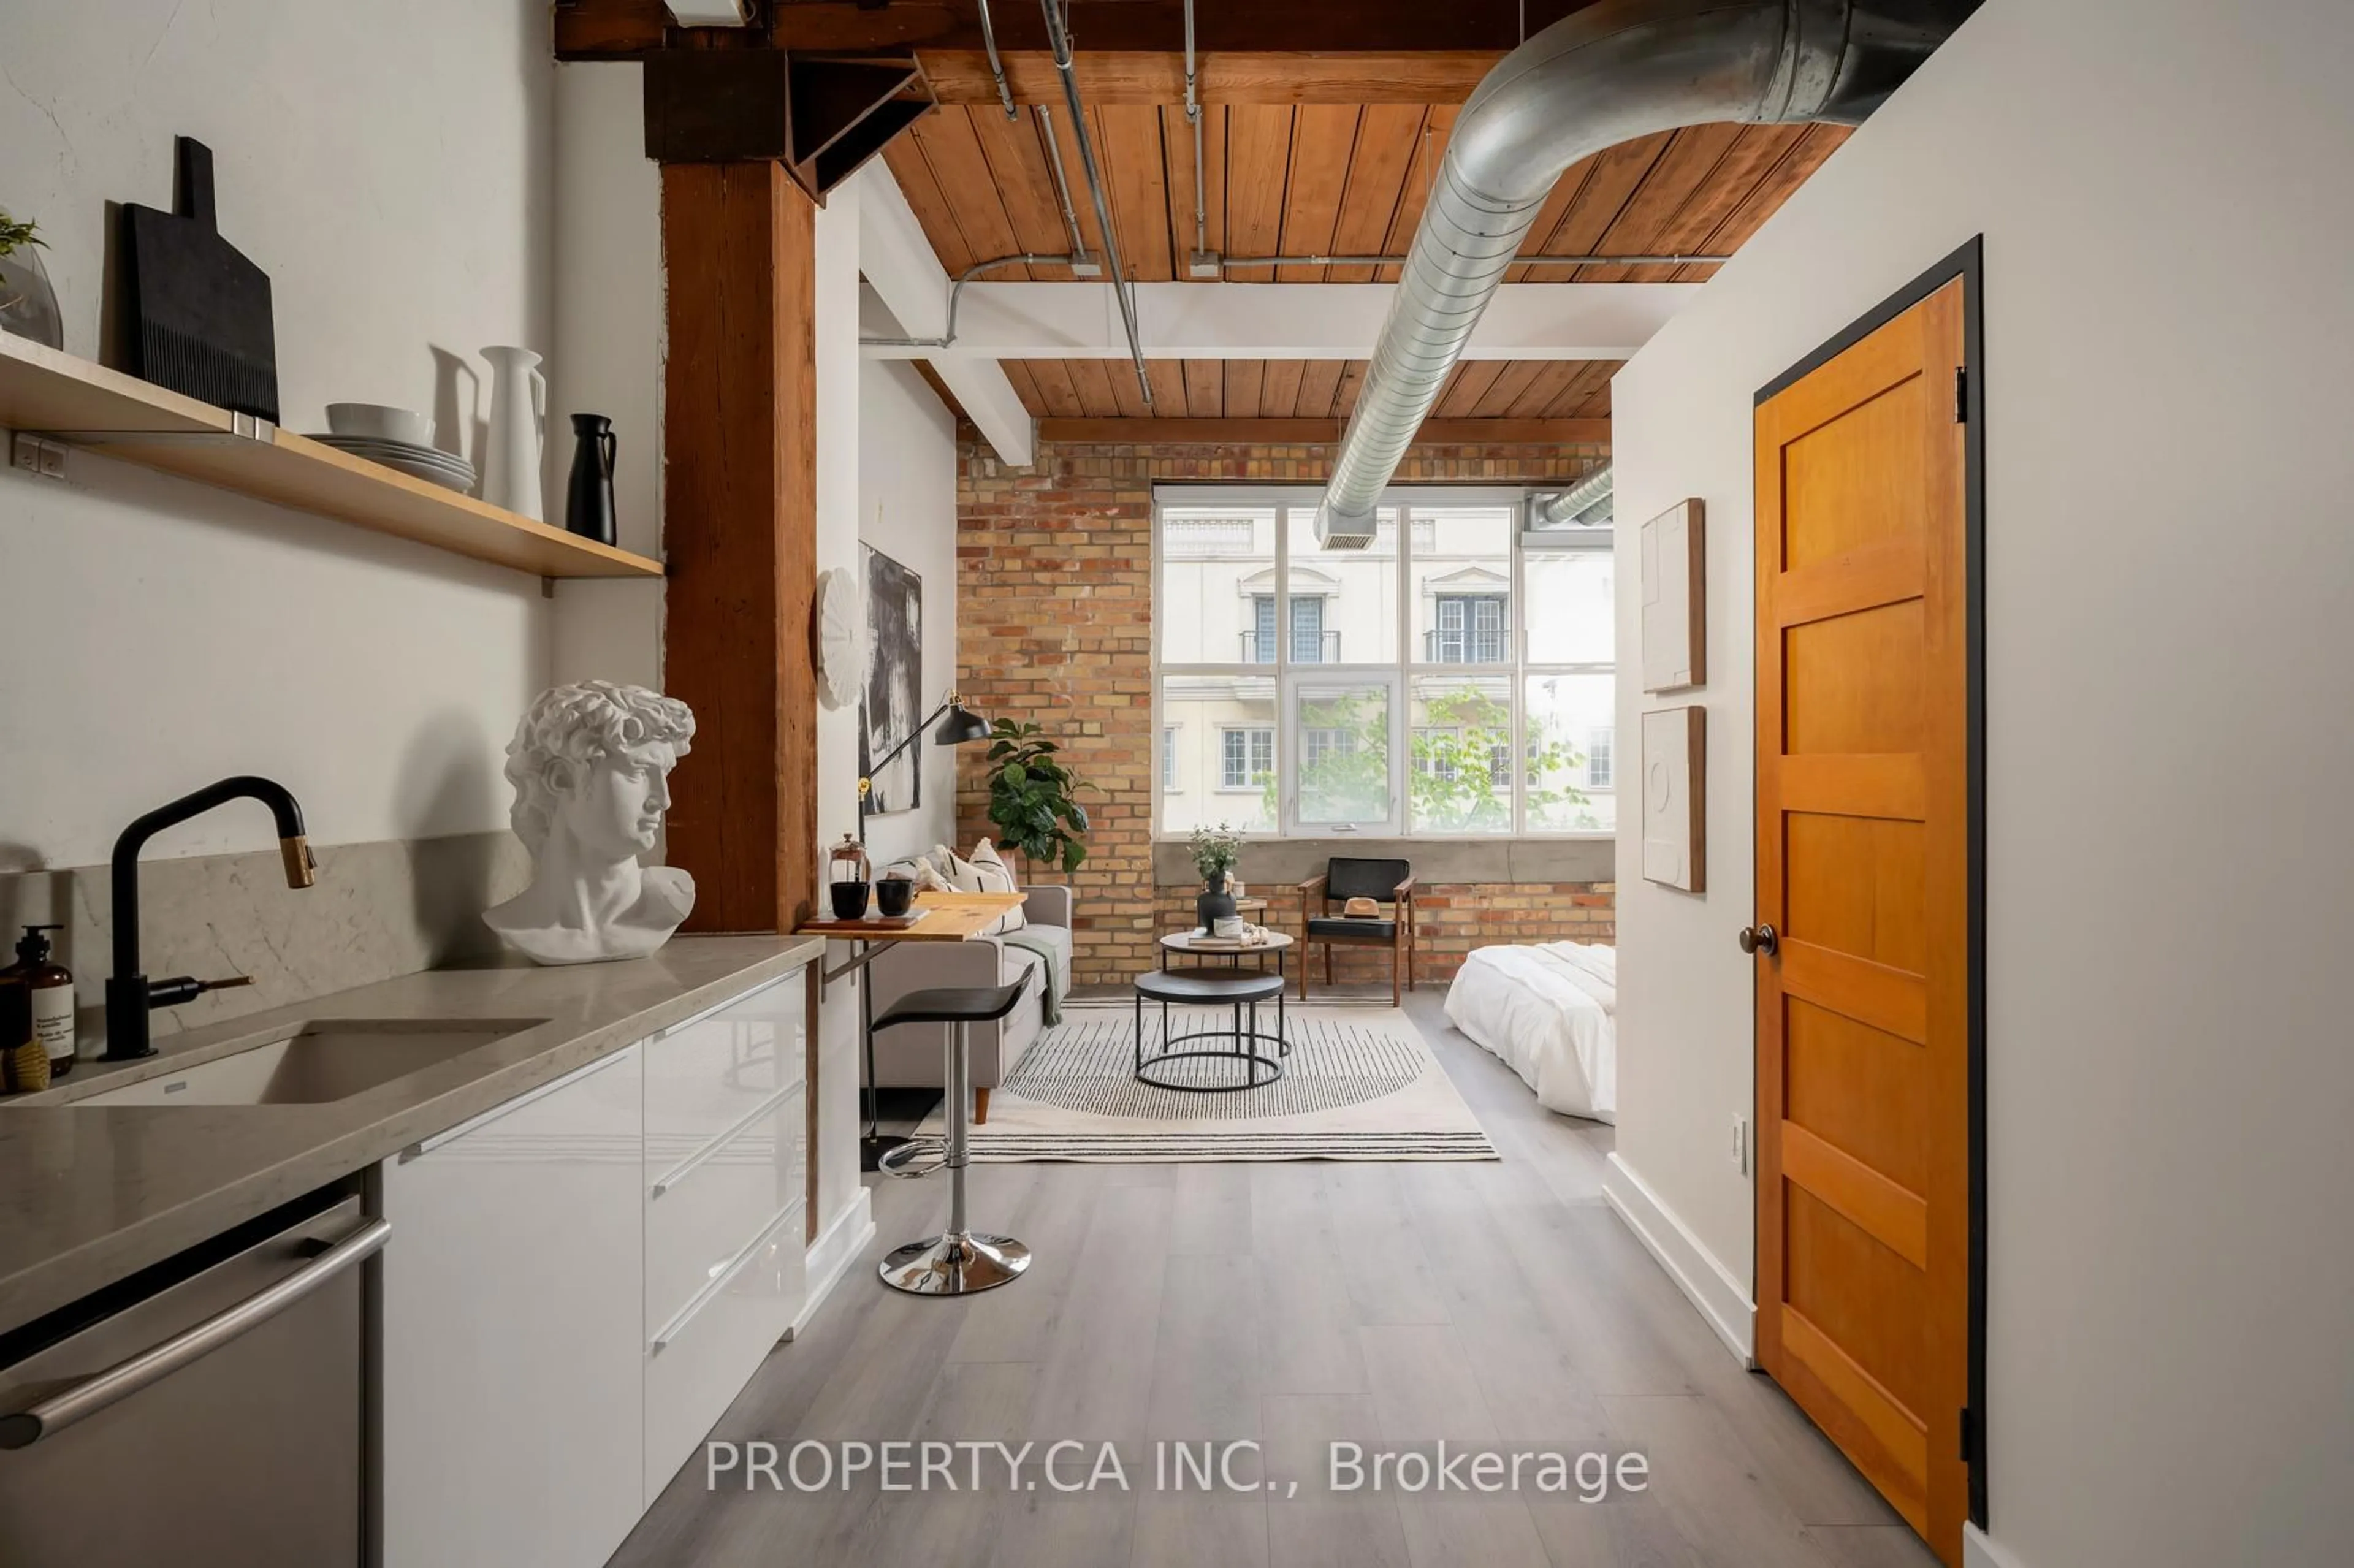
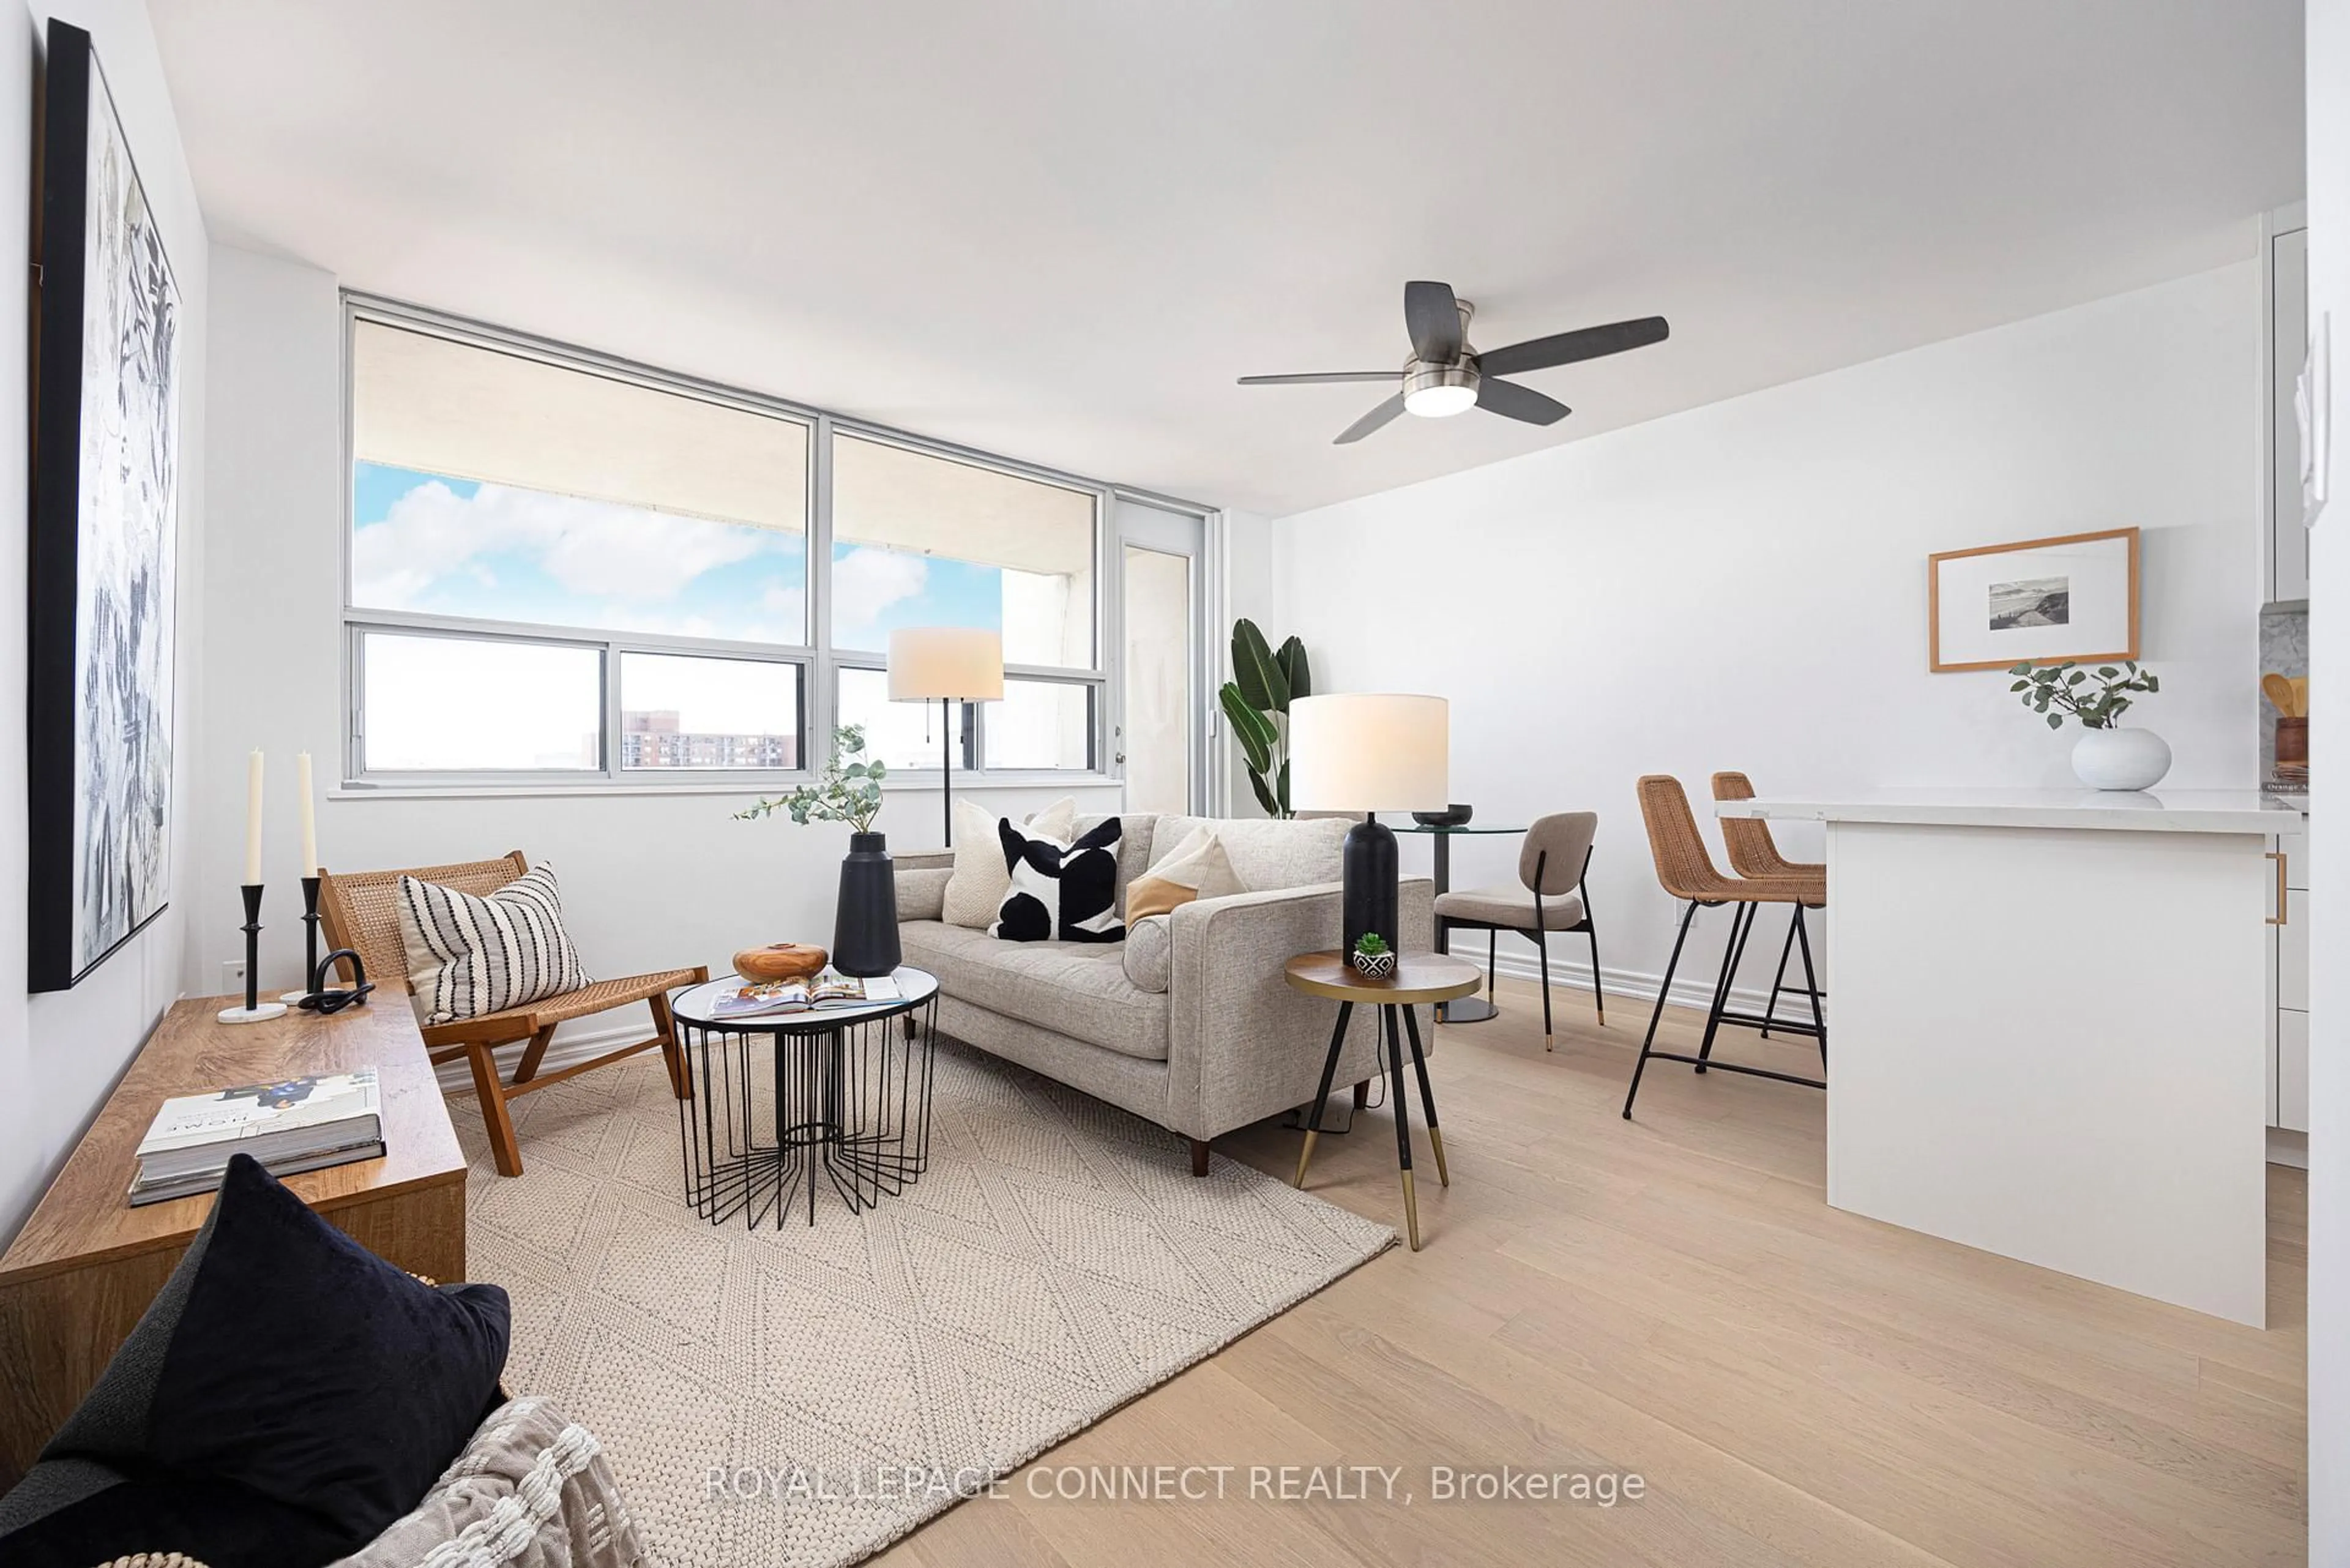
0.0 x 0.0Wood Floor / Combined W/Dining / Juliette Balcony
Dining
0.0 x 0.0Wood Floor / Combined W/Dining / Juliette Balcony
Kitchen
0.0 x 0.0Wood Floor / B/I Appliances
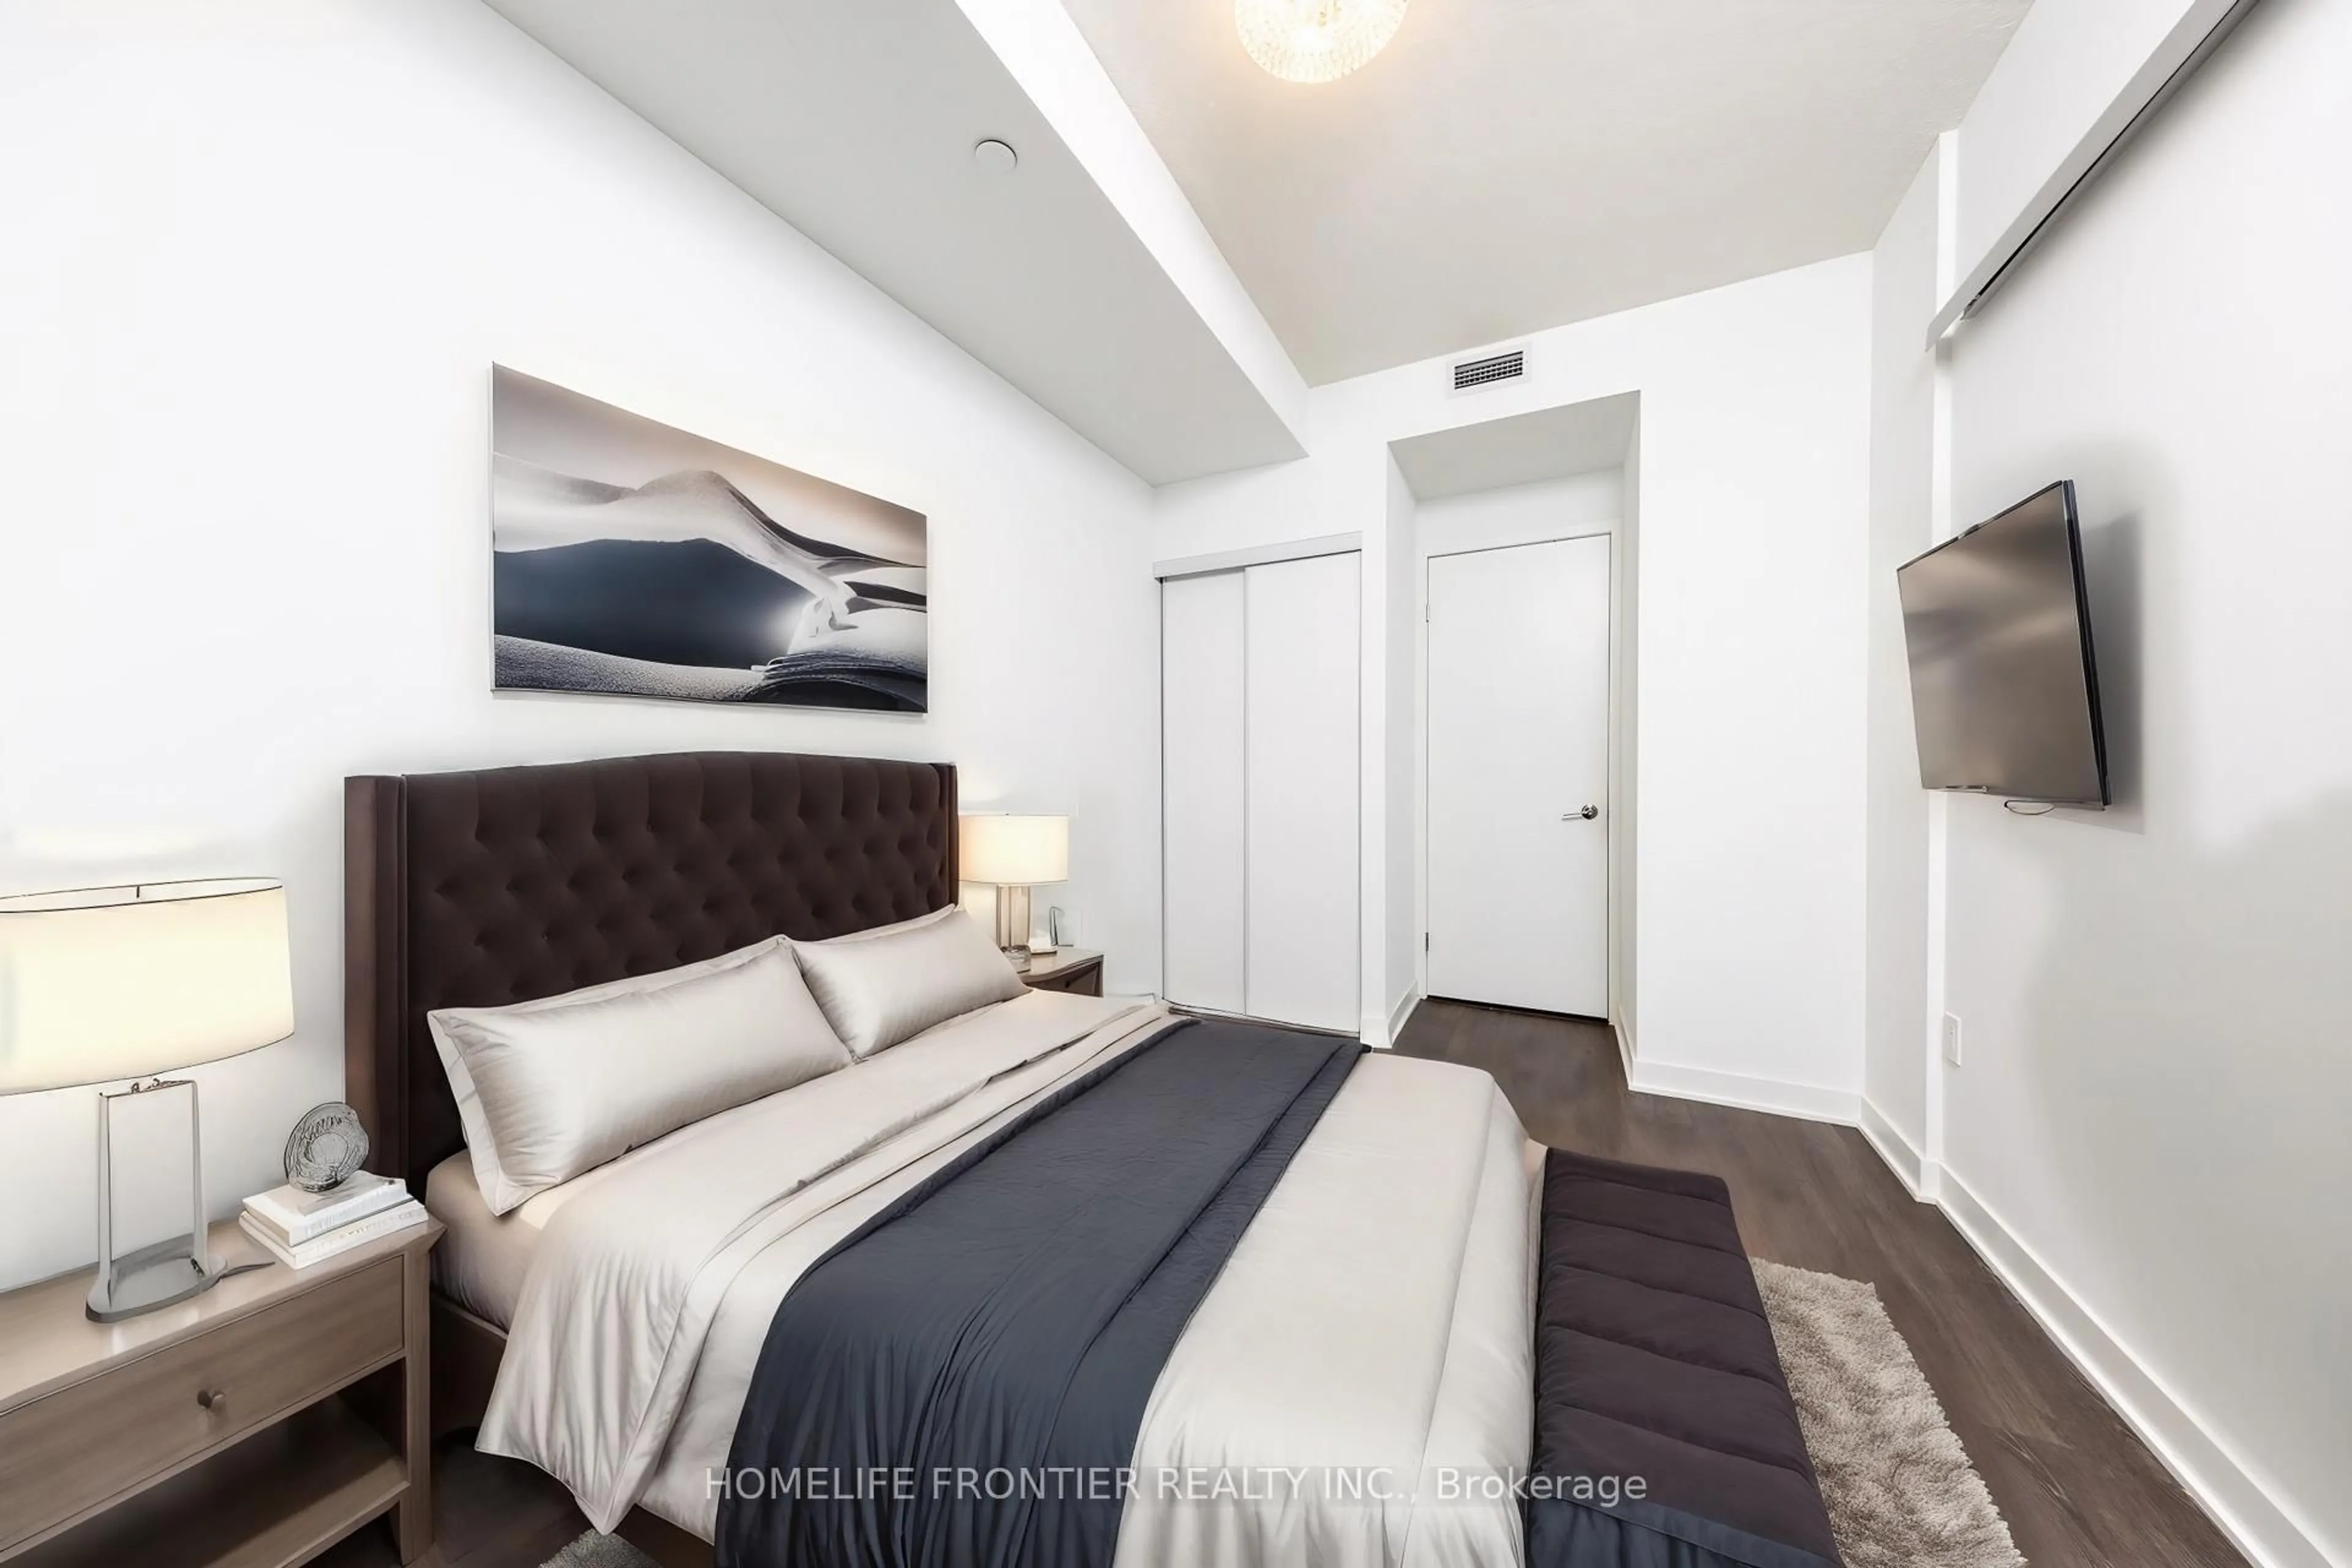
Primary
0.0 x 0.0Wood Floor / Sliding Doors
Exterior
Features
Condo Details
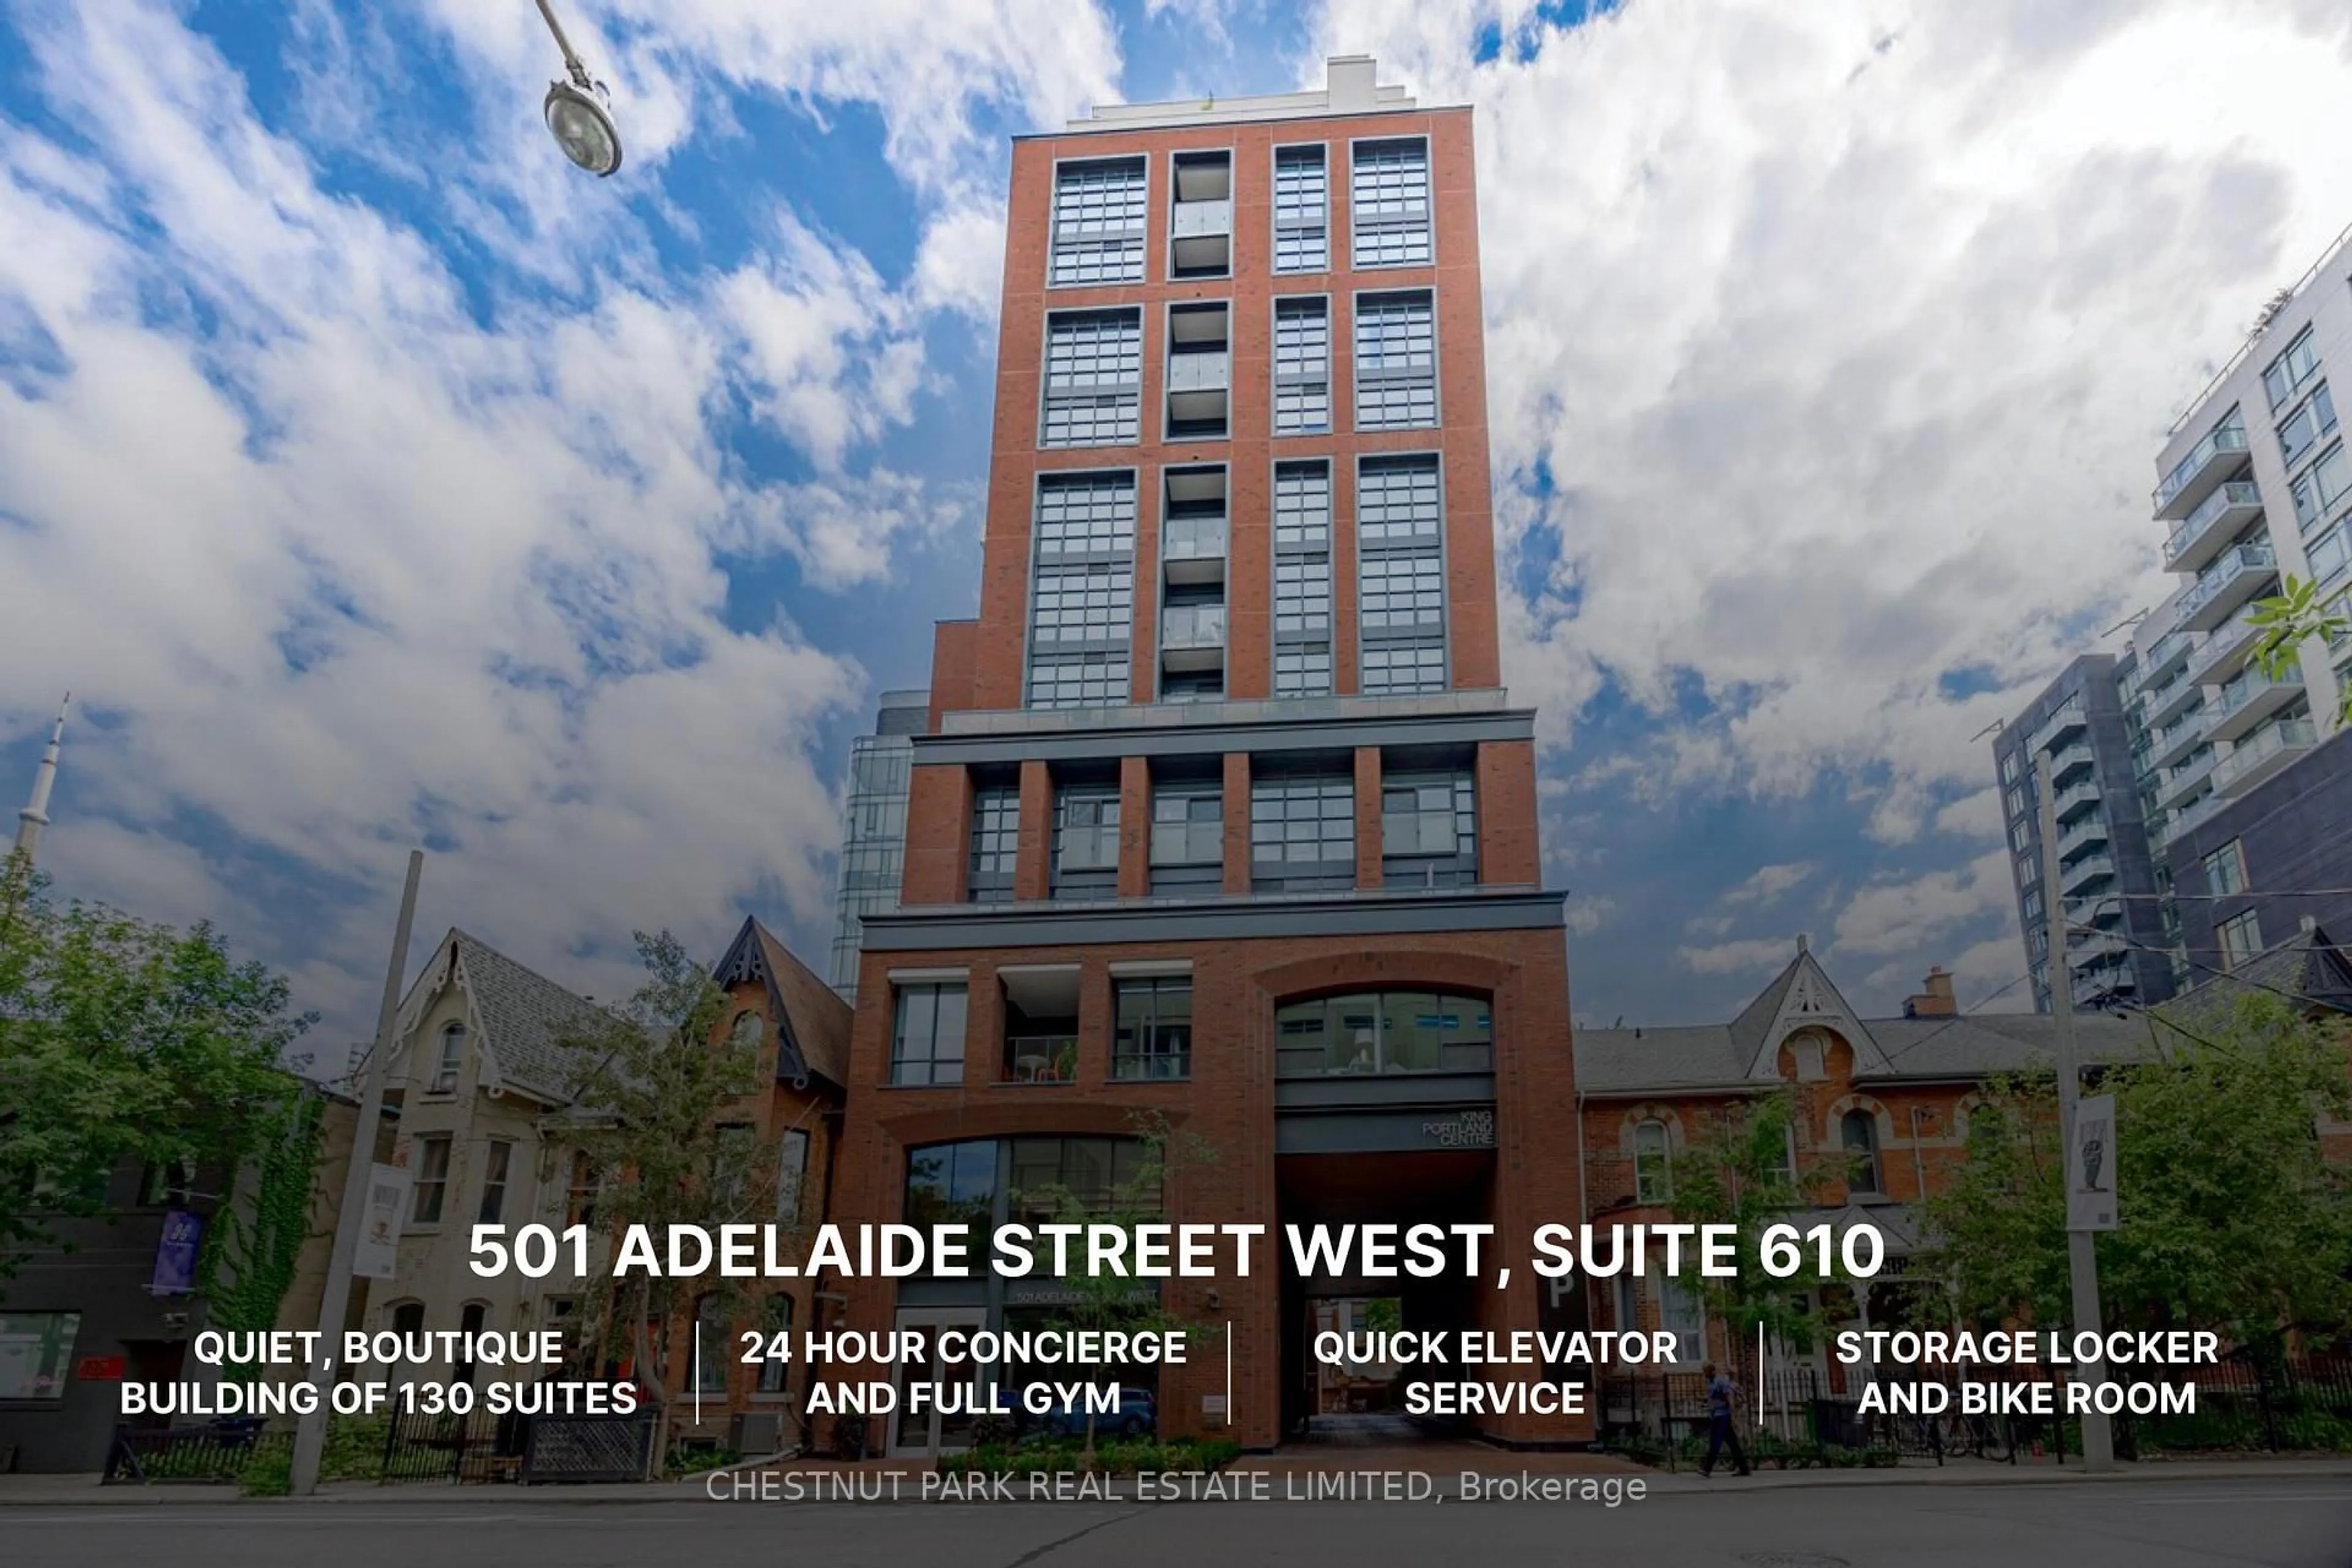
Amenities
Concierge, Gym, Indoor Pool, Party/Meeting Room, Rooftop Deck/Garden, Visitor Parking
Inclusions
Property History
 35
35