Bedroom with bed, unknown for 48 Sullivan St, Toronto Ontario M5T 1C1
Re-listed 23 days ago

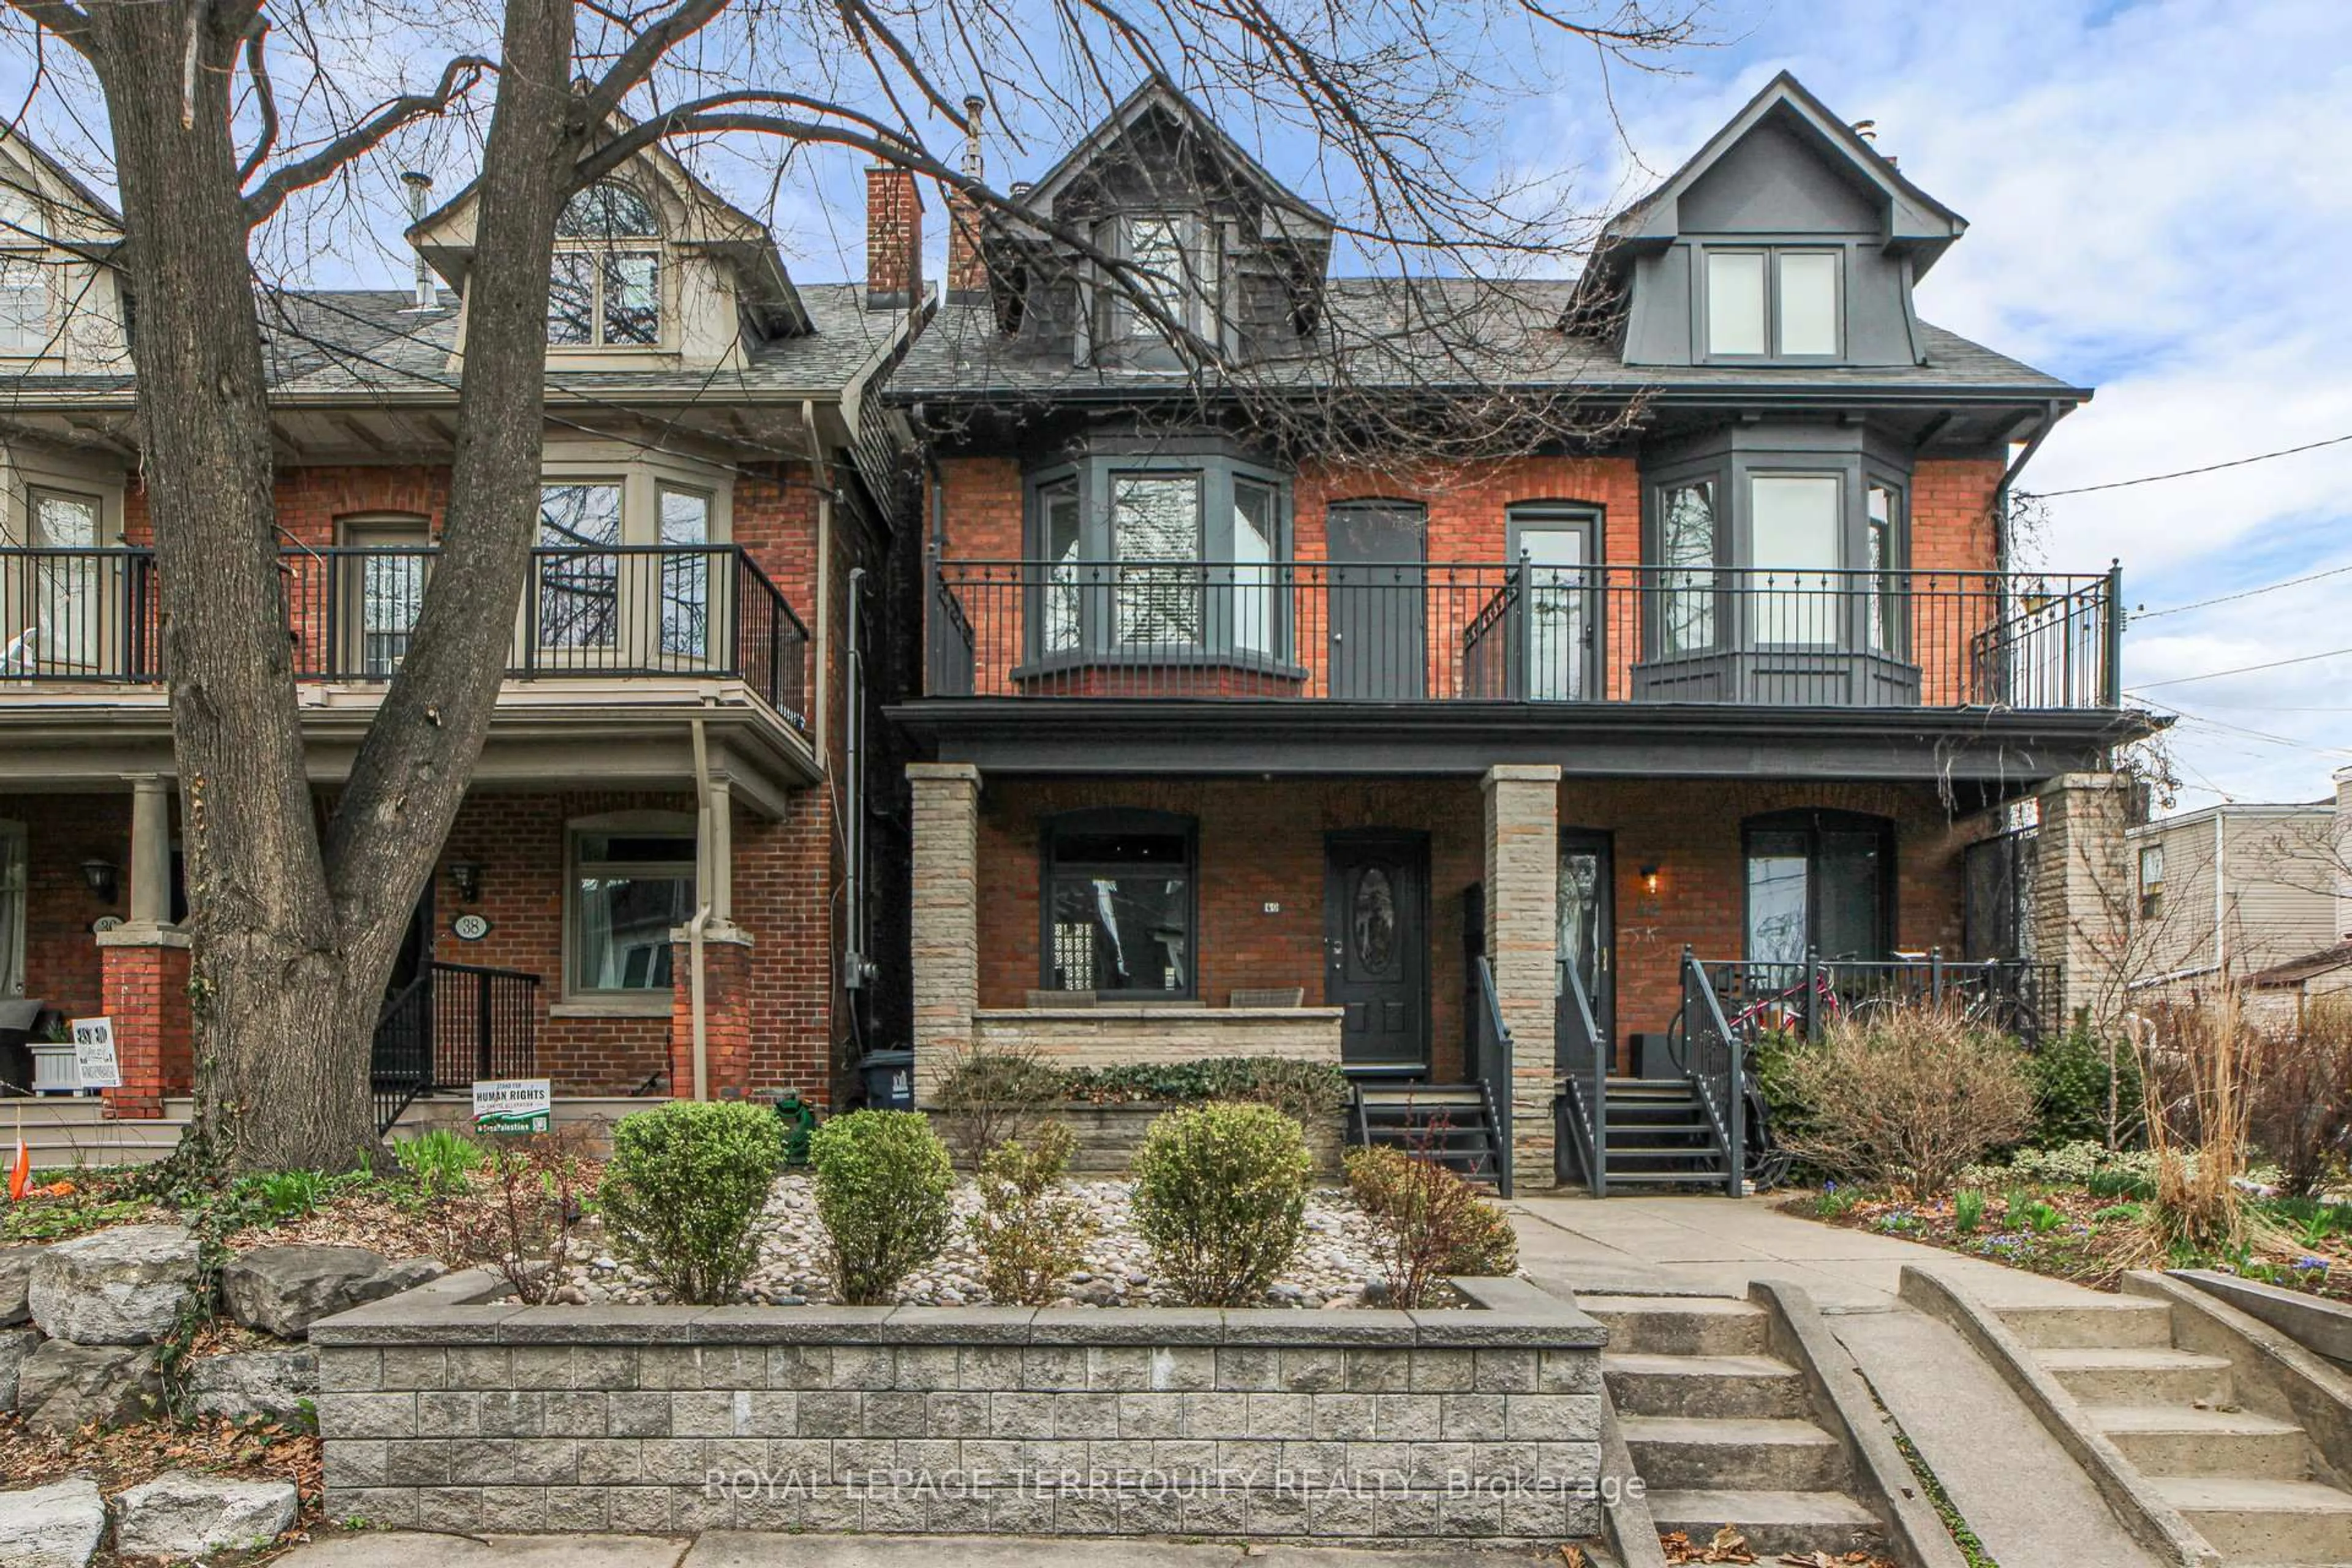
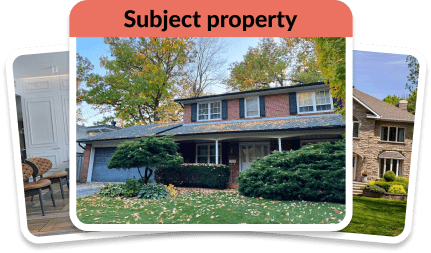
48 Sullivan St, Toronto, Ontario M5T 1C1

Townhouse
5 + 1
2
~1100-1500 sqft
$•••,•••
$1,088,000
Get pre-qualifiedPowered by nesto
Buy with Wahi to get
Up to
$10,880Cashback
Townhouse
5 + 1
2
~1100-1500 sqft

Contact us about this property

Call

Highlights

Property Estimate

Days on market23 days

Total days on market
85 days

Estimated valueNot available

Price/Sqft$857/sqft

Monthly cost

Open Calculator

CMA Subject Property

Curious about what homes are selling for in this area?

Get a report on comparable homes with helpful insights and trends.

+1

Properties sold*

$900K

Median sold price*

*Based on last 30 days

Description

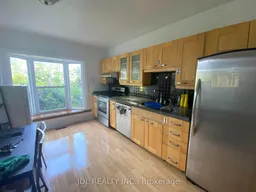
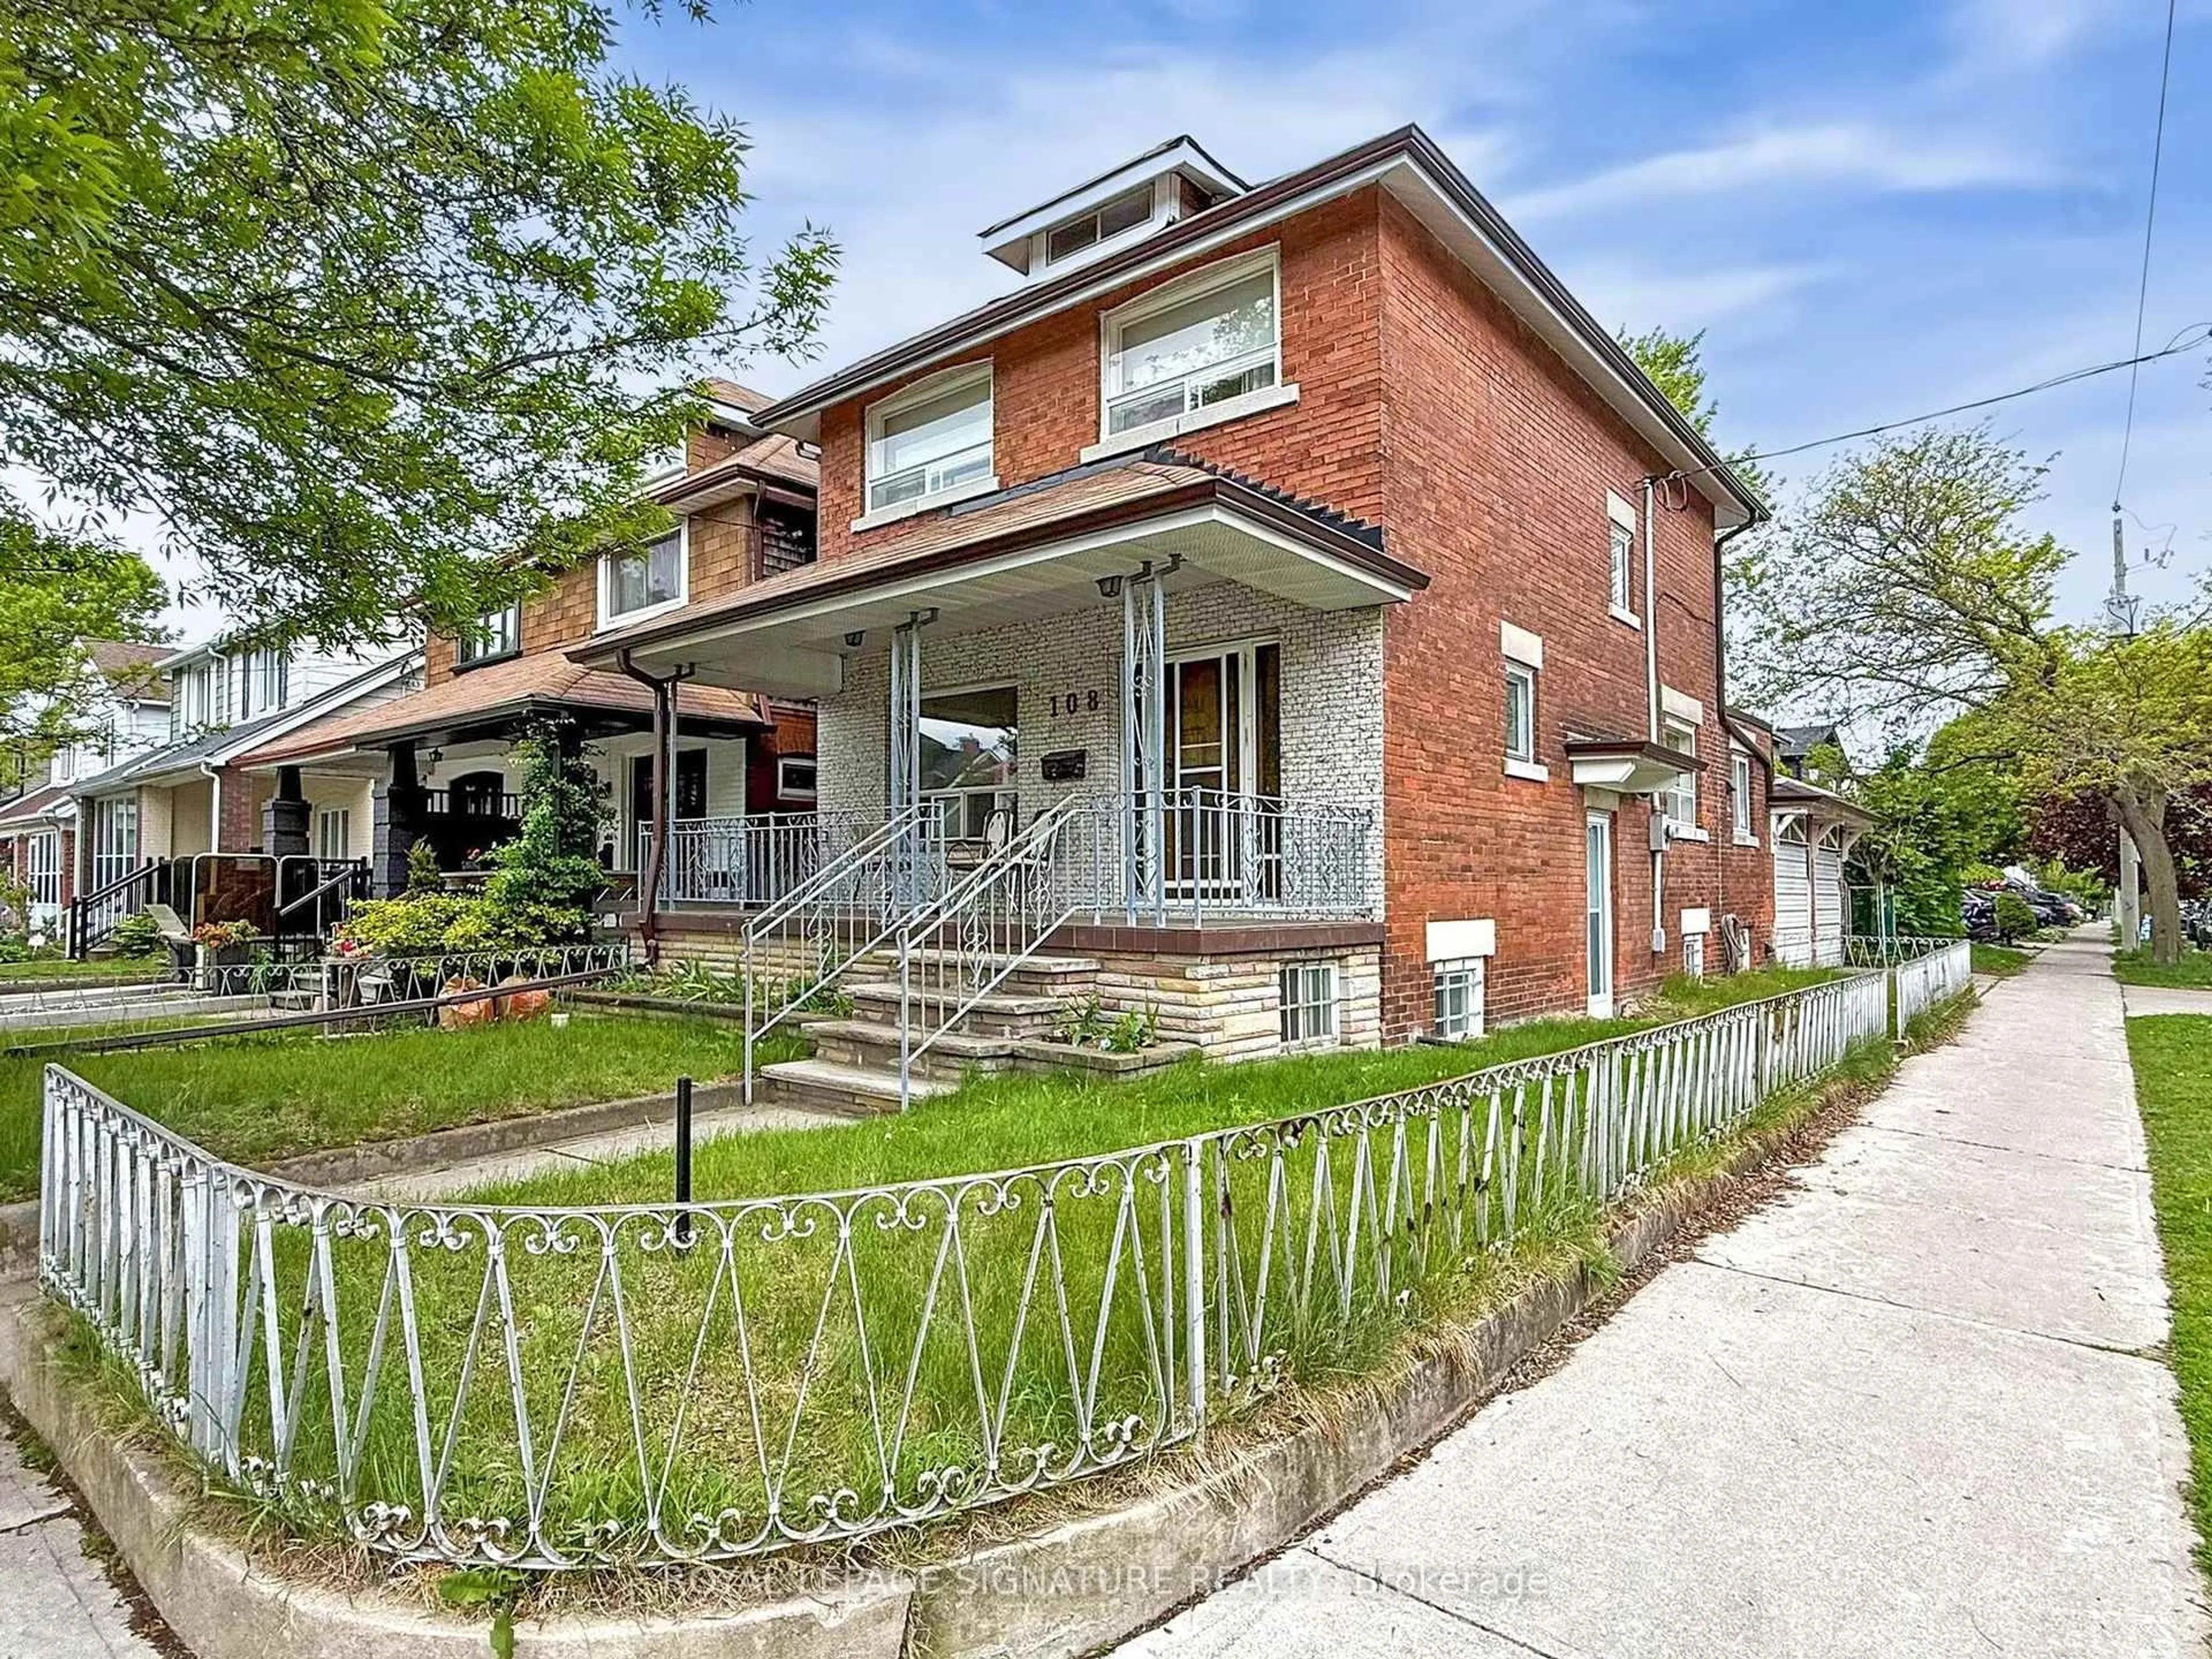
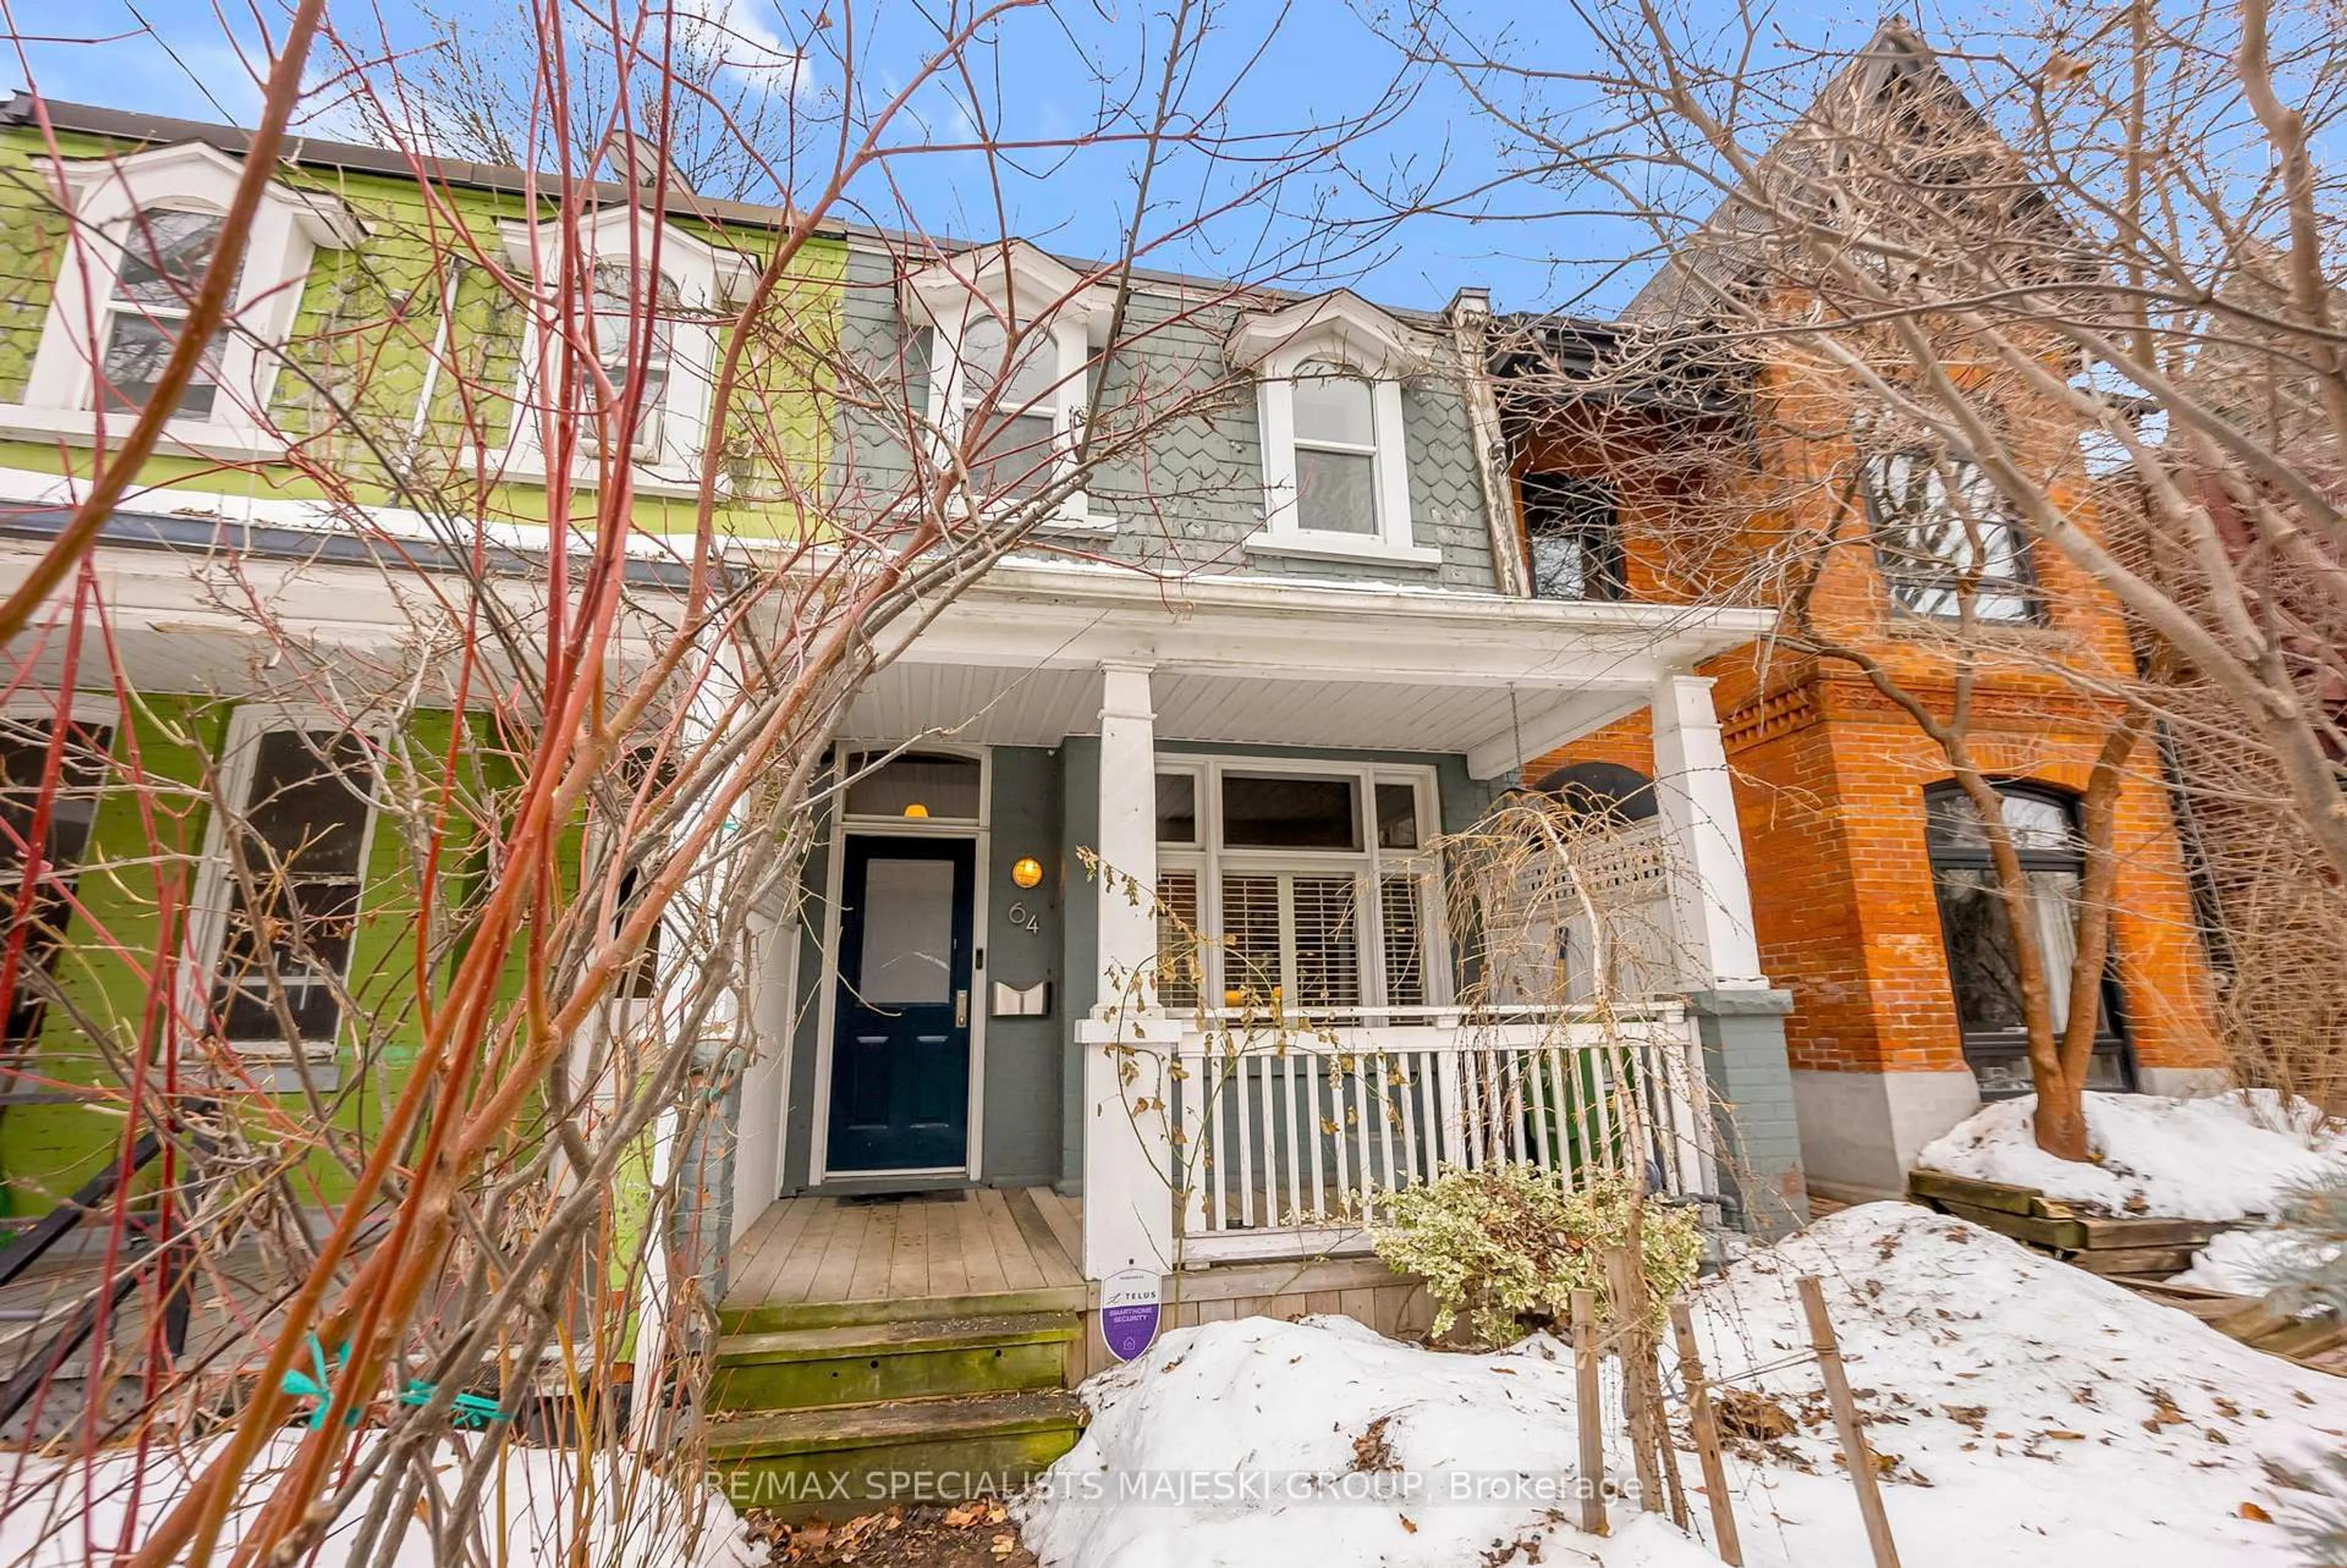
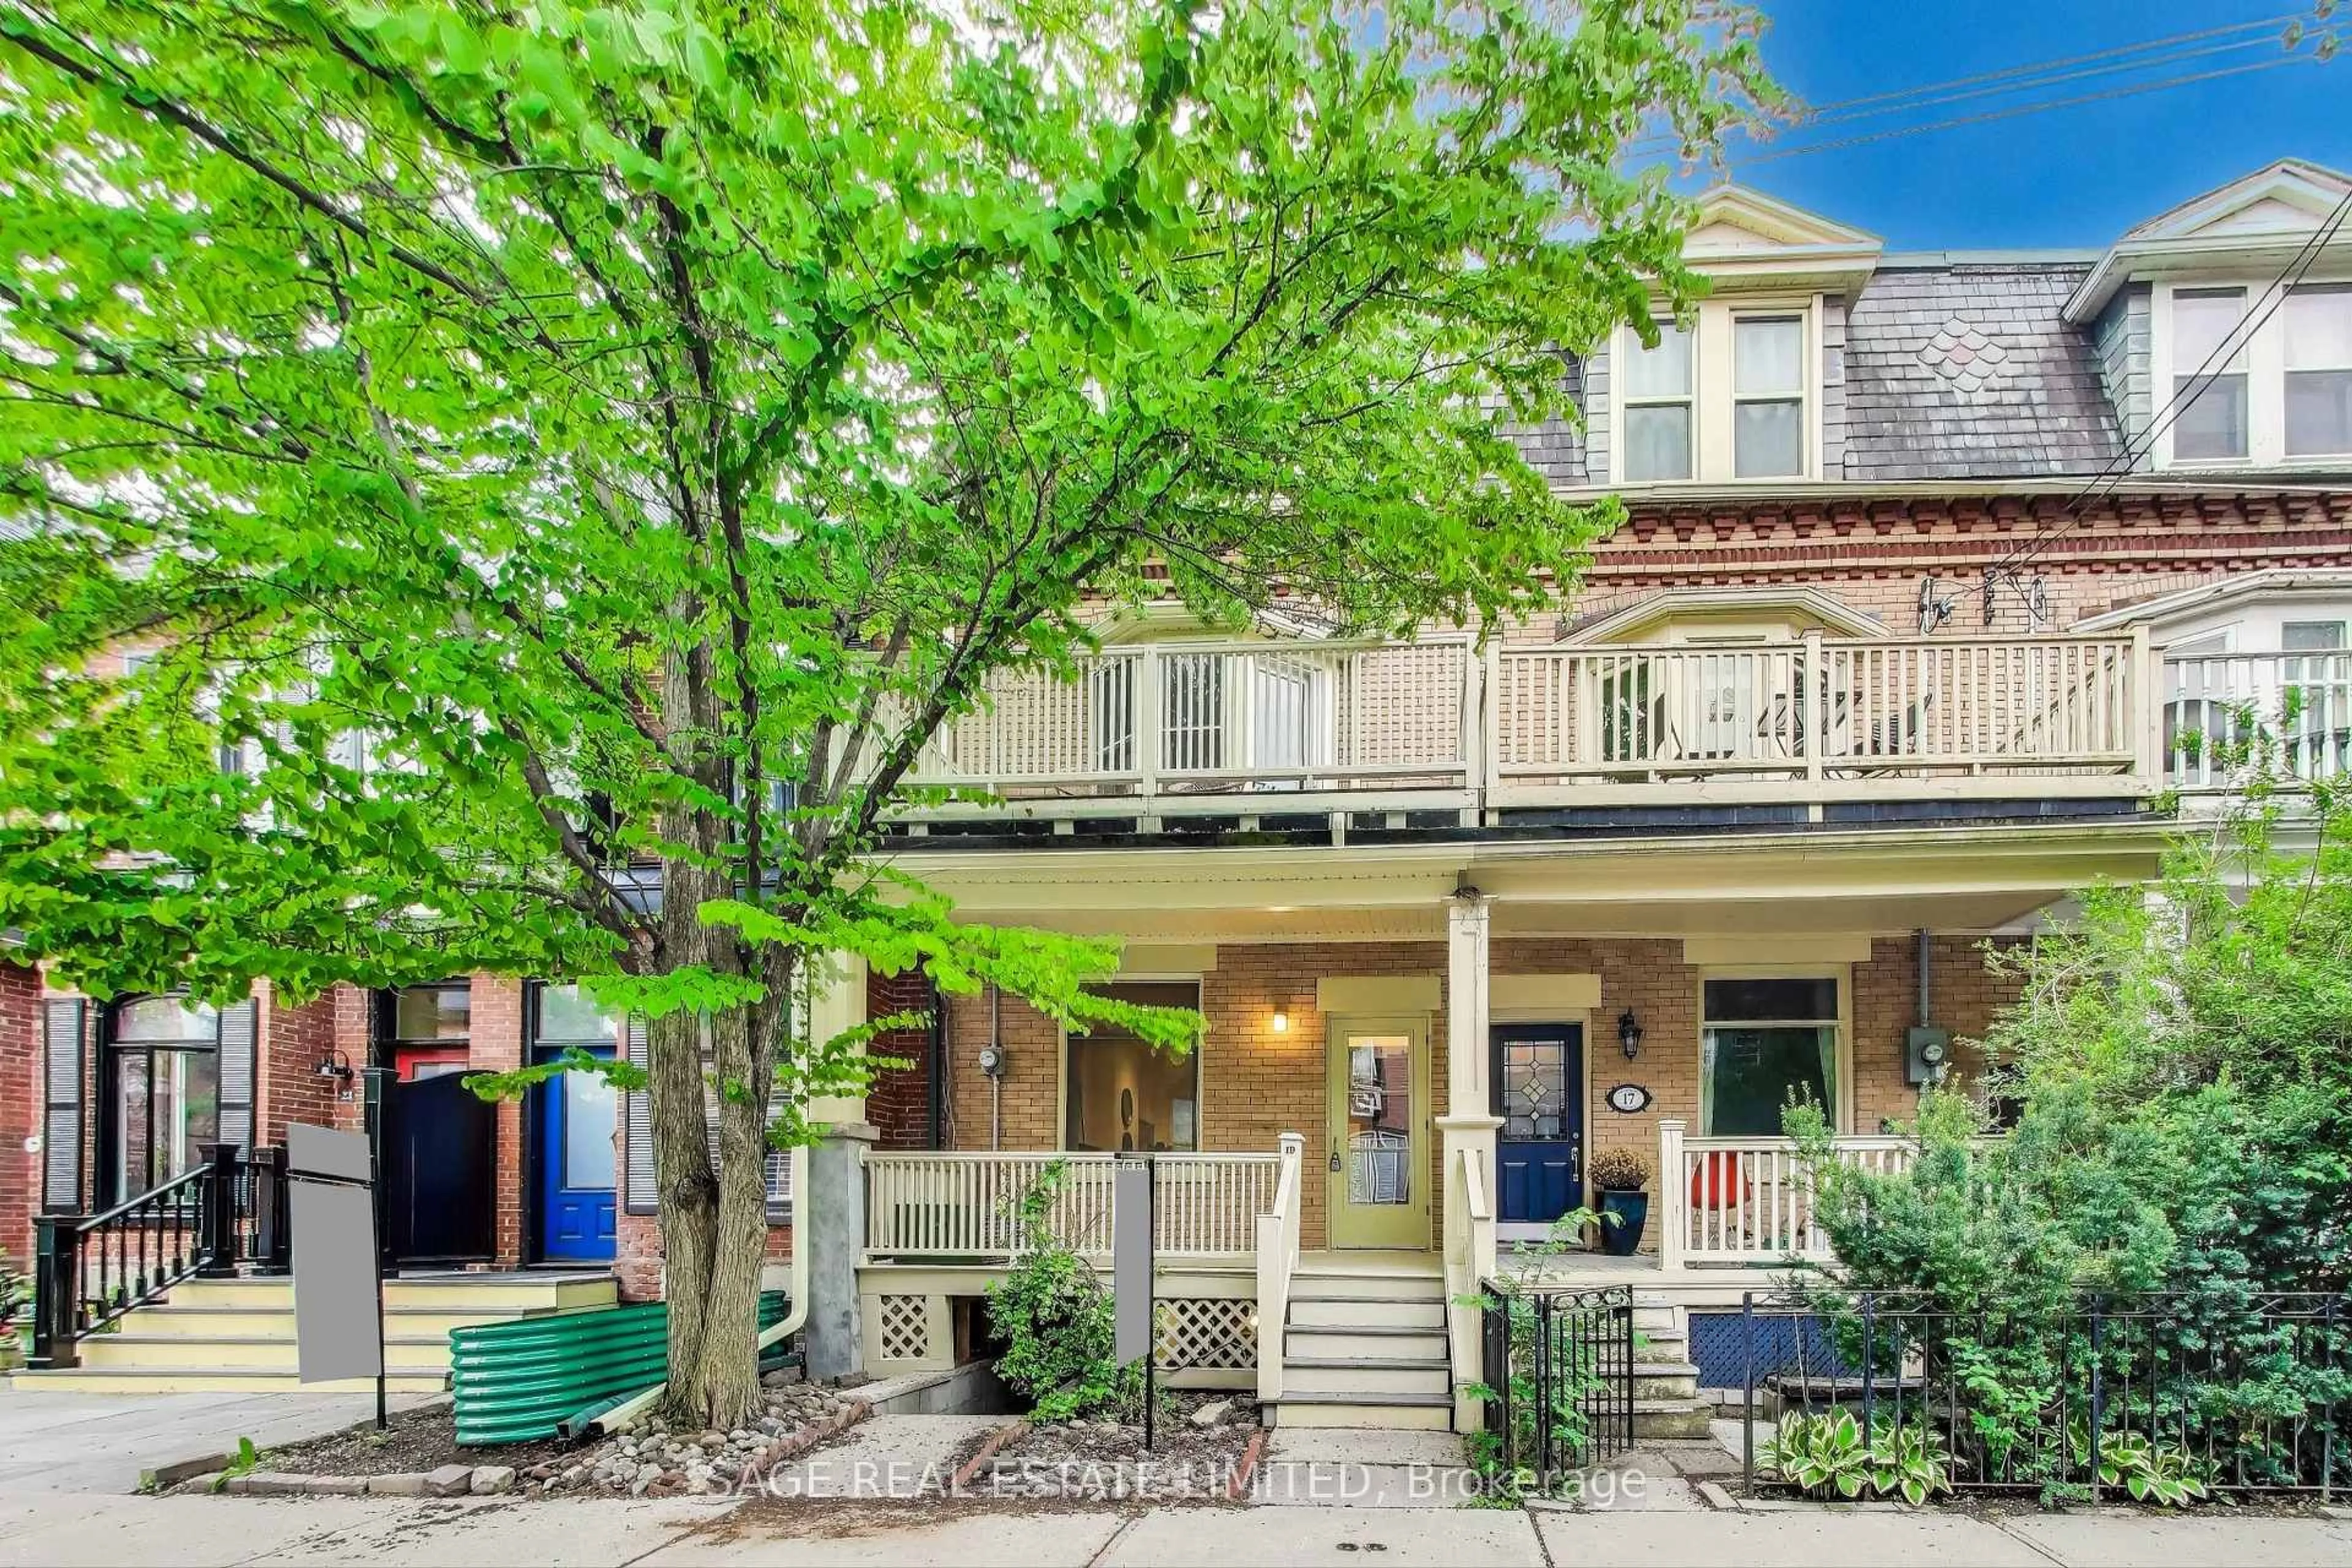
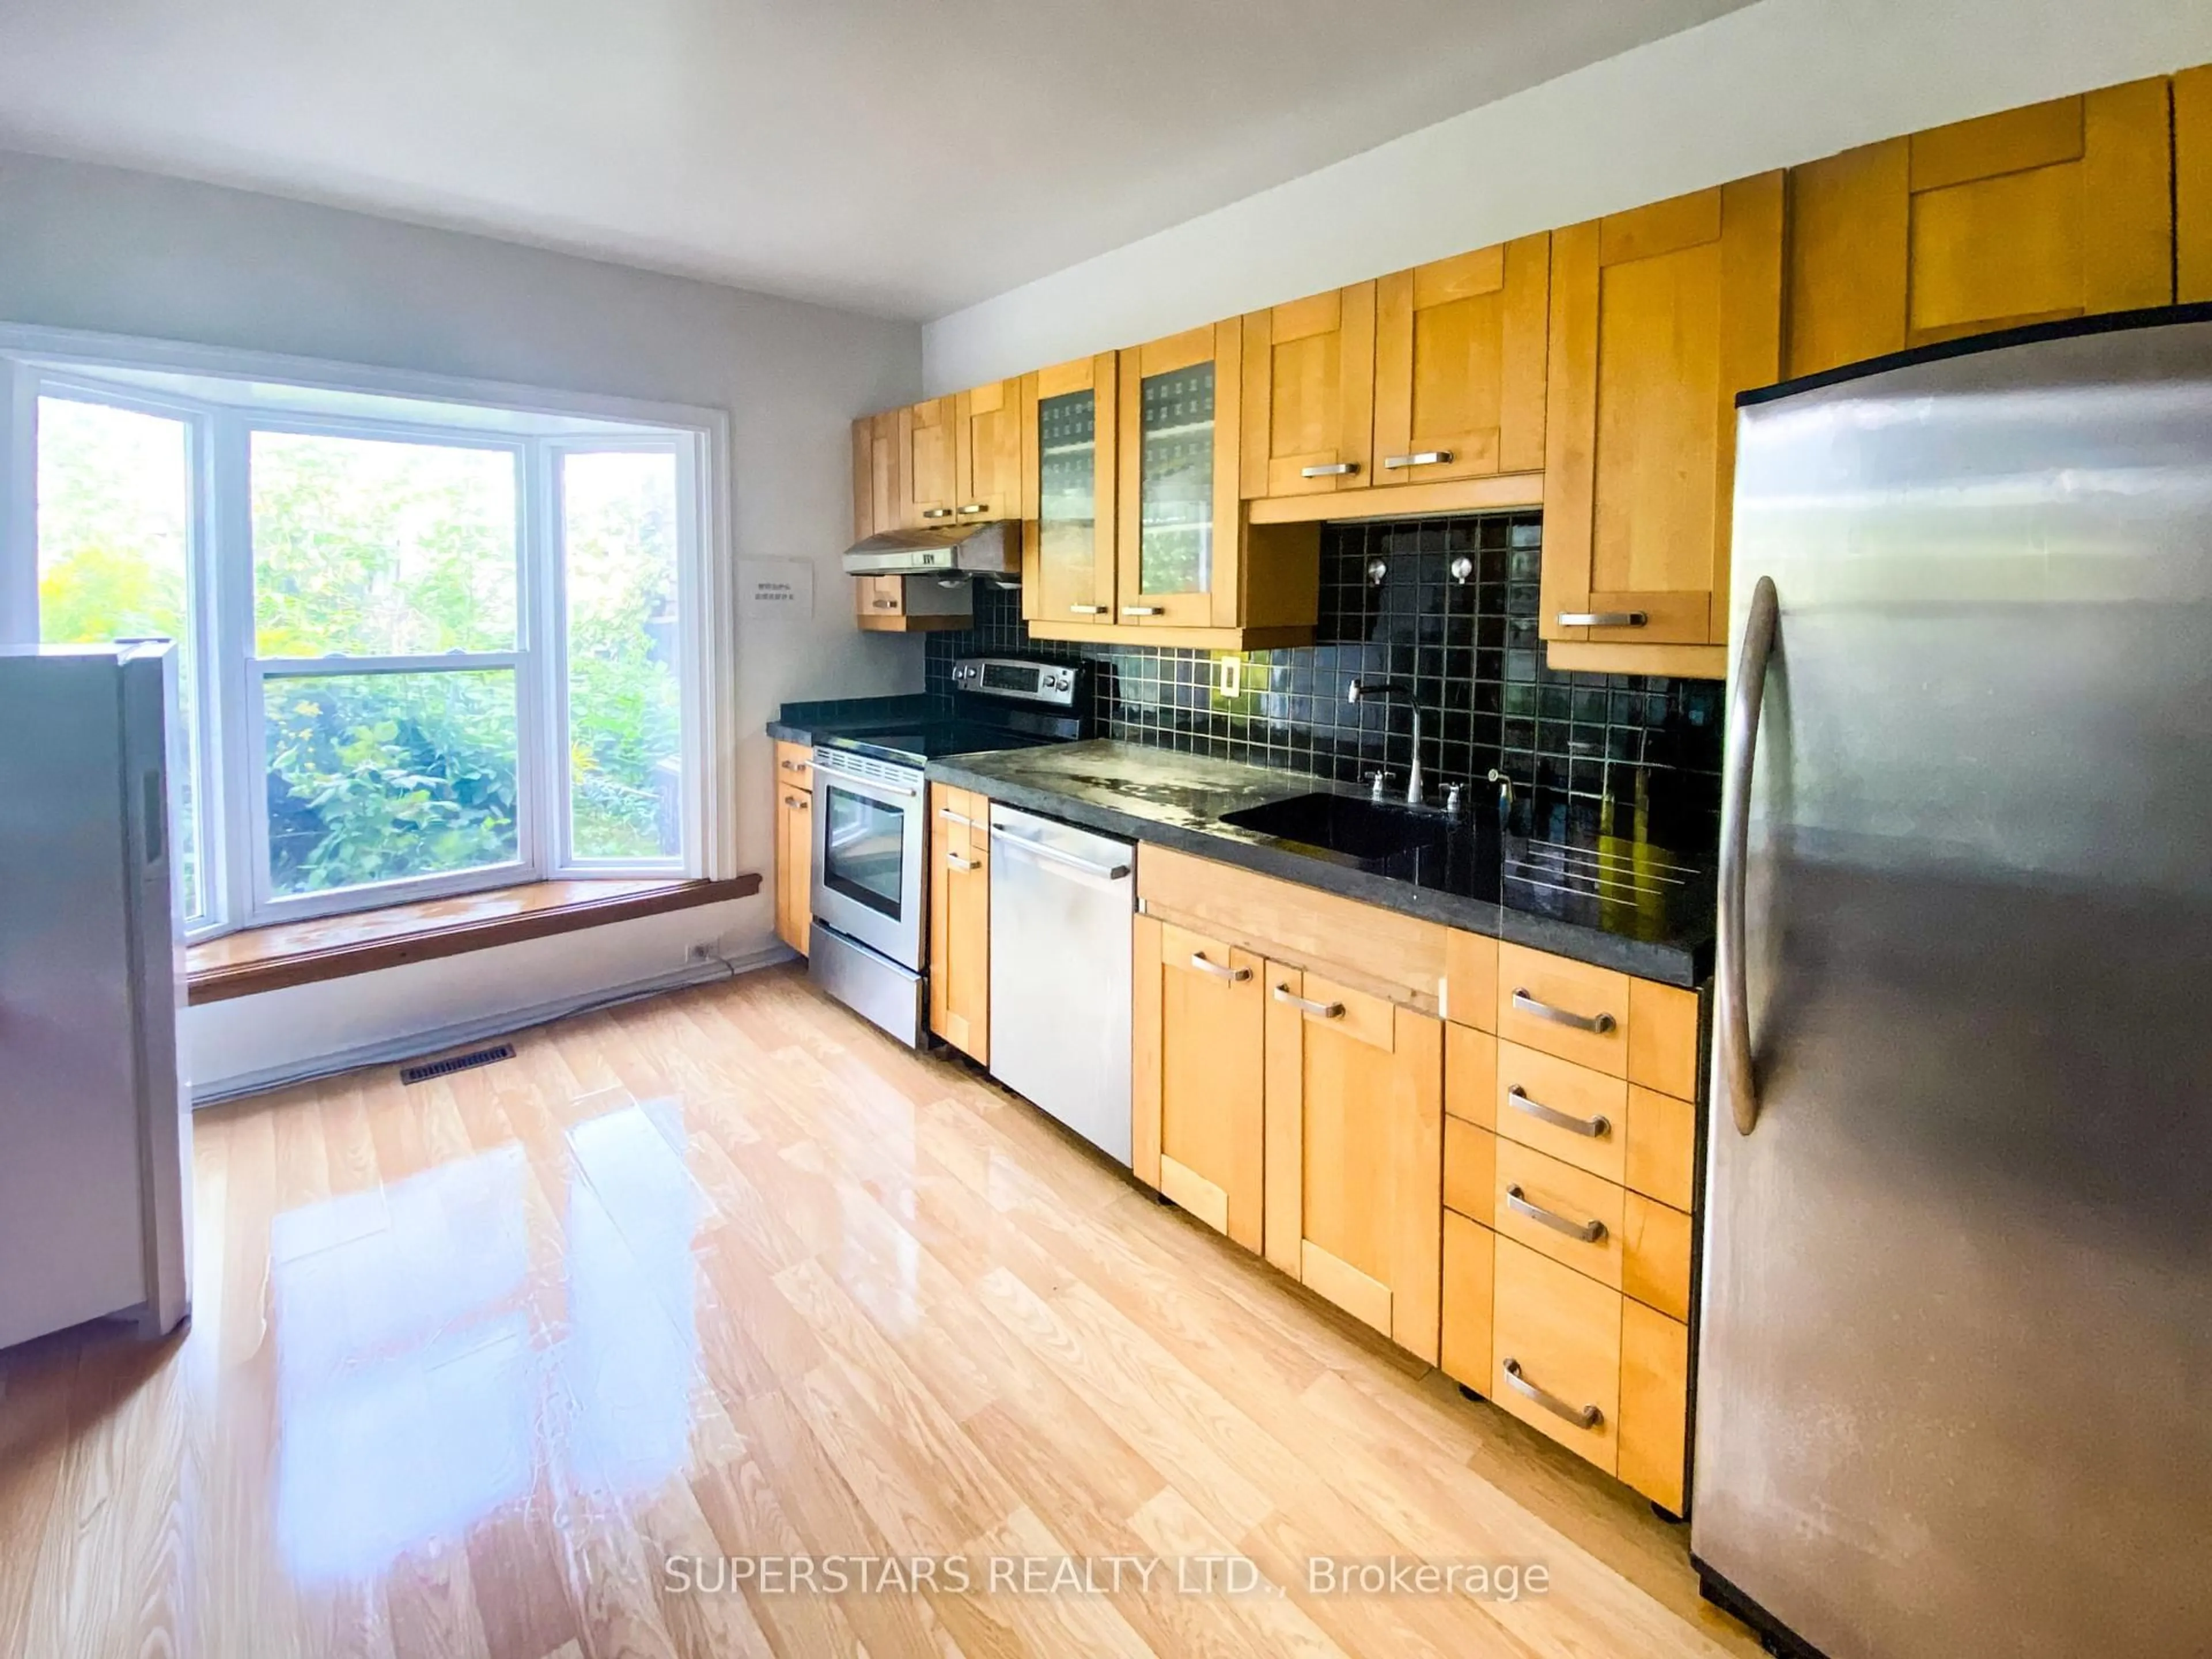
Fantastic Opportunity In Downtown Toronto! Spacious 5-Bedroom End Unit Townhouse, Like A Semi-detached, Located In A Prime Location With A Perfect Walk Score Of 100! Featuring Soaring 9+ Ft Ceiling On Main Floor. Updated Eat-In Kitchen With Stainless Steel Appliances, Backsplash, And Walk-Out To A Private Yard. Natural Light Floods In From The Skylight In The 2nd-Floor Hallway And Bathroom. Enjoy The Bonus Of Two Rear Parking Spots And An Updated Electrical Panel. Currently Generating Approx. $4,000/month In Rental Income. It's An Ideal Addition To Any Investor's Portfolio. Steps To Grange Park, OCAD, Queen West, Chinatown, And Art District.


Property Details

Style2-Storey
View-
Age of property-
SqFt~1100-1500 SqFt
Lot Size1,221 SqFt(82.58 x 14.79)
Parking Spaces2
MLS ®NumberC12307669
Community NameGrange Park
Data SourceTRREB
Listing bySUPERSTARS REALTY LTD.

Features

Heating: Forced Air
Cooling: Central Air
Basement: Part Fin

Bsmt Floor

Br

4.38 x 3.94

Tile Floor


Features

Lot size: 1,221 SqFt

Parking

Garage spaces -

Garage type -

Total parking spaces 2


Property History

Login required
Price changeActive
$•••,•••
Login required
Re-listed
$•••,•••
23 days on market
history photo preview3
Listing by trreb®

Market Data - Grange Park

Geo Zone Map ThumbnailGrange Park

Strong Seller's Market

View Market Data

Townhouse - for the past 30 days

Buyer's market Seller's market

Avg. Days on Market

Past 30 days

0 day

Compared to

2024

49 days

2023

6 days

2022

44 days

New Listings

Past 30 days

2 listings

Compared to

2024

4 listings

2023

3 listings

2022

1 listing

Units sold

Past 30 days

0 unit

Compared to

2024

1 unit

2023

1 unit

2022

1 unit

Median Sold Price

Past 30 days

$0

Compared to

2024

$900,000

2023

$1,471,000

2022

$825,000


Population and Demographics

Overview

Total population 11328
Average household income $127,317

Age (%)

0 to 19
9%
20 to 34
48%
35 to 49
18%
50 to 64
13%
65 and plus
12%

Household composition (%)

Single person
55%
Single family
31%
Multi person
14%
Multi family
0%

Mother tongue (%)

English
57%
Mandarin
14%
Yue (Cantonese)
10%
Spanish
3%
French
2%
Arabic
2%
Korean
2%
Tagalog (Pilipino, Filipino)
1%
Vietnamese
1%
Others
1%

House tenancy (%)

Renters
68%
Owners
32%

What’s nearby?Essentials within 5 km

Local Logic

Transportation Scores

Estimated Budget