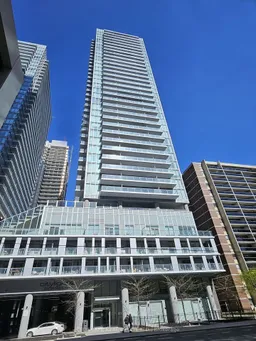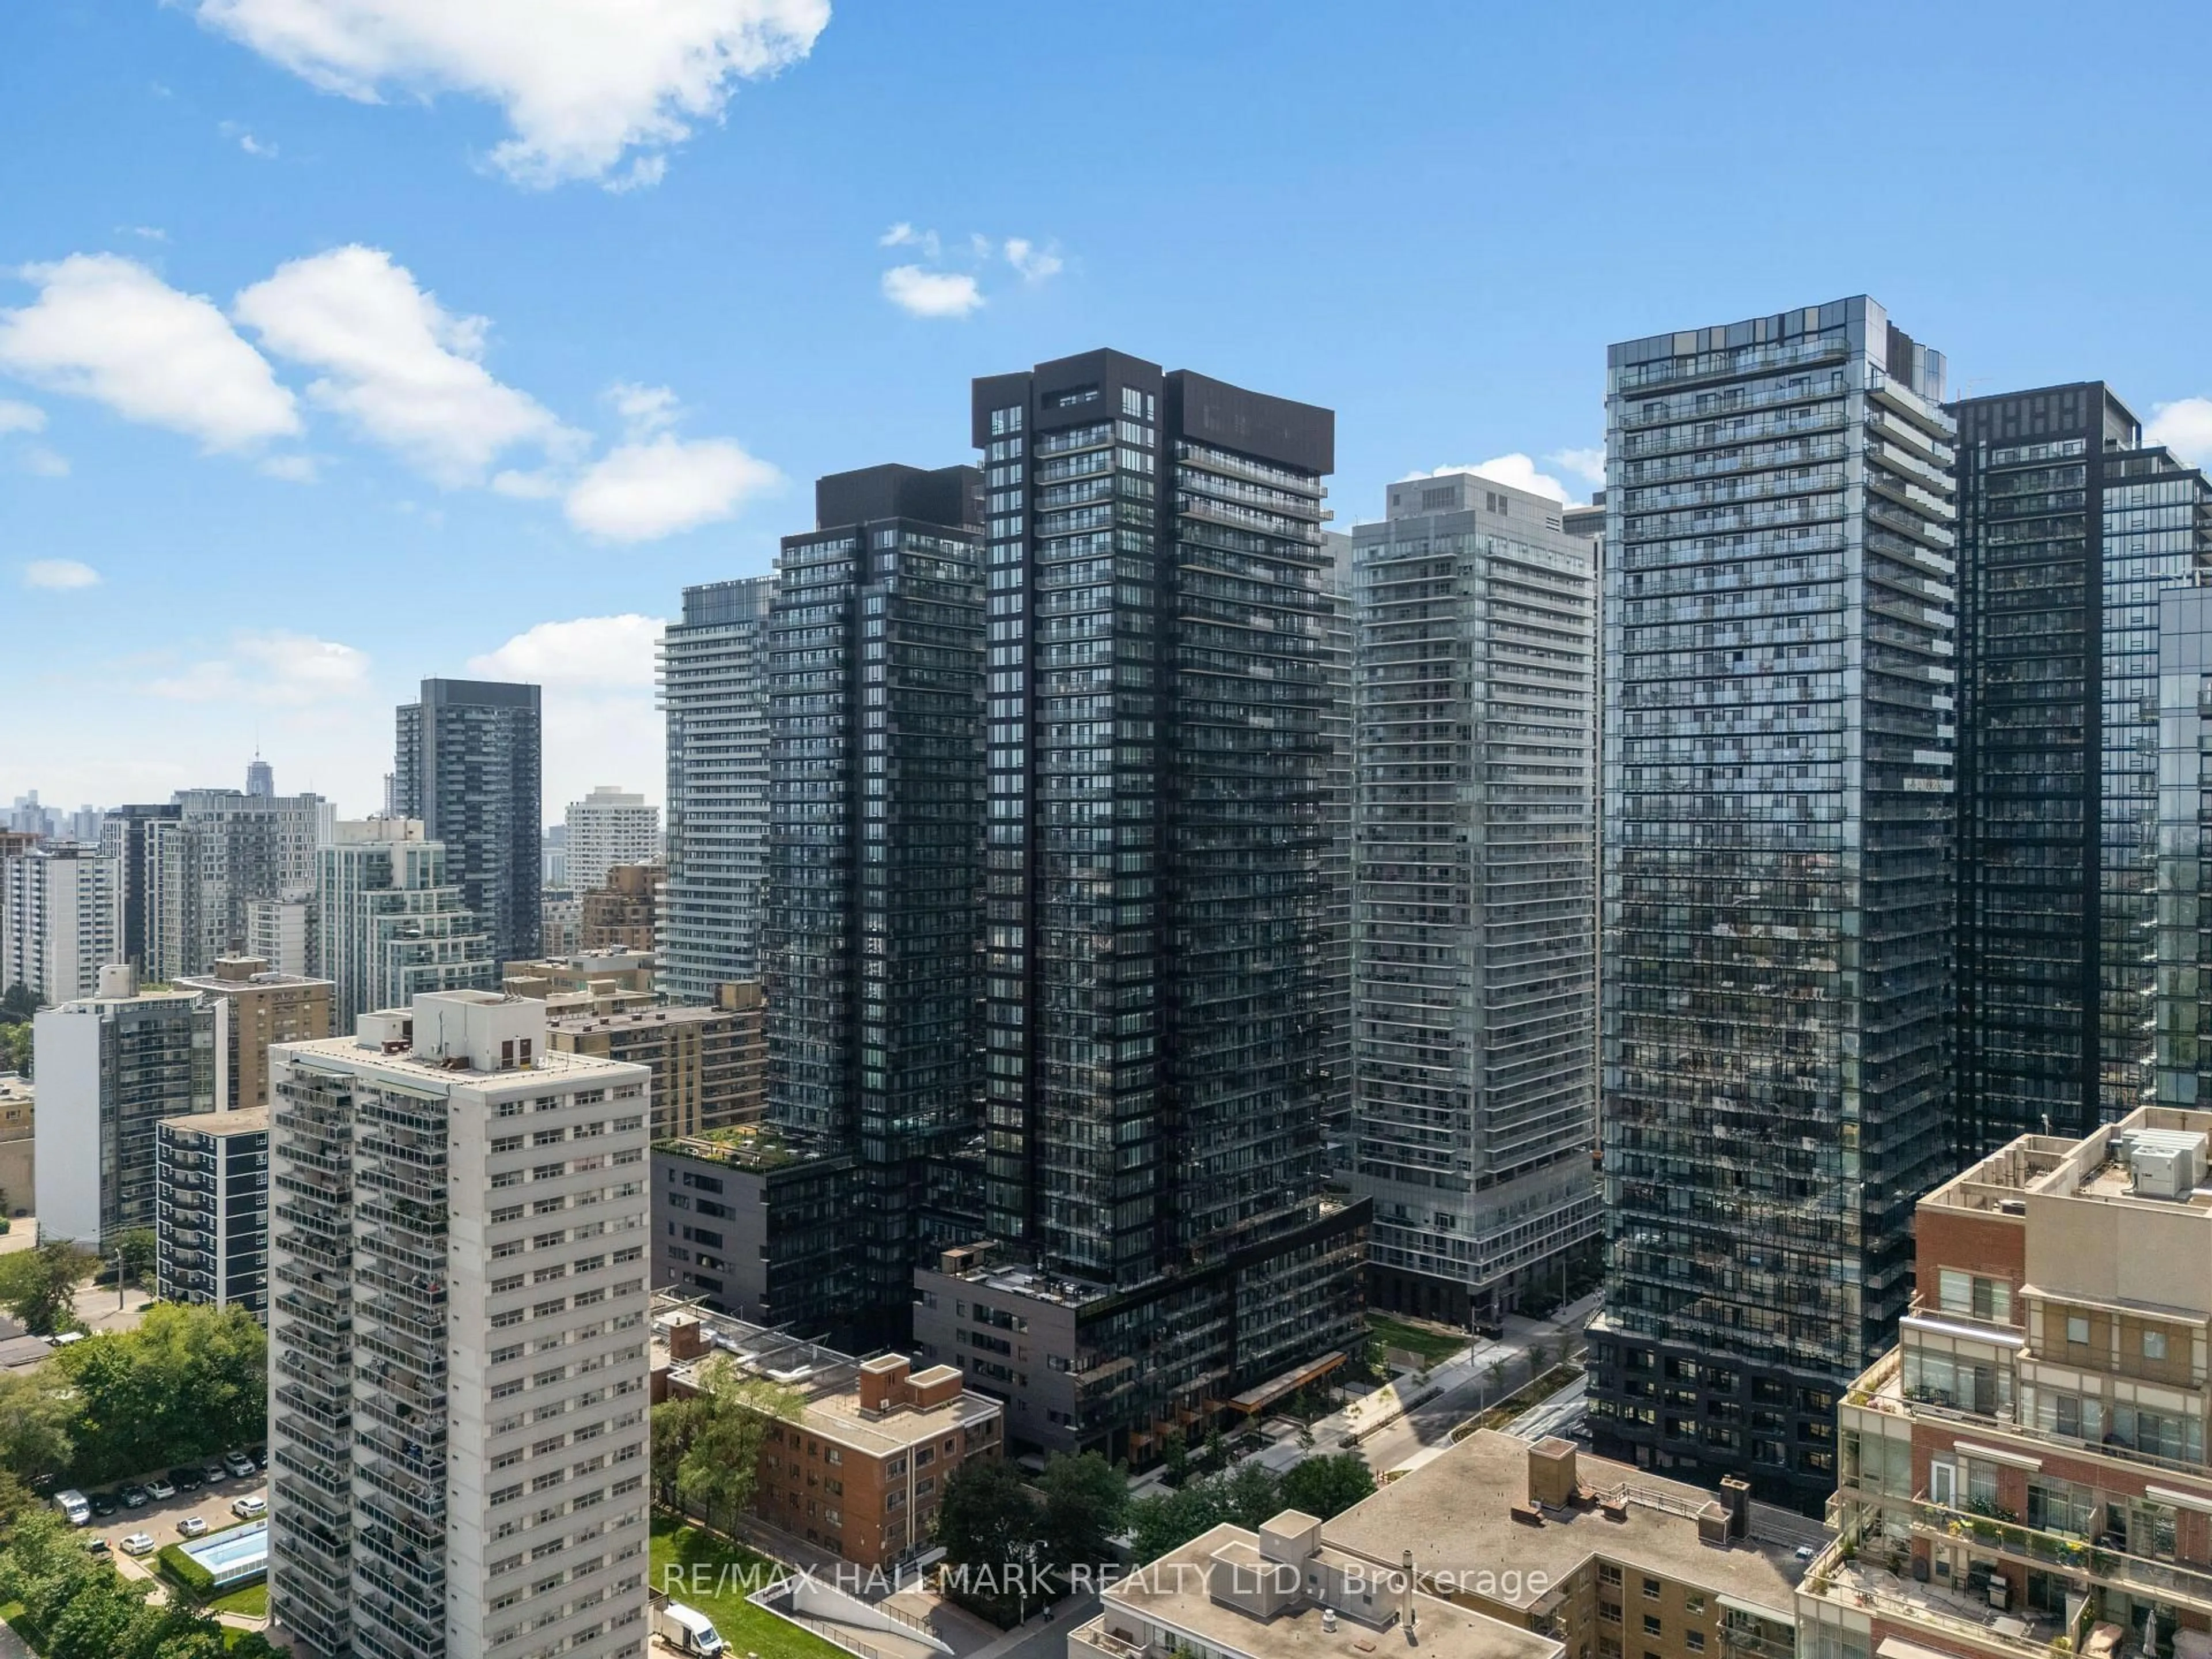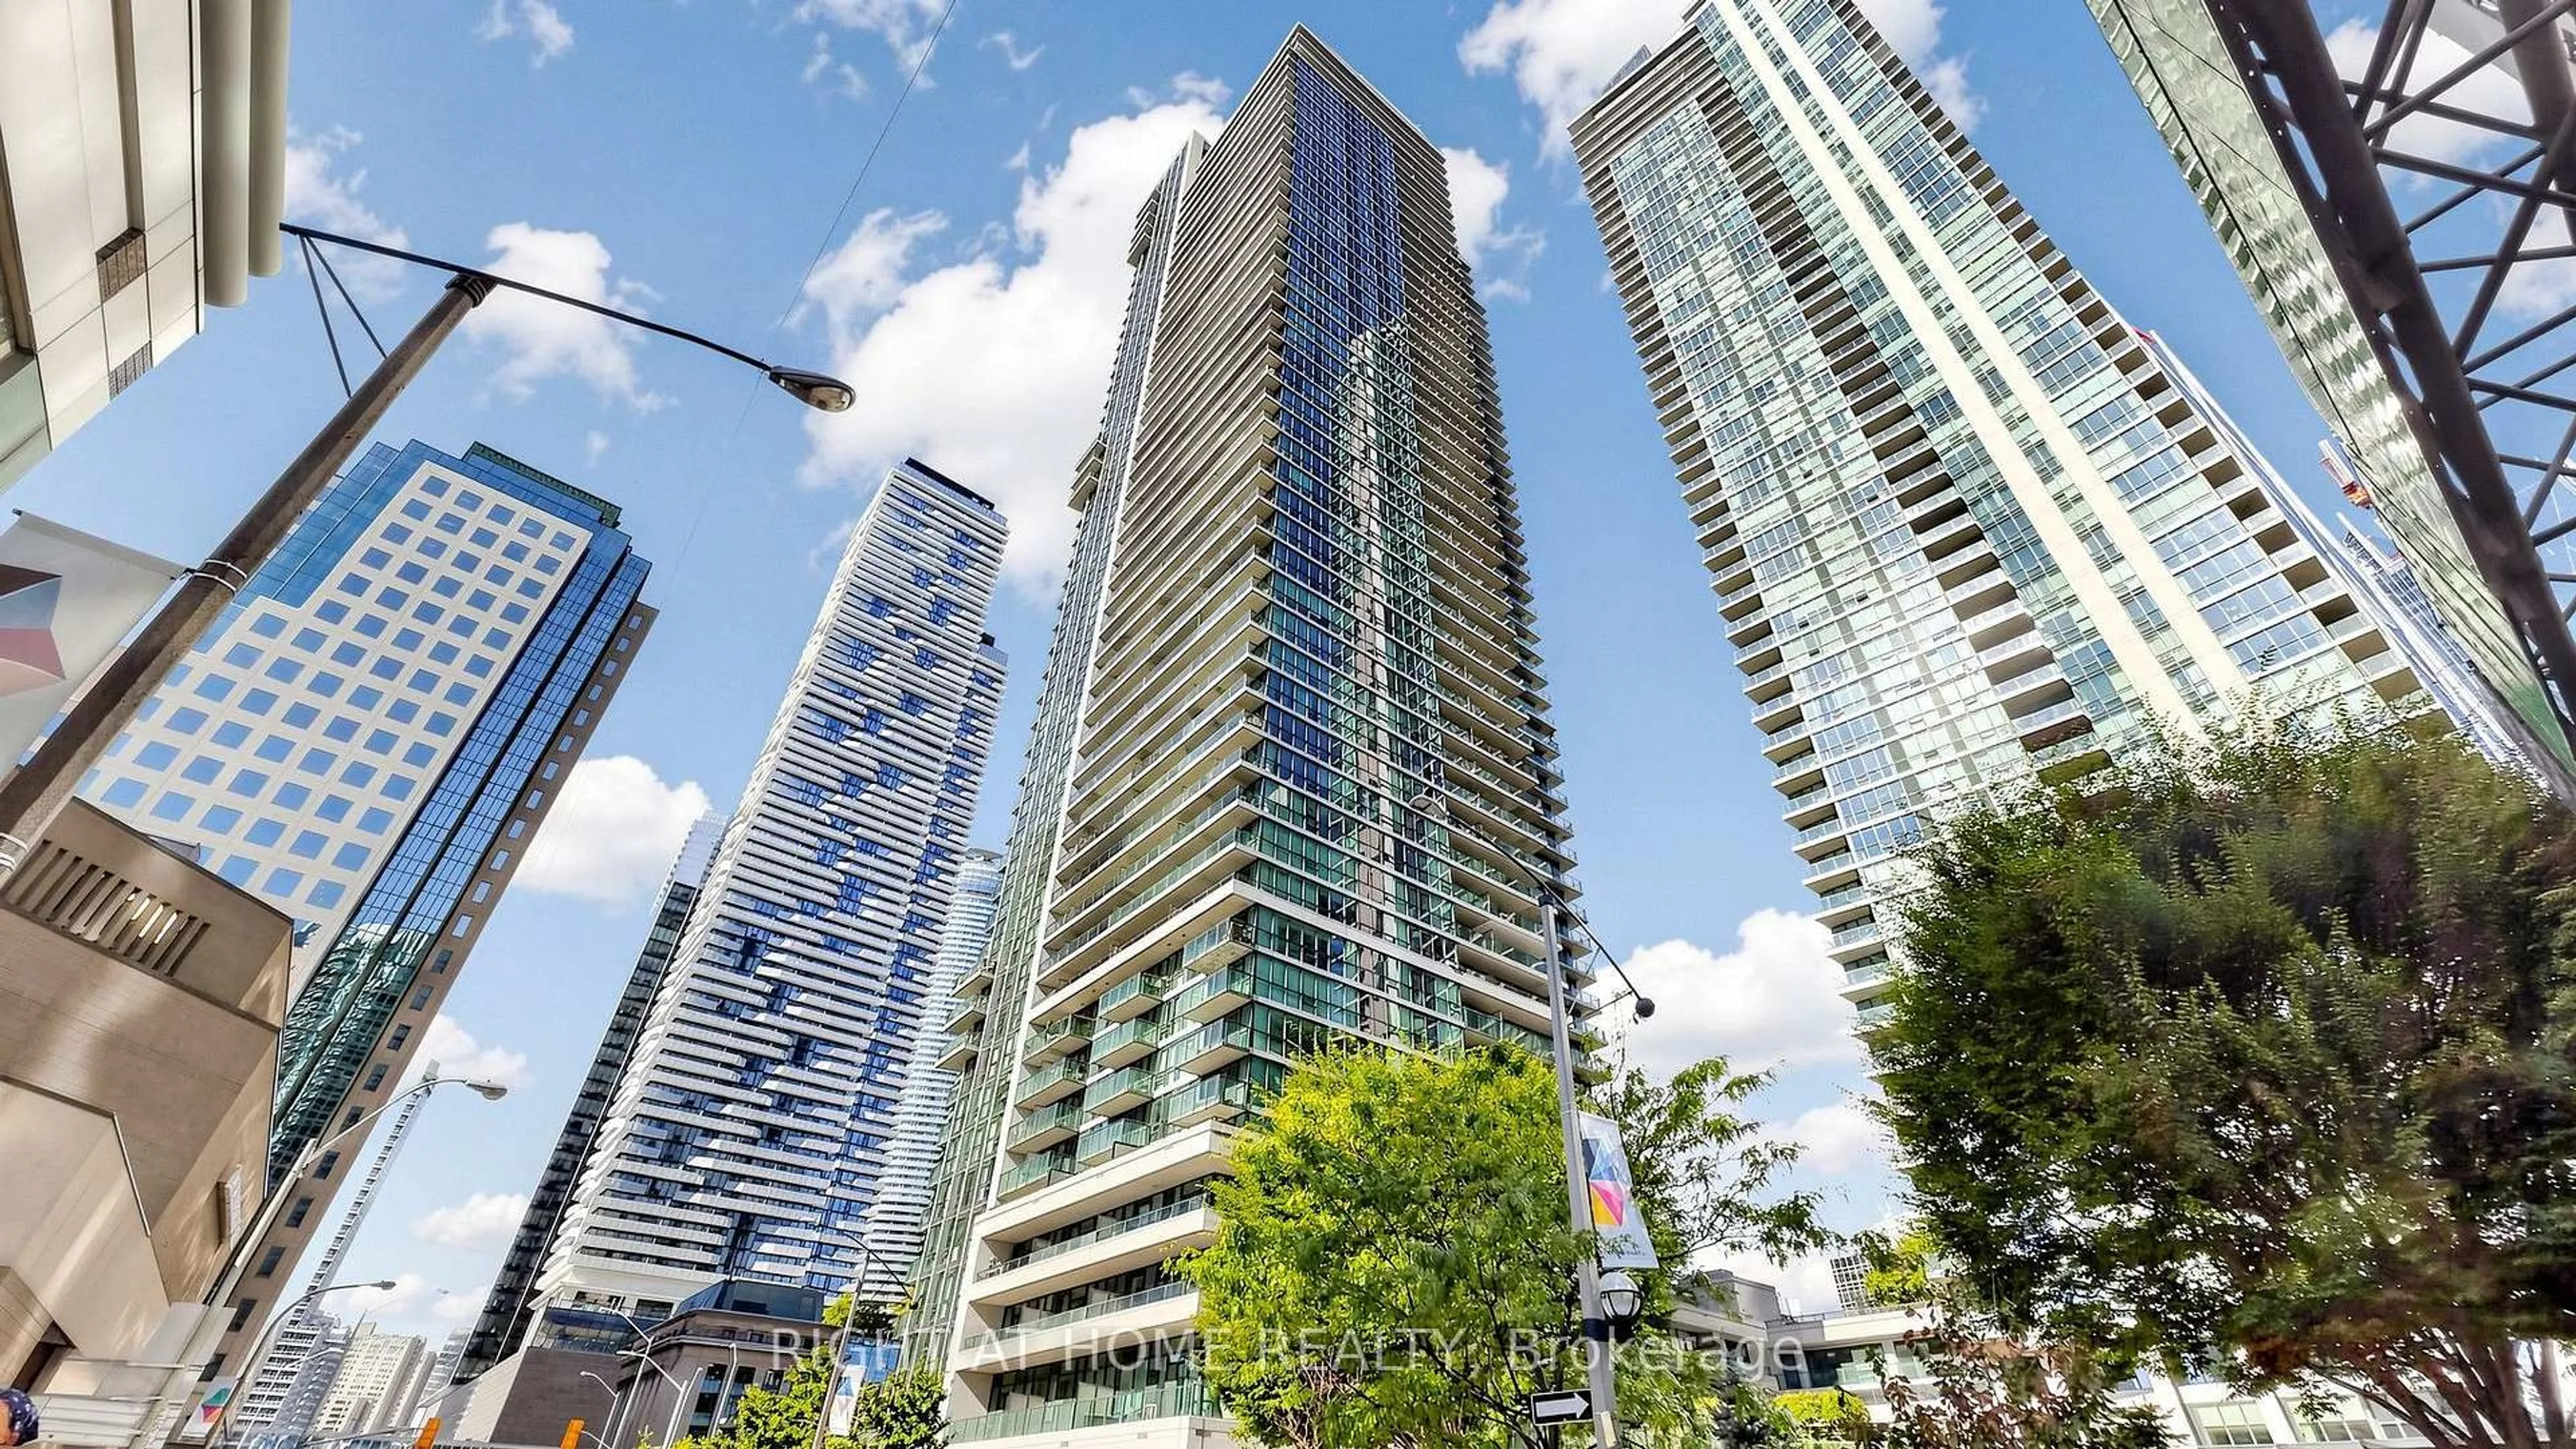
195 Redpath Ave #3501, Toronto, Ontario M4P 0E4
Contact us about this property
Highlights
Estimated valueThis is the price Wahi expects this property to sell for.
The calculation is powered by our Instant Home Value Estimate, which uses current market and property price trends to estimate your home’s value with a 90% accuracy rate.Not available
Price/Sqft$860/sqft
Monthly cost
Open Calculator
Description
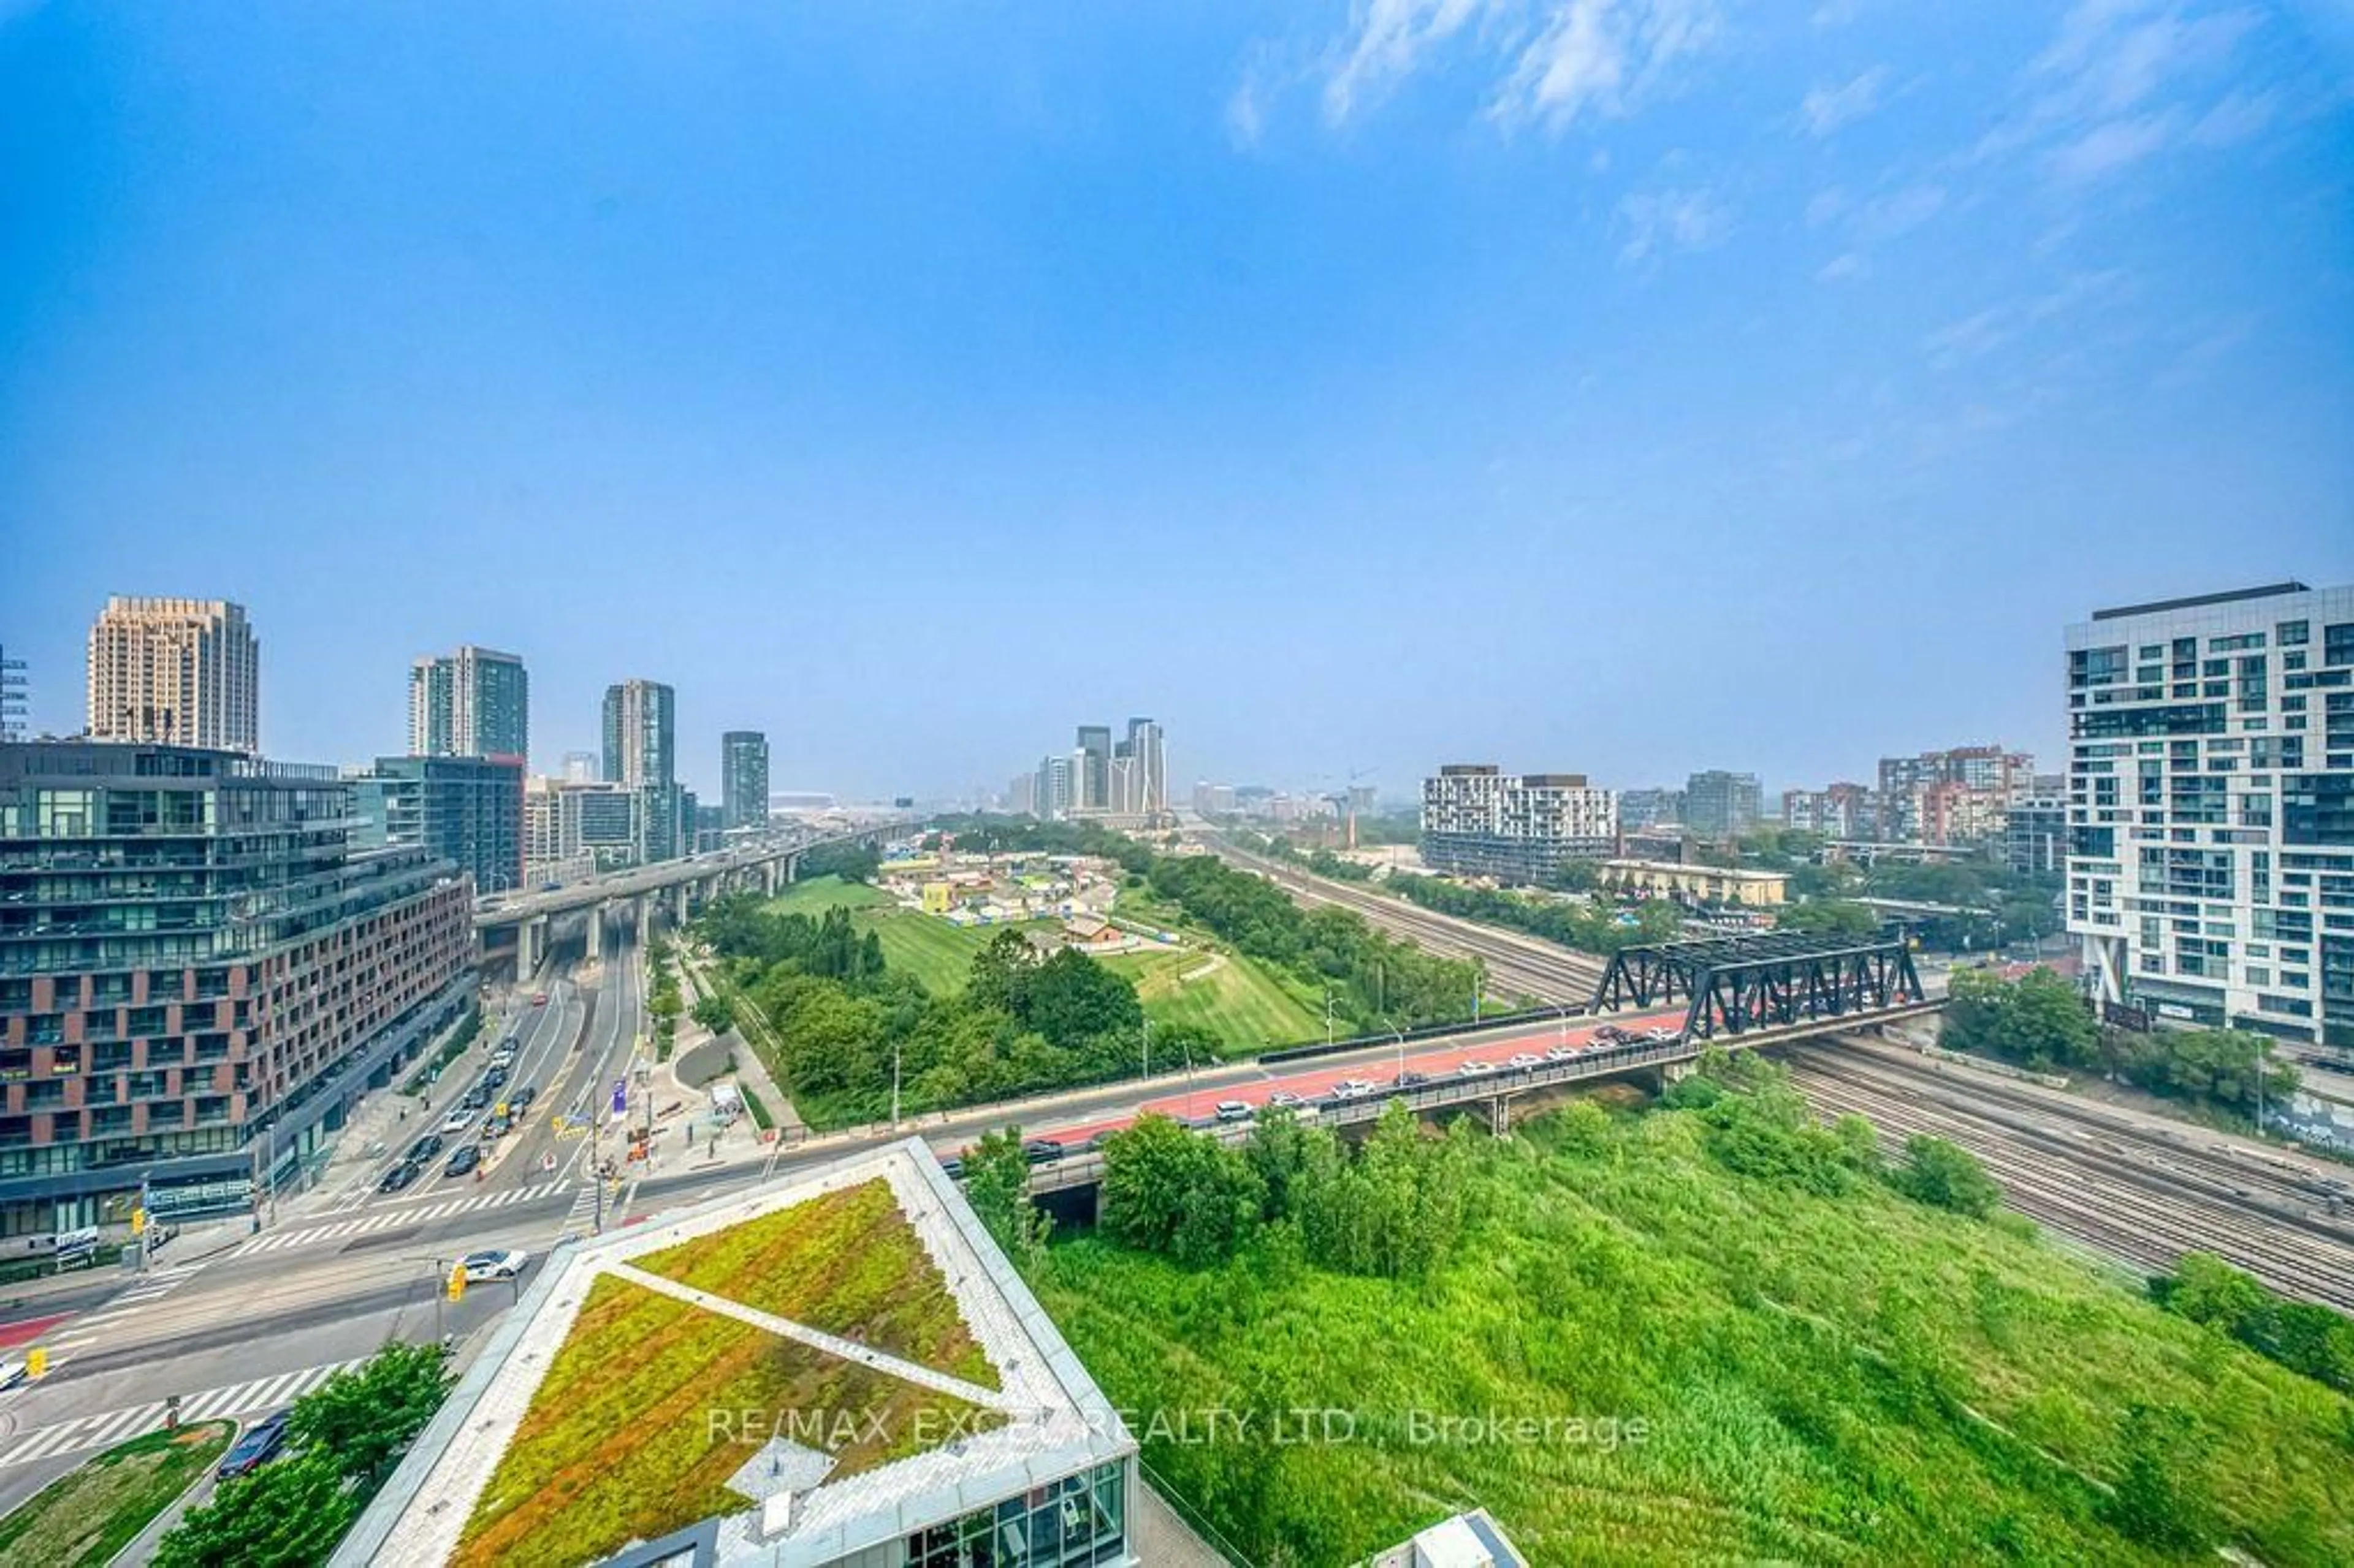
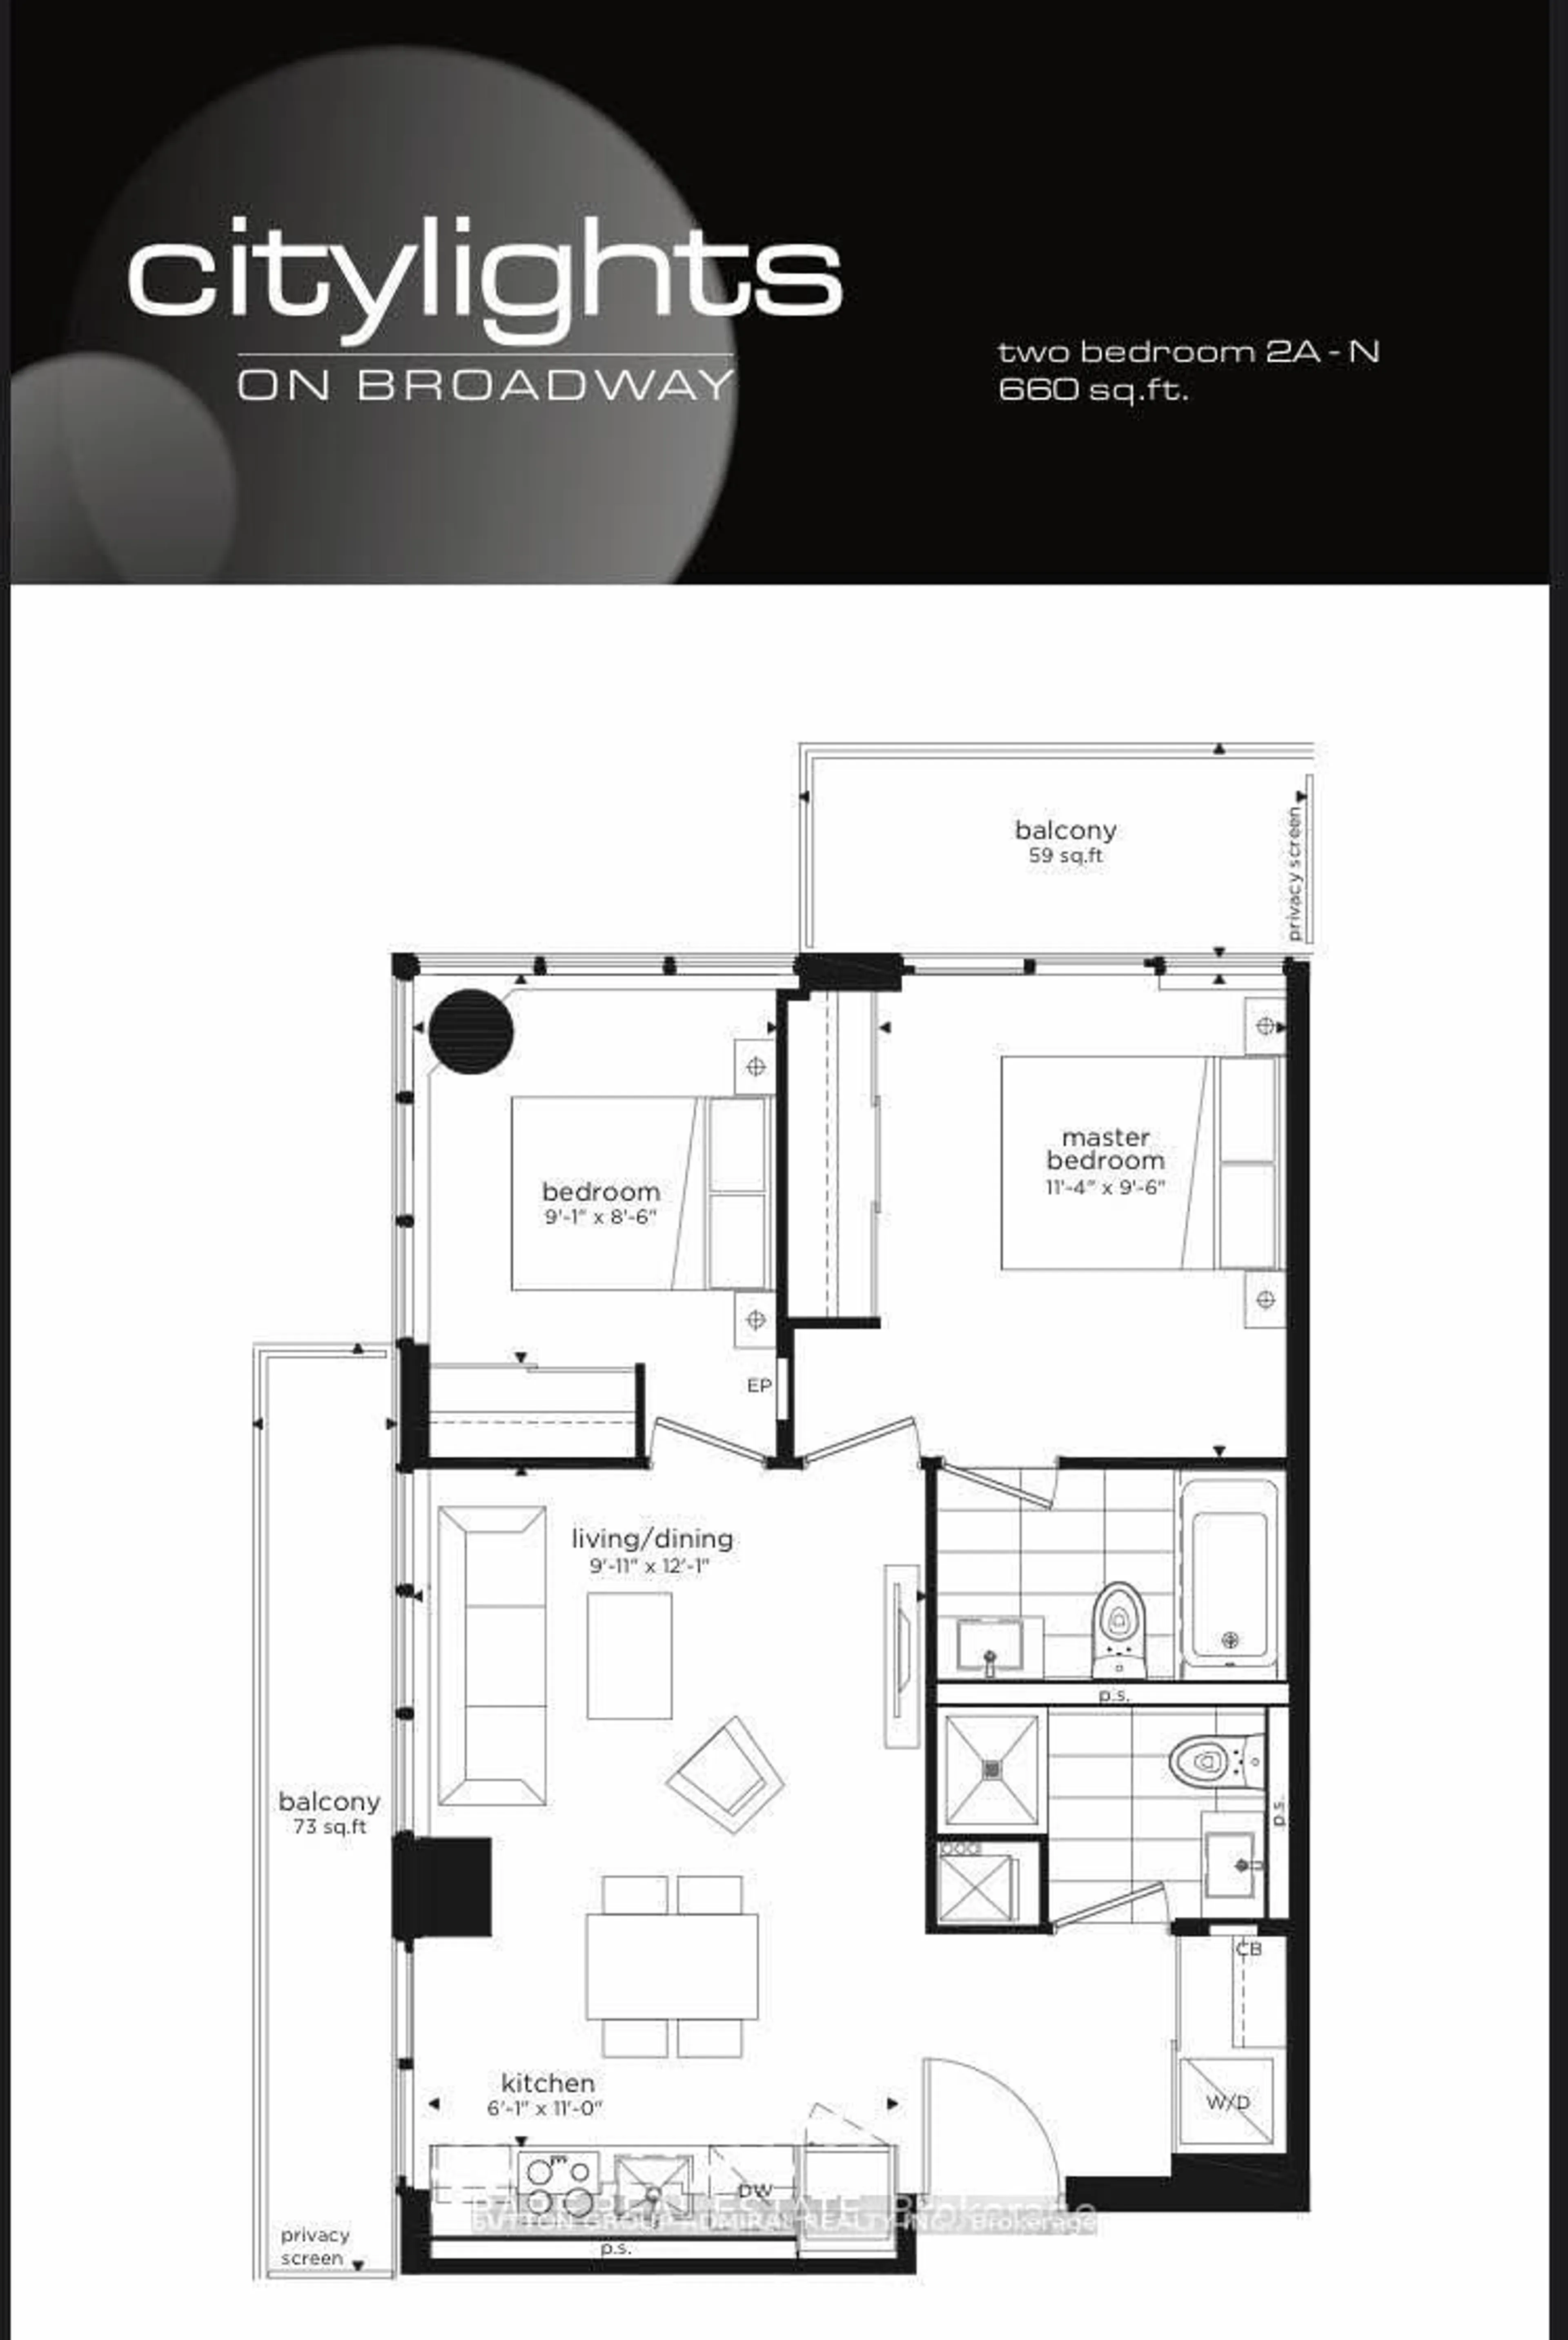
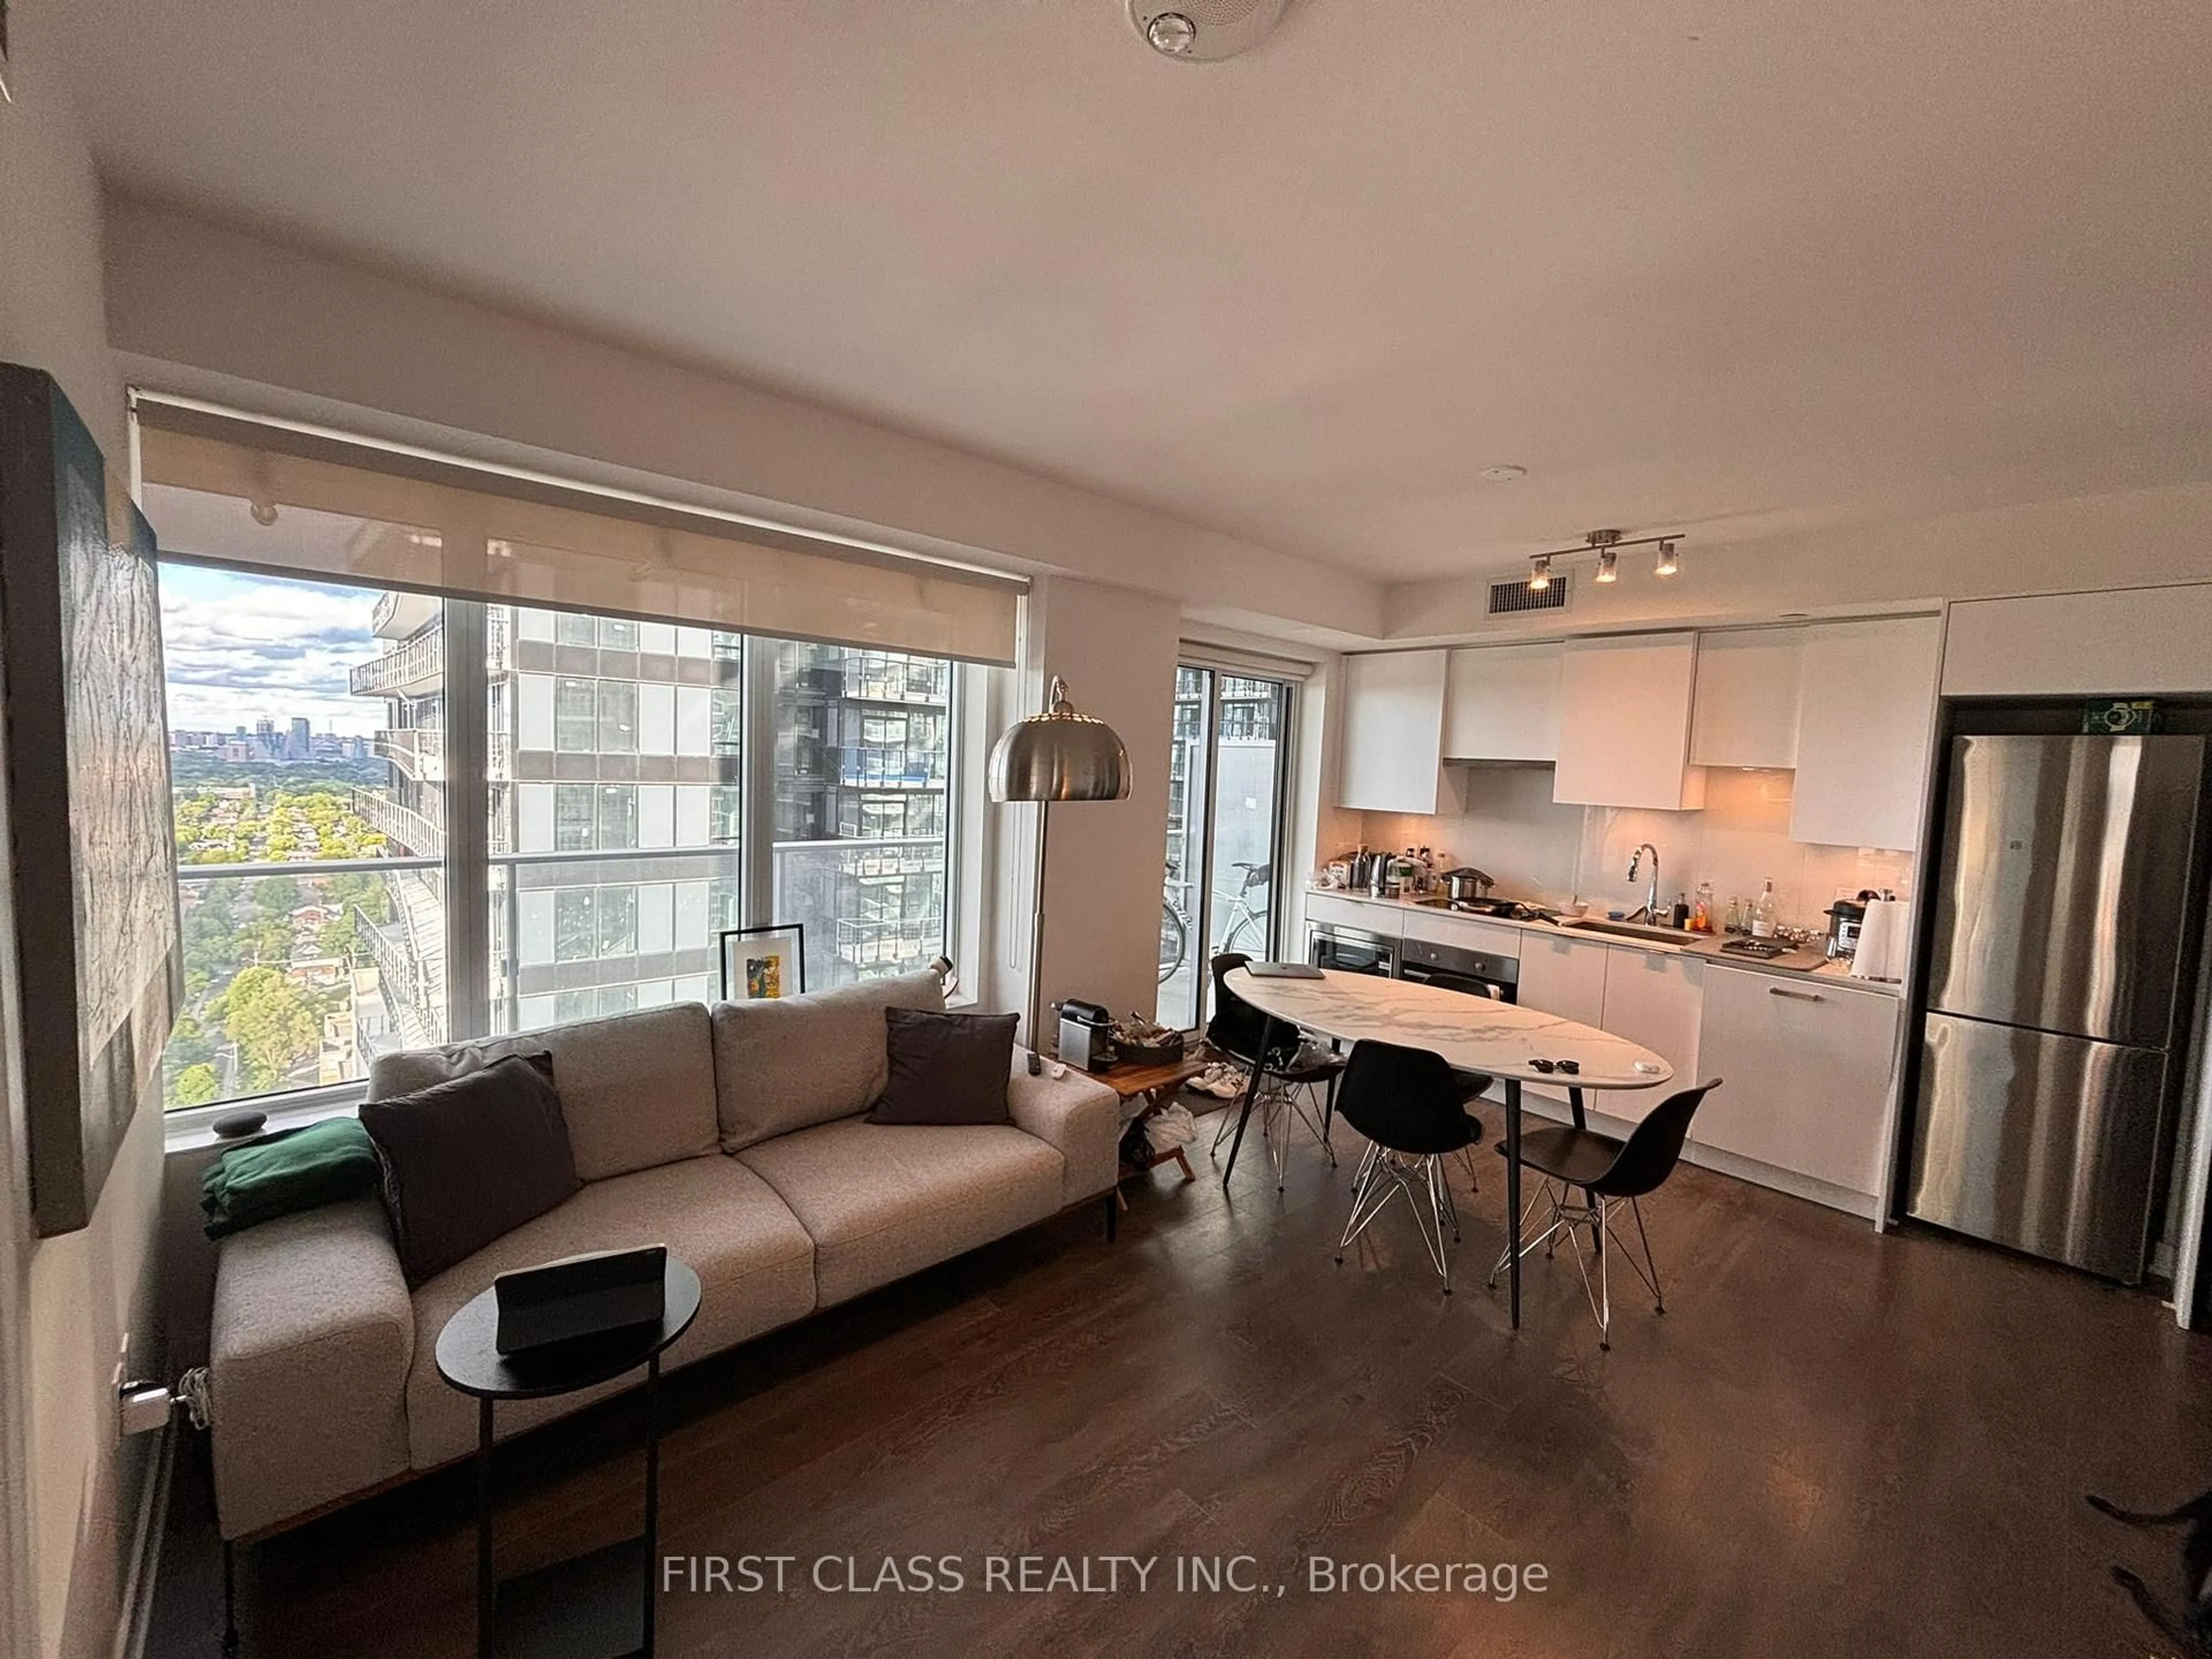
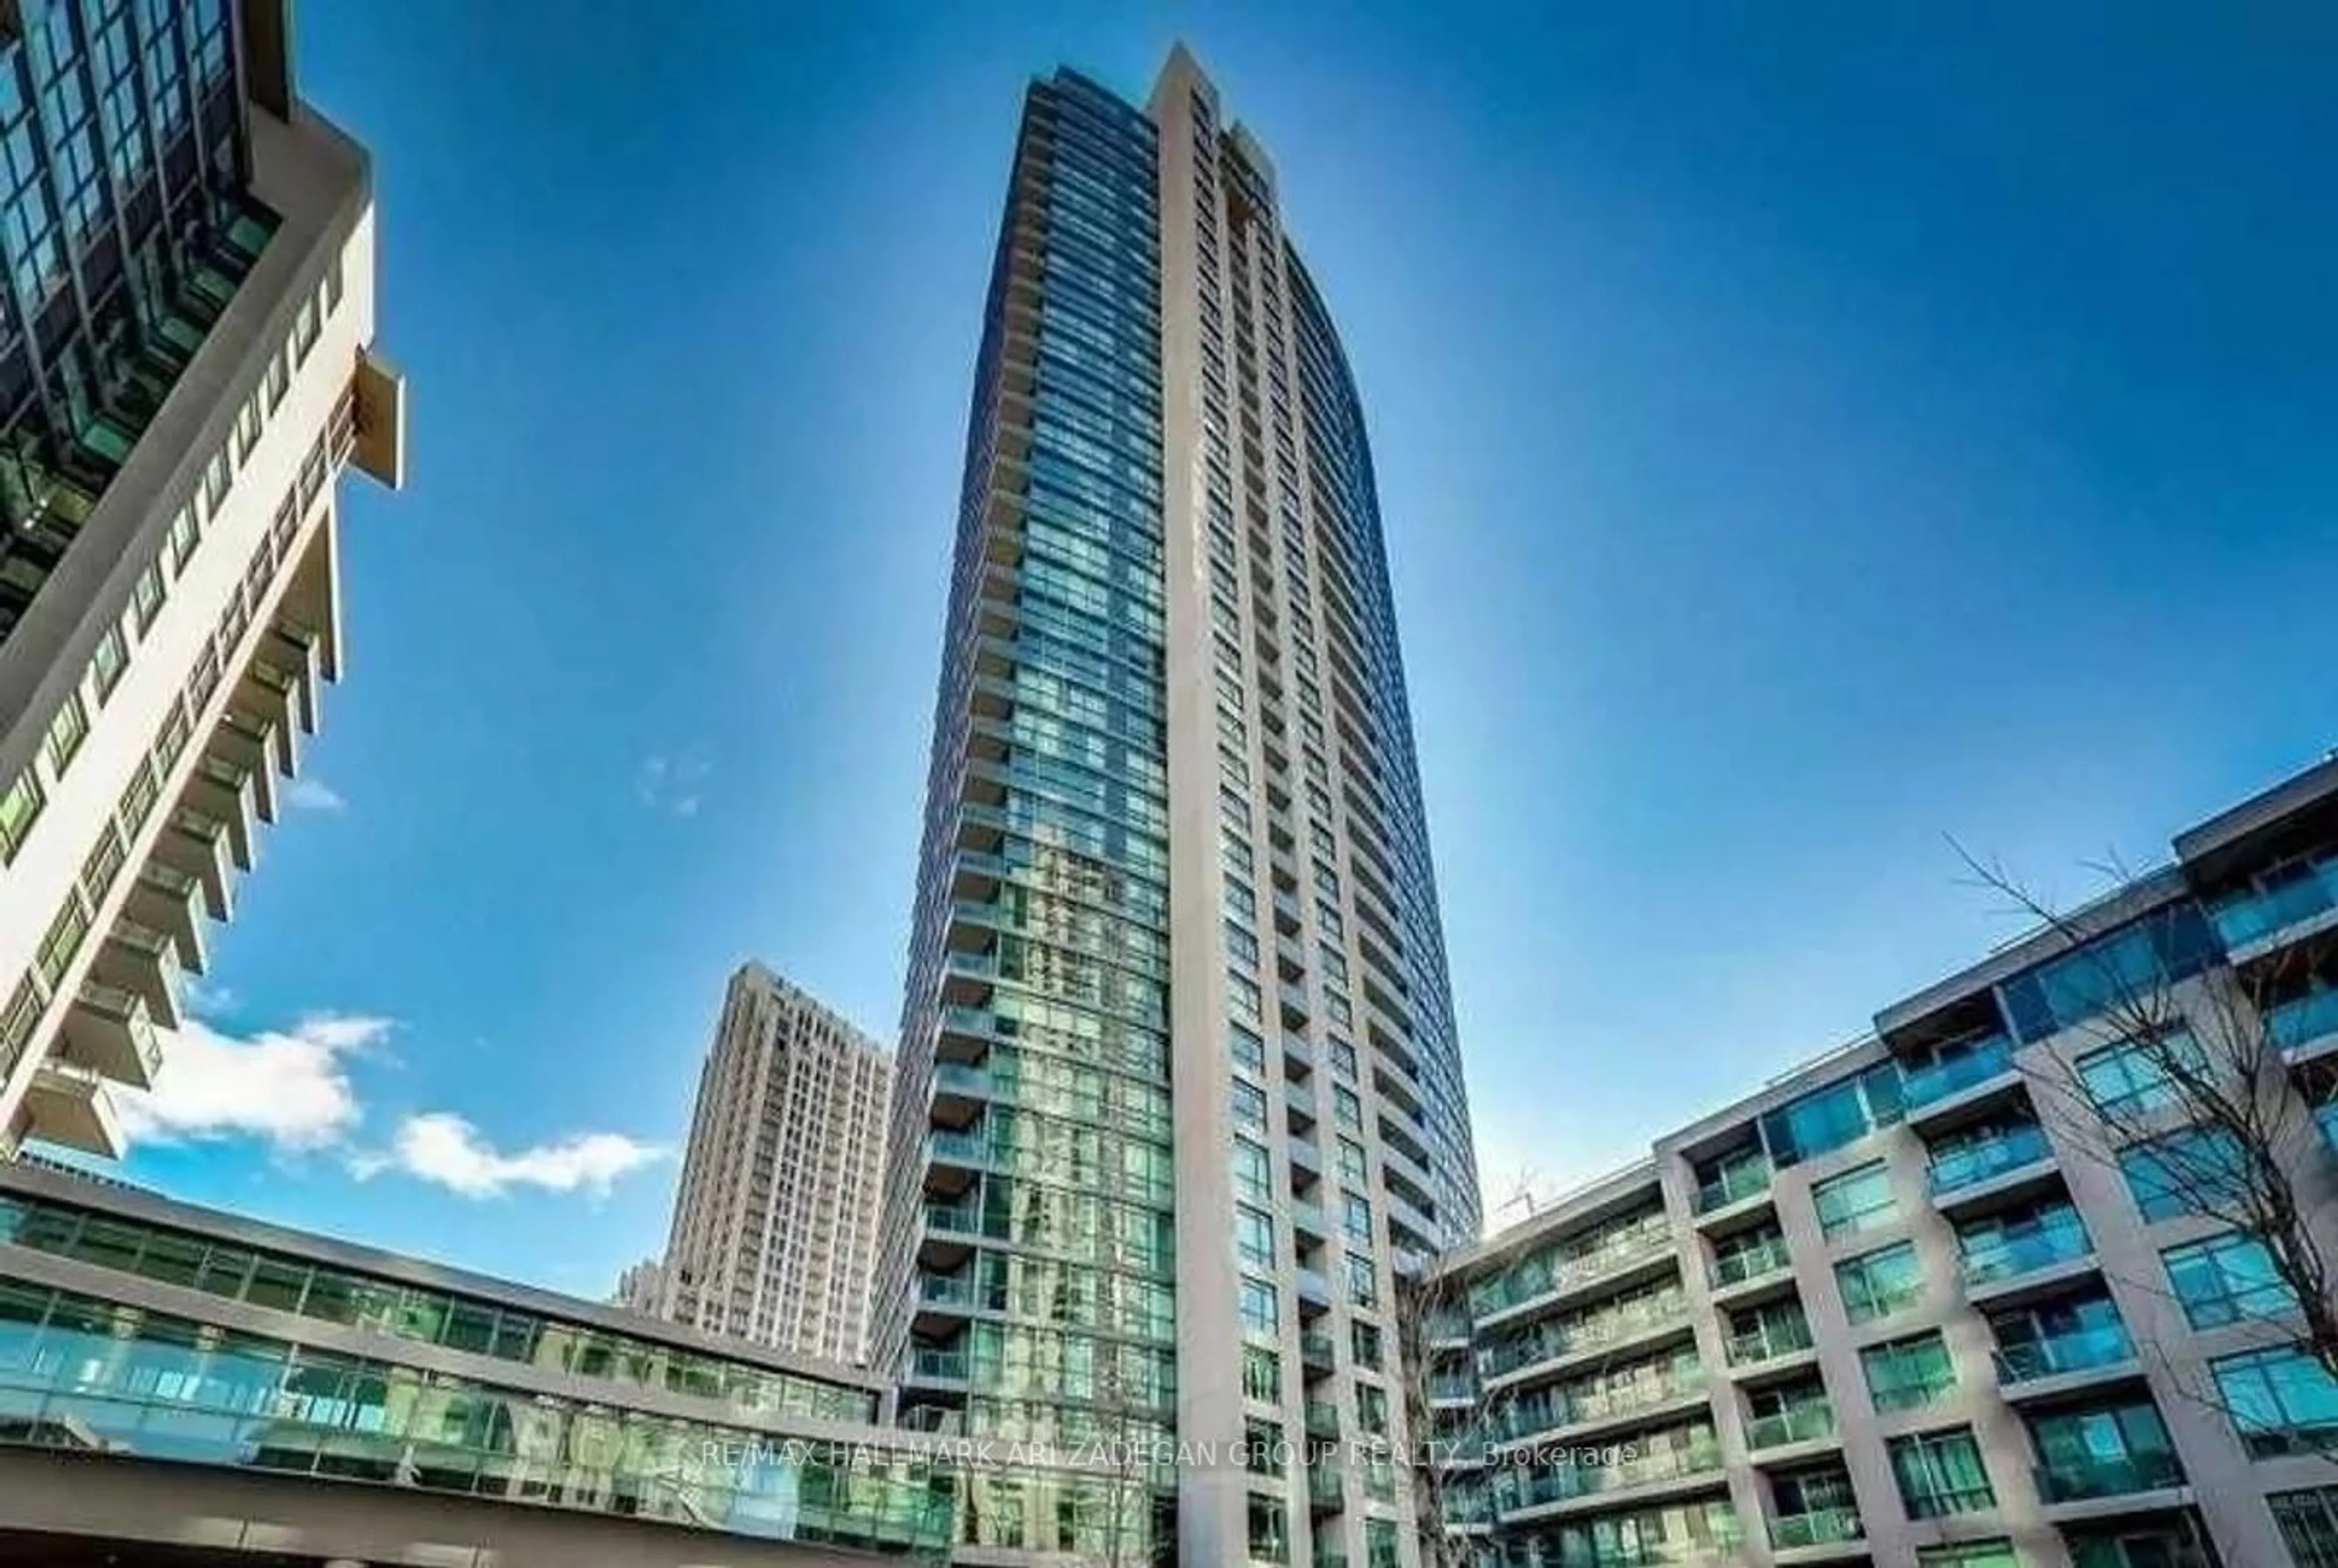
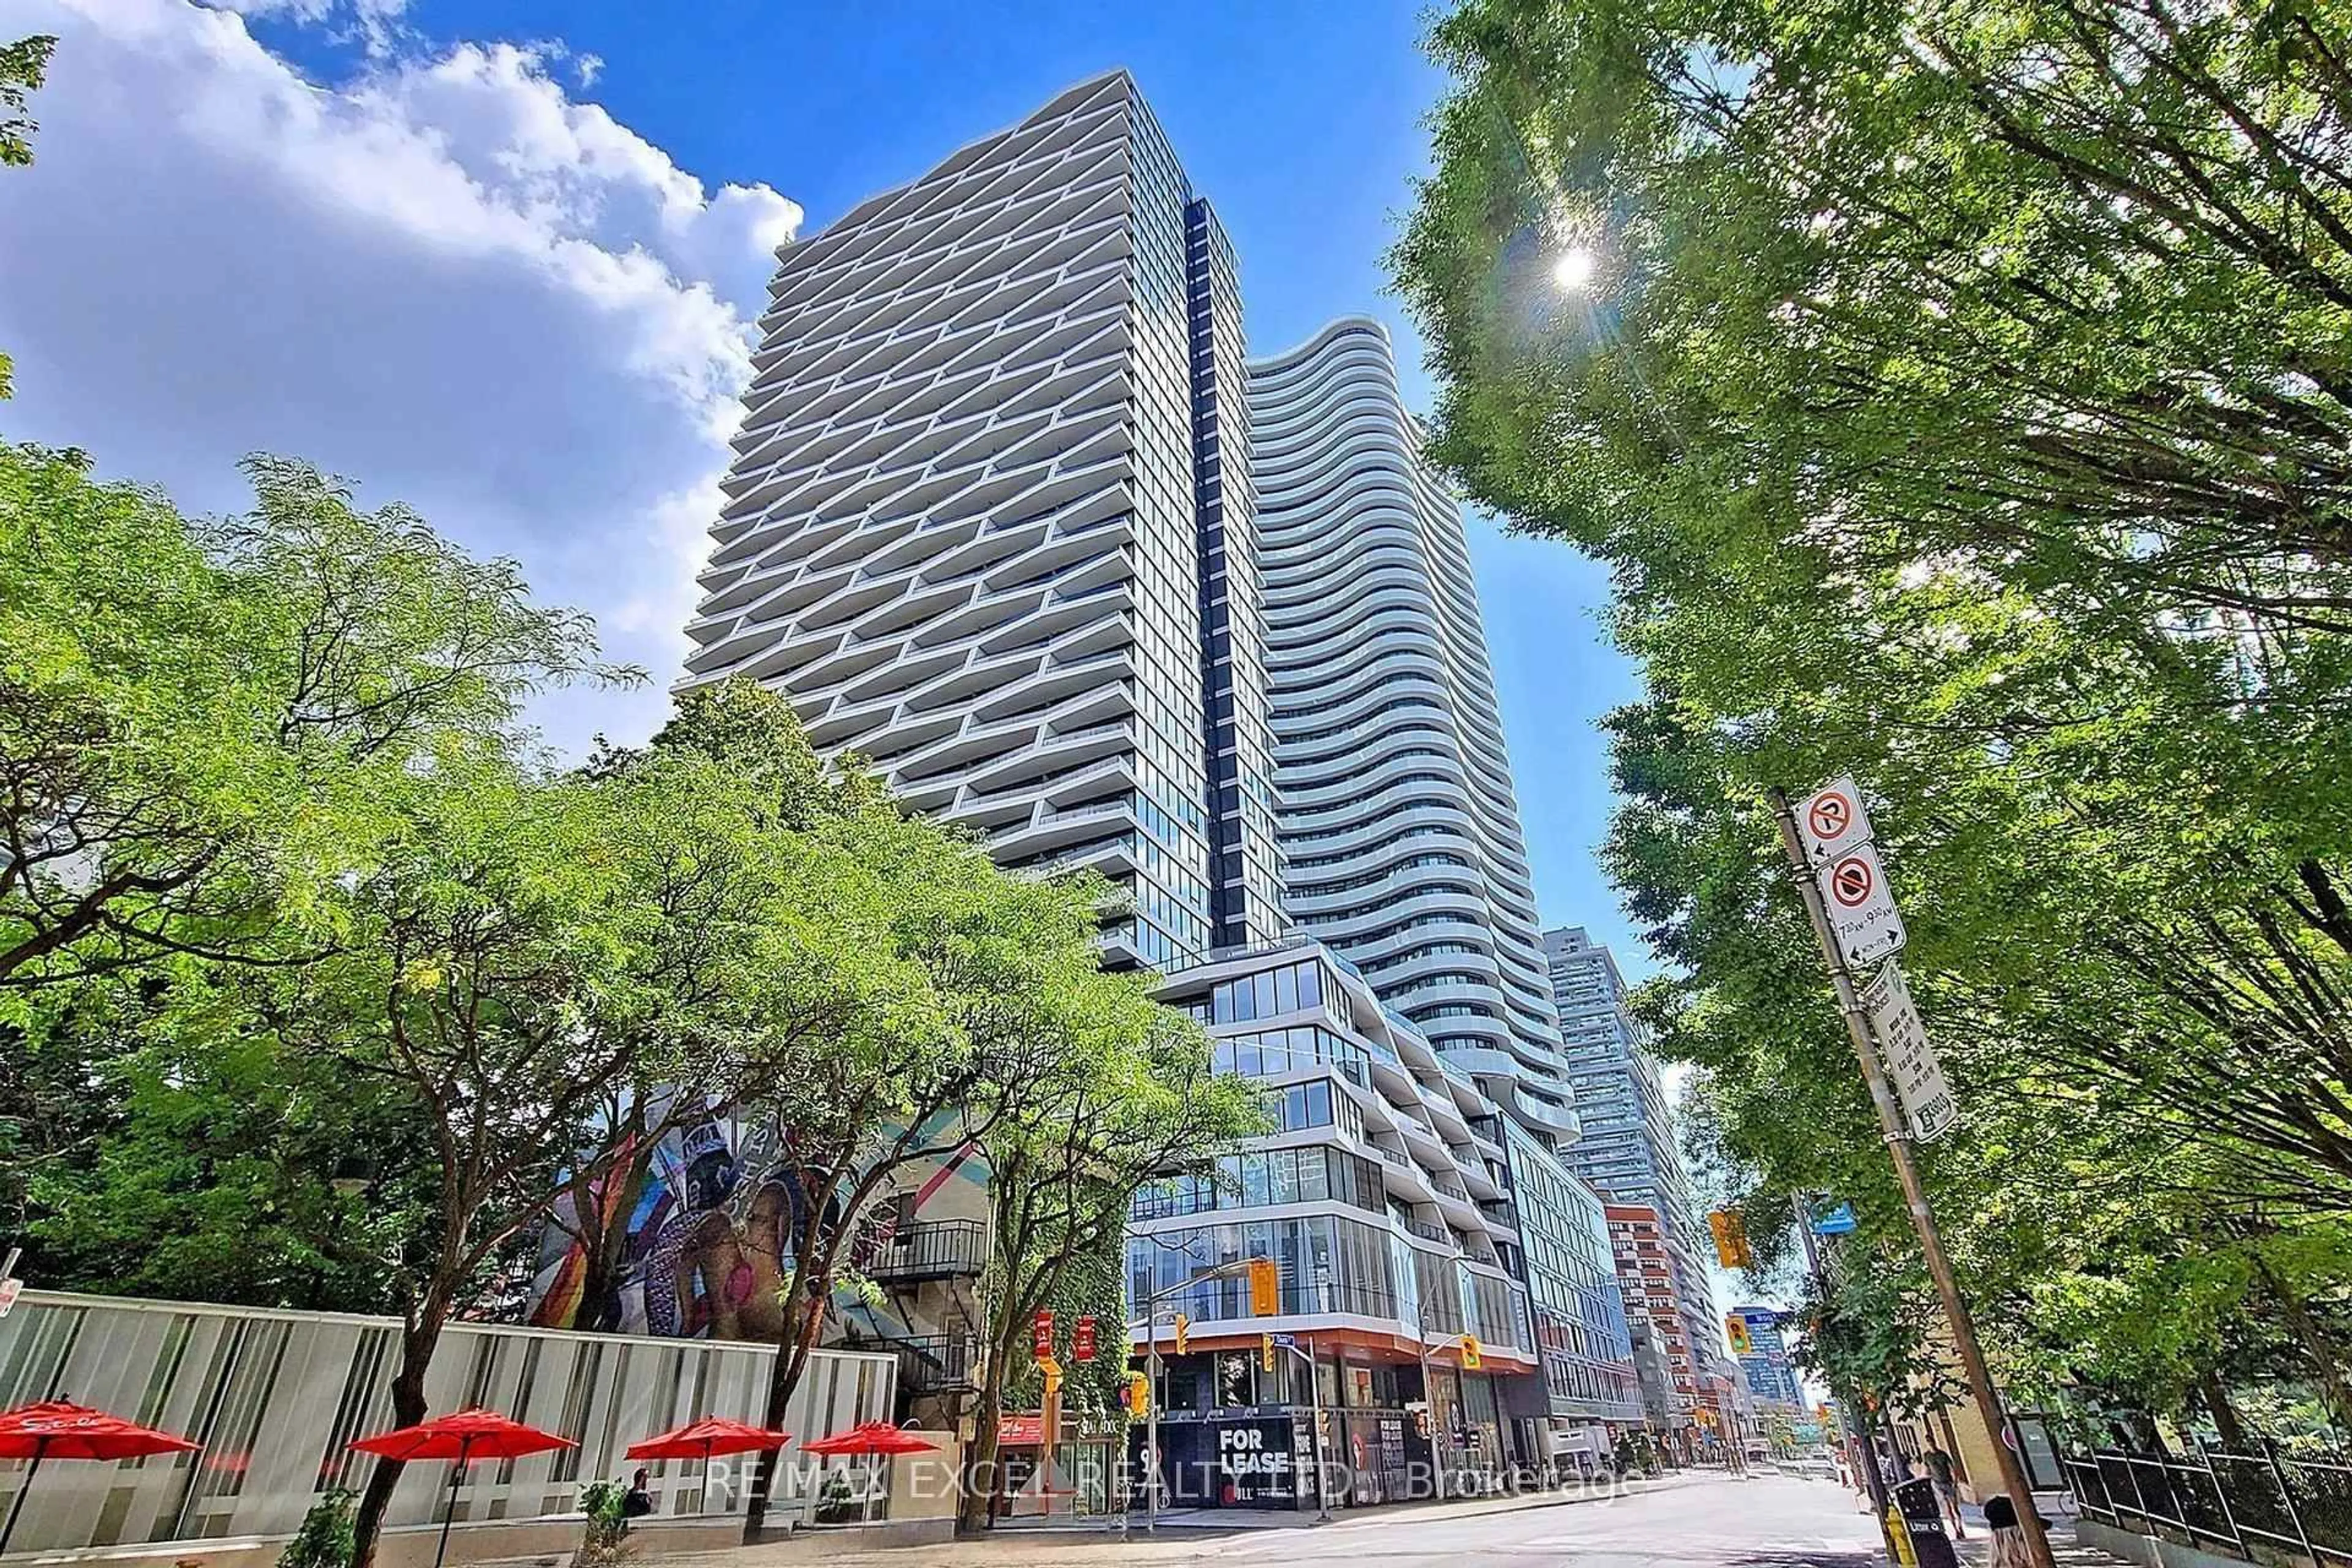
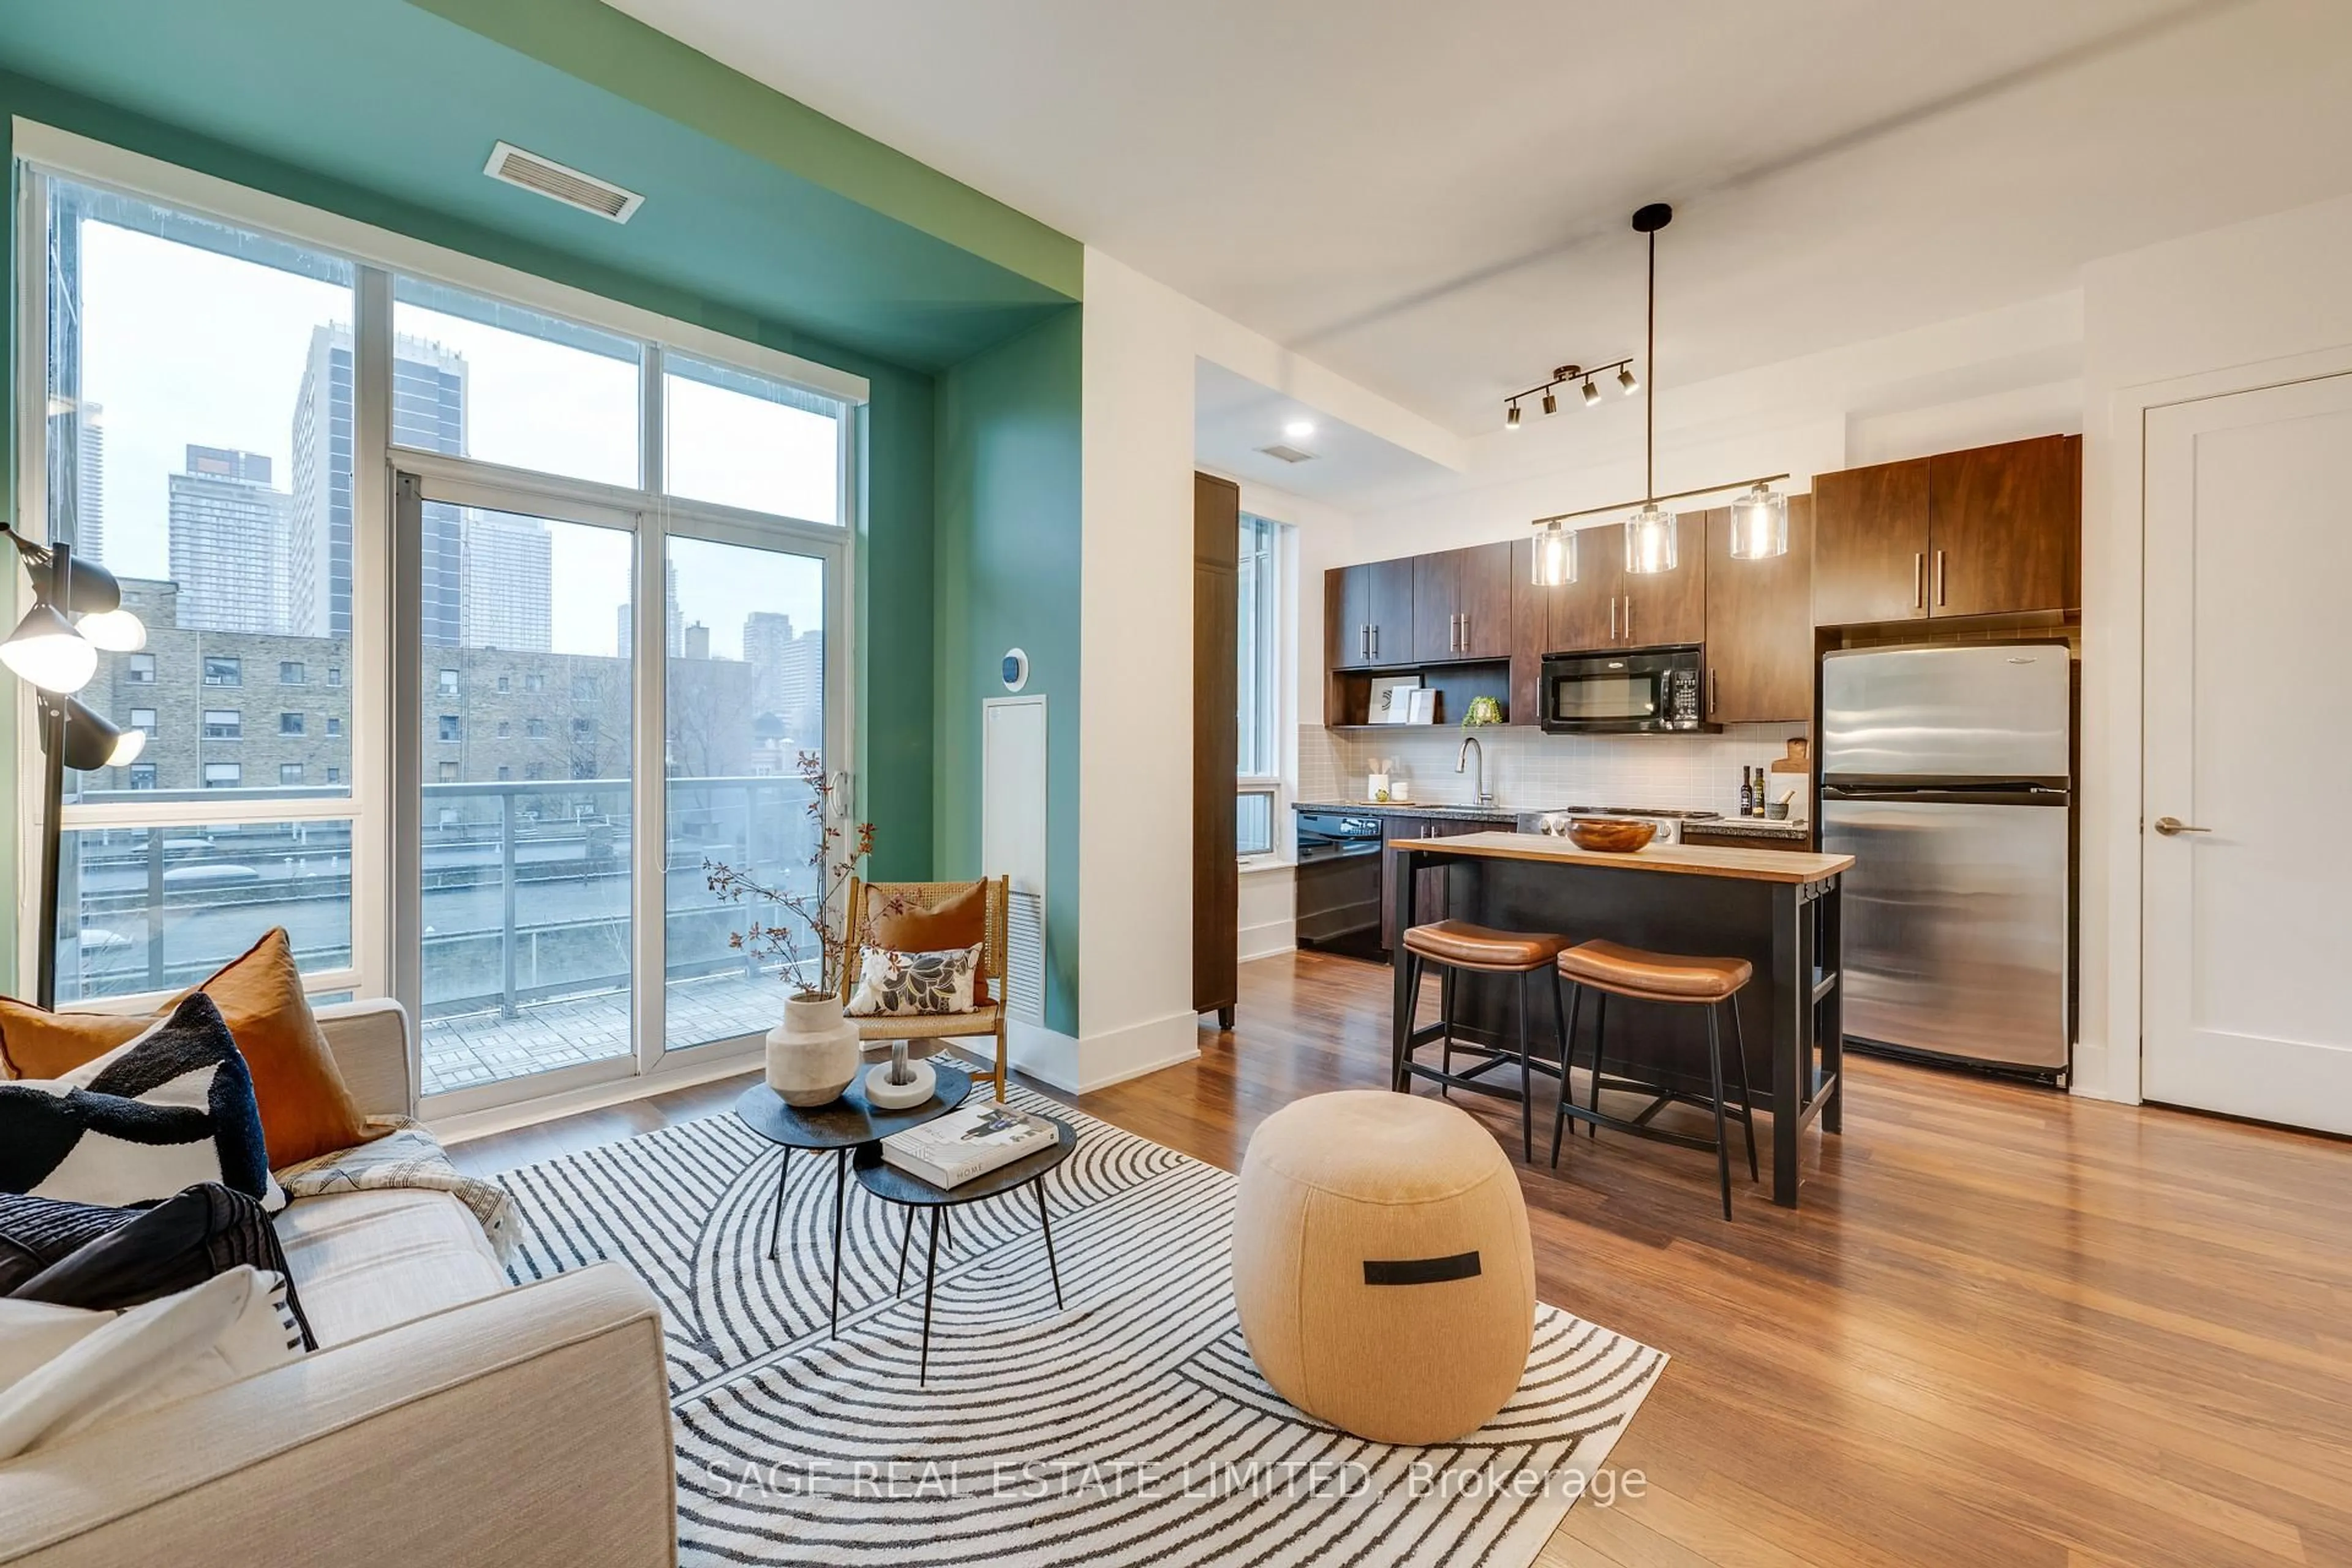
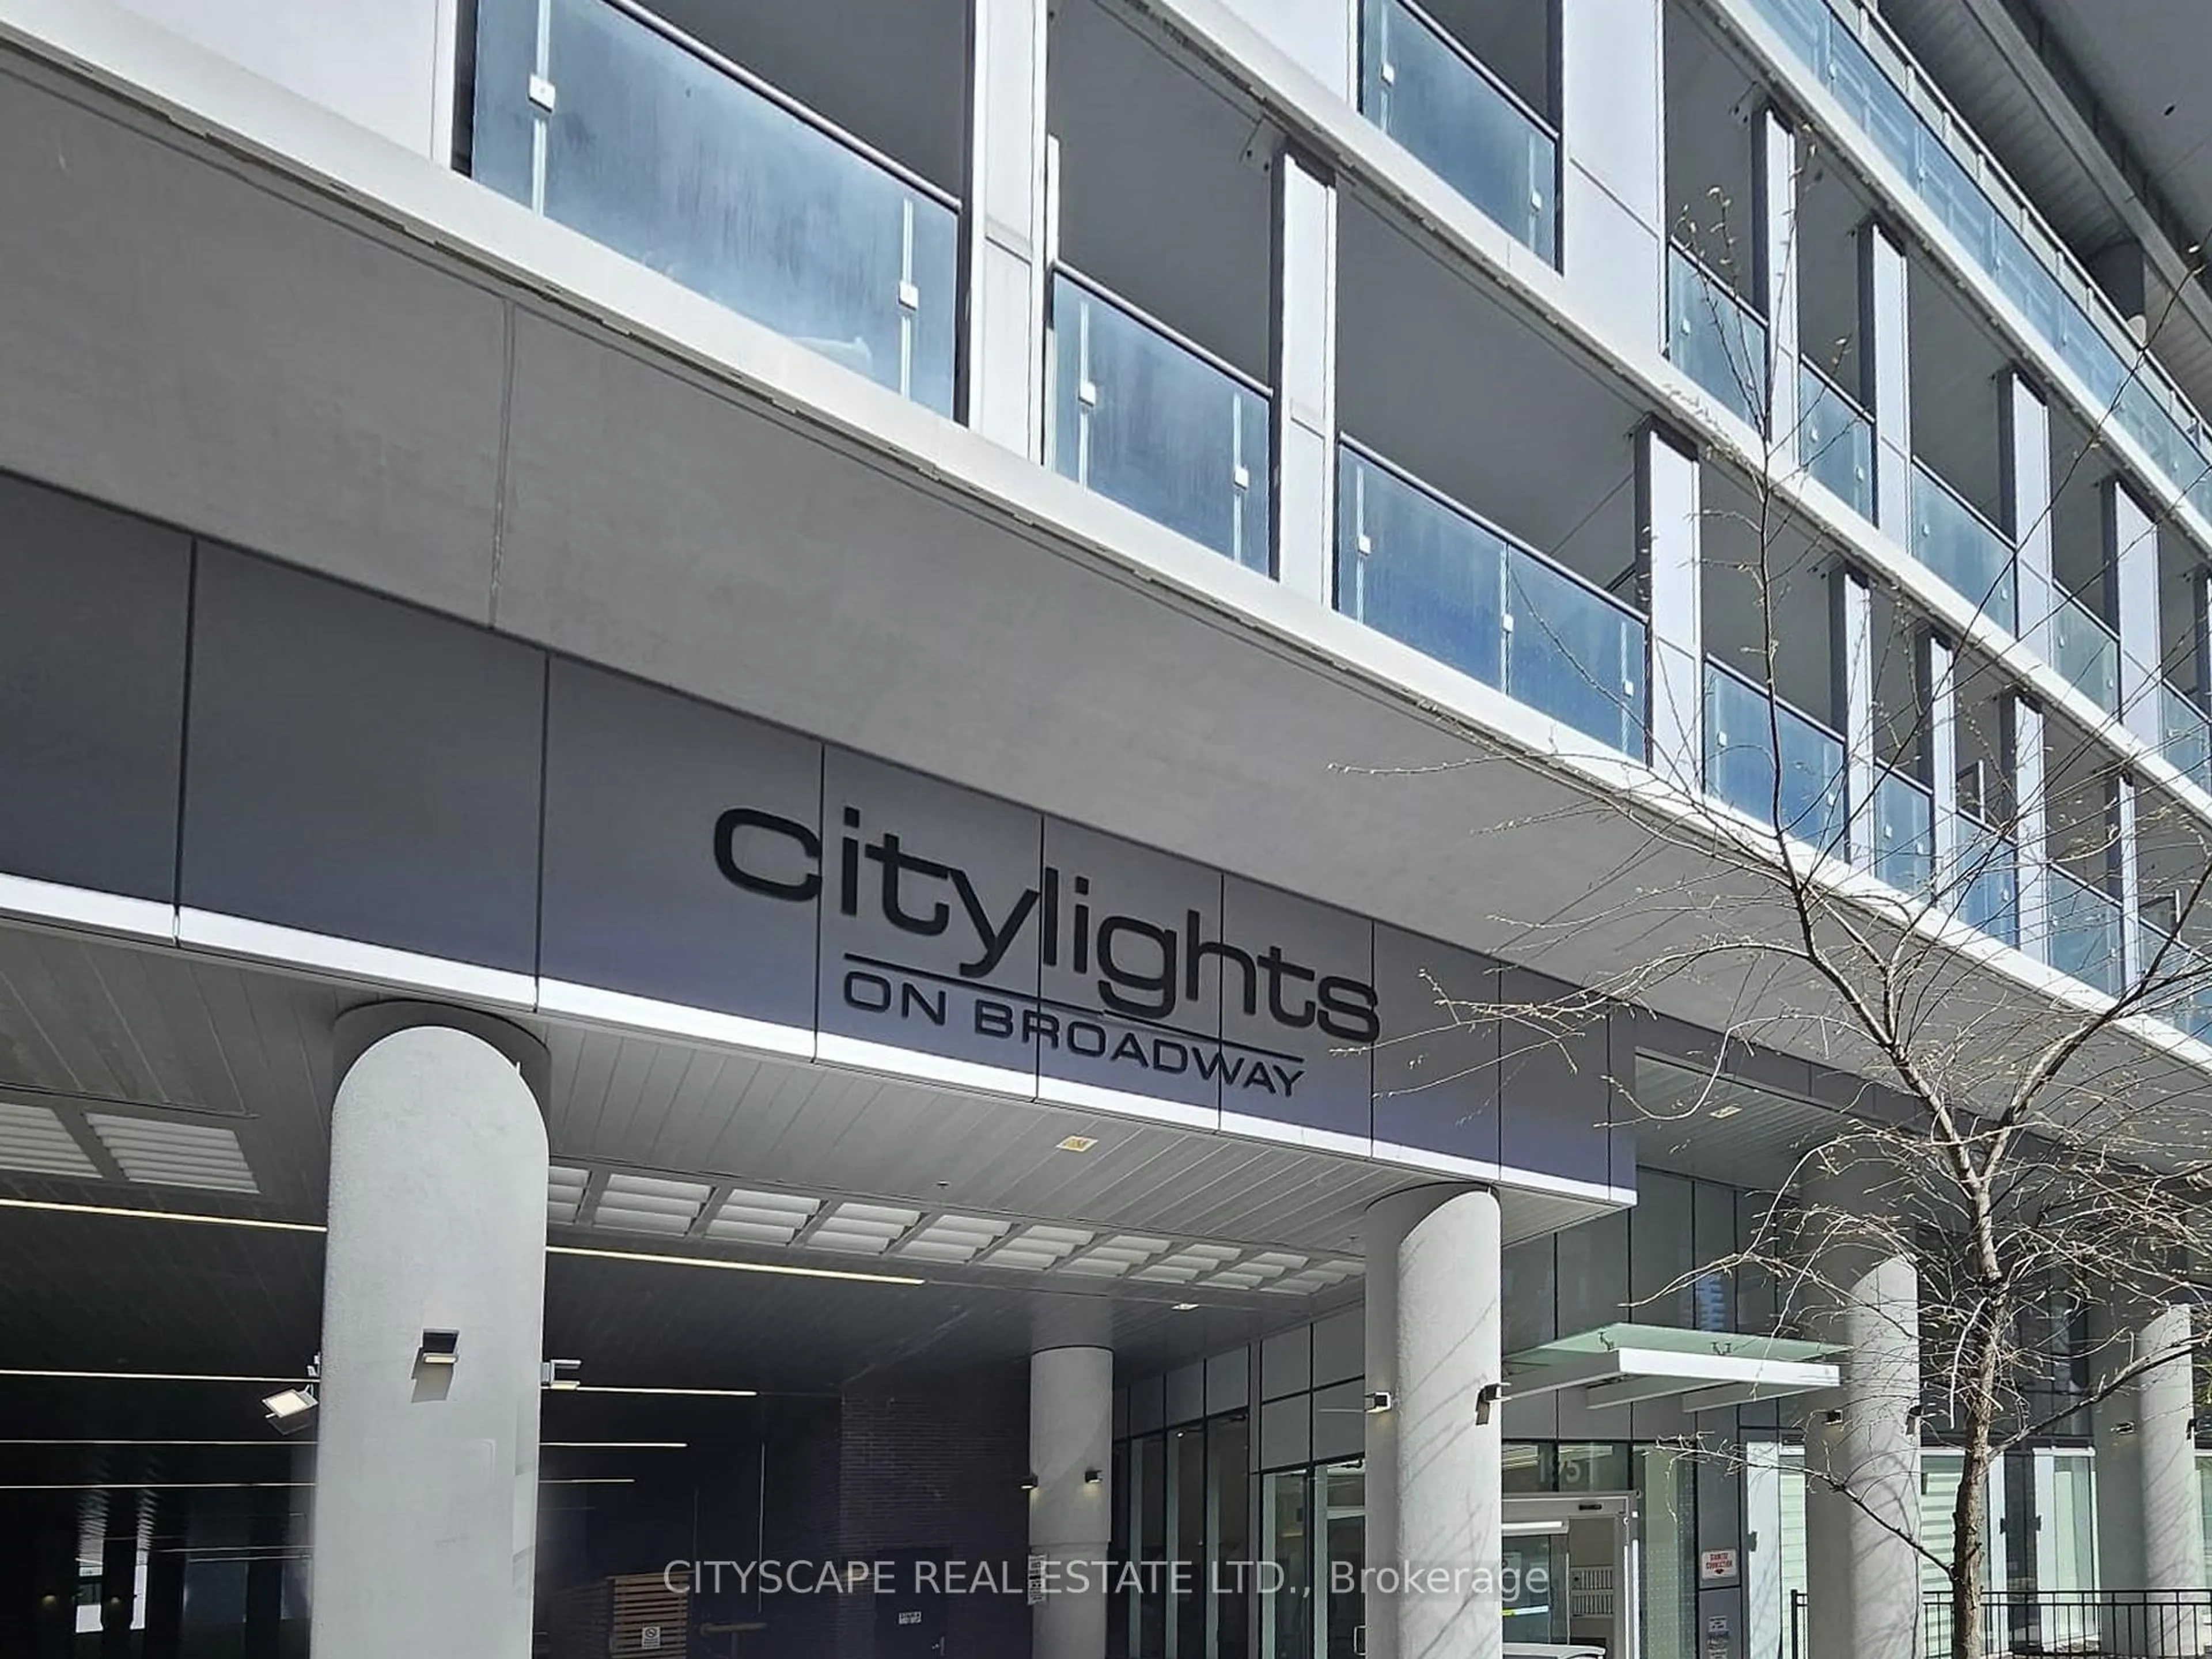
*VIRTUALLY STAGED** Just leased at $2,100/month - an excellent turnkey investment opportunity with immediate cash flow. Investor showings still welcome. Unit has just been repainted and deep cleaned. Welcome To Citylights On Broadway South Tower. Architecturally Stunning, Professionally Designed Amenities, Craftsmanship & Breathtaking Interior Designs - Y&E's Best Value! Walking Distance To Subway W/ Endless Restaurants & Shops! The Broadway Club Offers Over 18,000Sf Indoor & Over 10,000Sf Outdoor Amenities Including 2 Pools, Amphitheater, Party Rm W/ Chef's Kitchen, Fitness Centre +More! 1 + Den, 1 Bath W/ Balcony. North Exposure. Locker Included.
Property Details
Interior
Features
Flat Floor
Den
2.25 x 1.68Laminate
Living
3.35 x 2.54Laminate / Open Concept / W/O To Balcony
Br
4.92 x 3.9Laminate / Closet / Window
Exterior
Features
Condo Details
Amenities
Exercise Room, Gym, Concierge, Outdoor Pool
Inclusions
Property History
 44
44