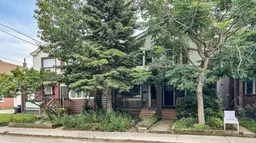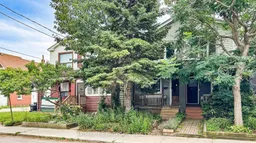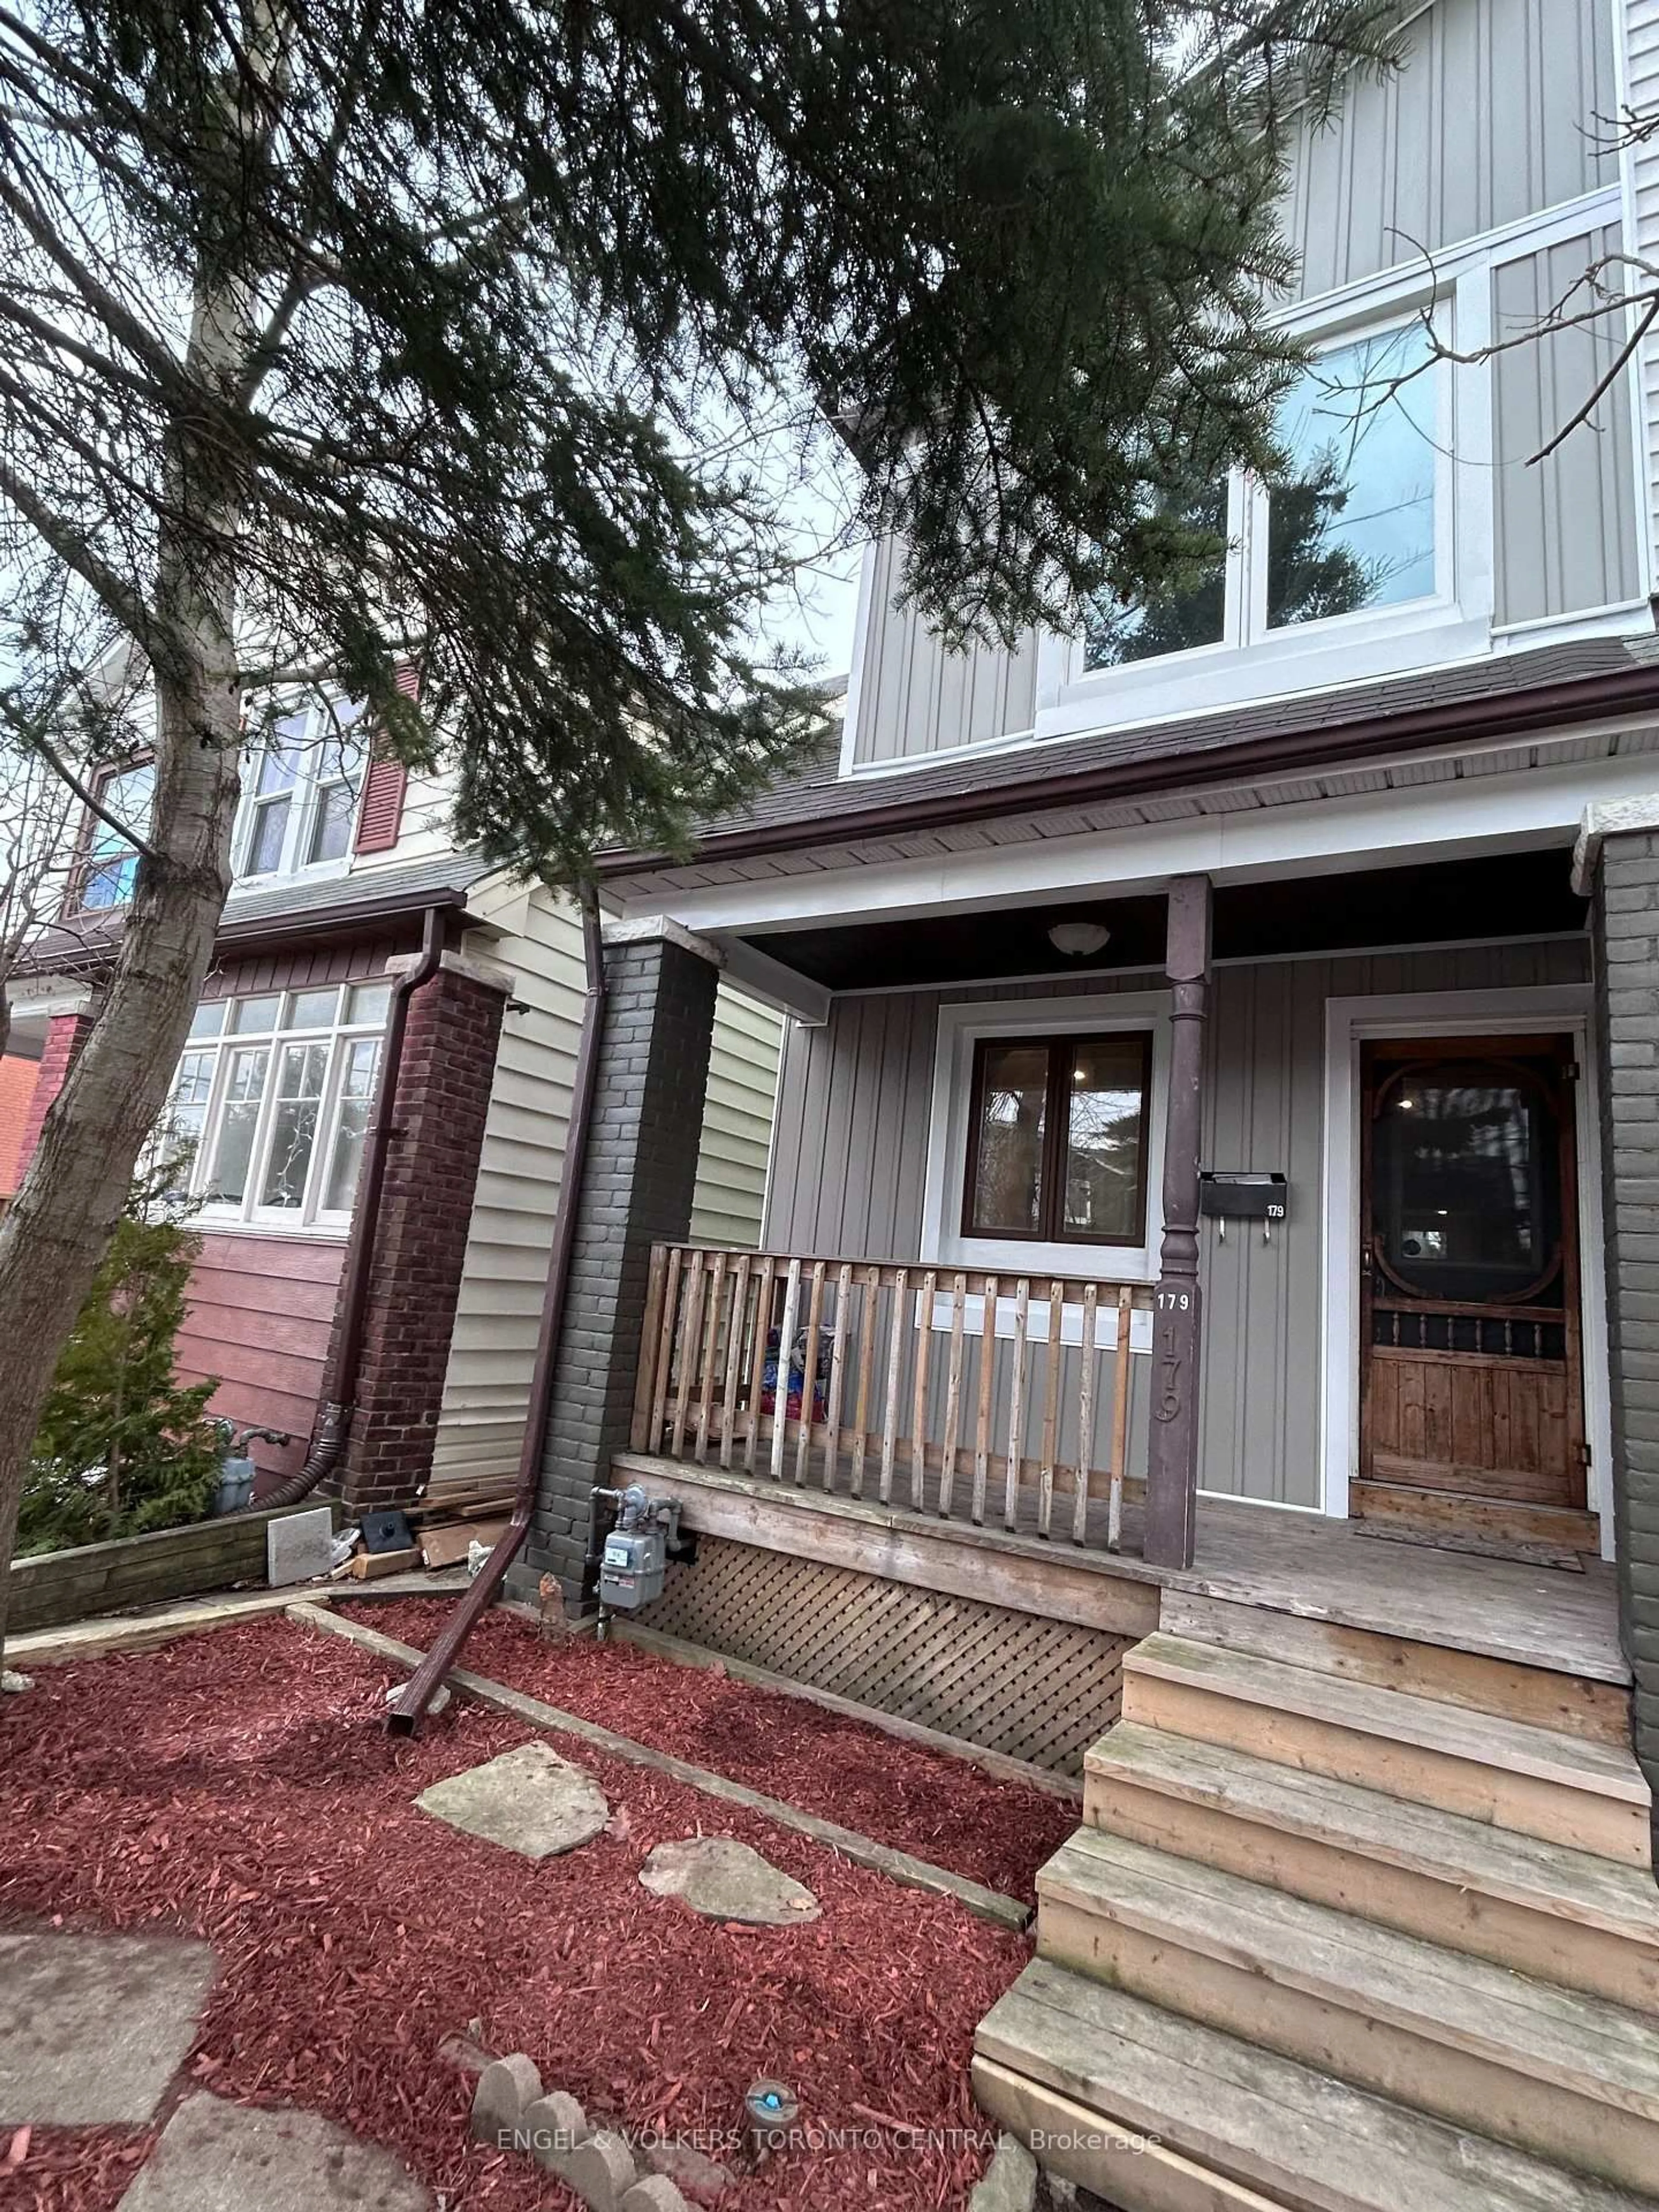
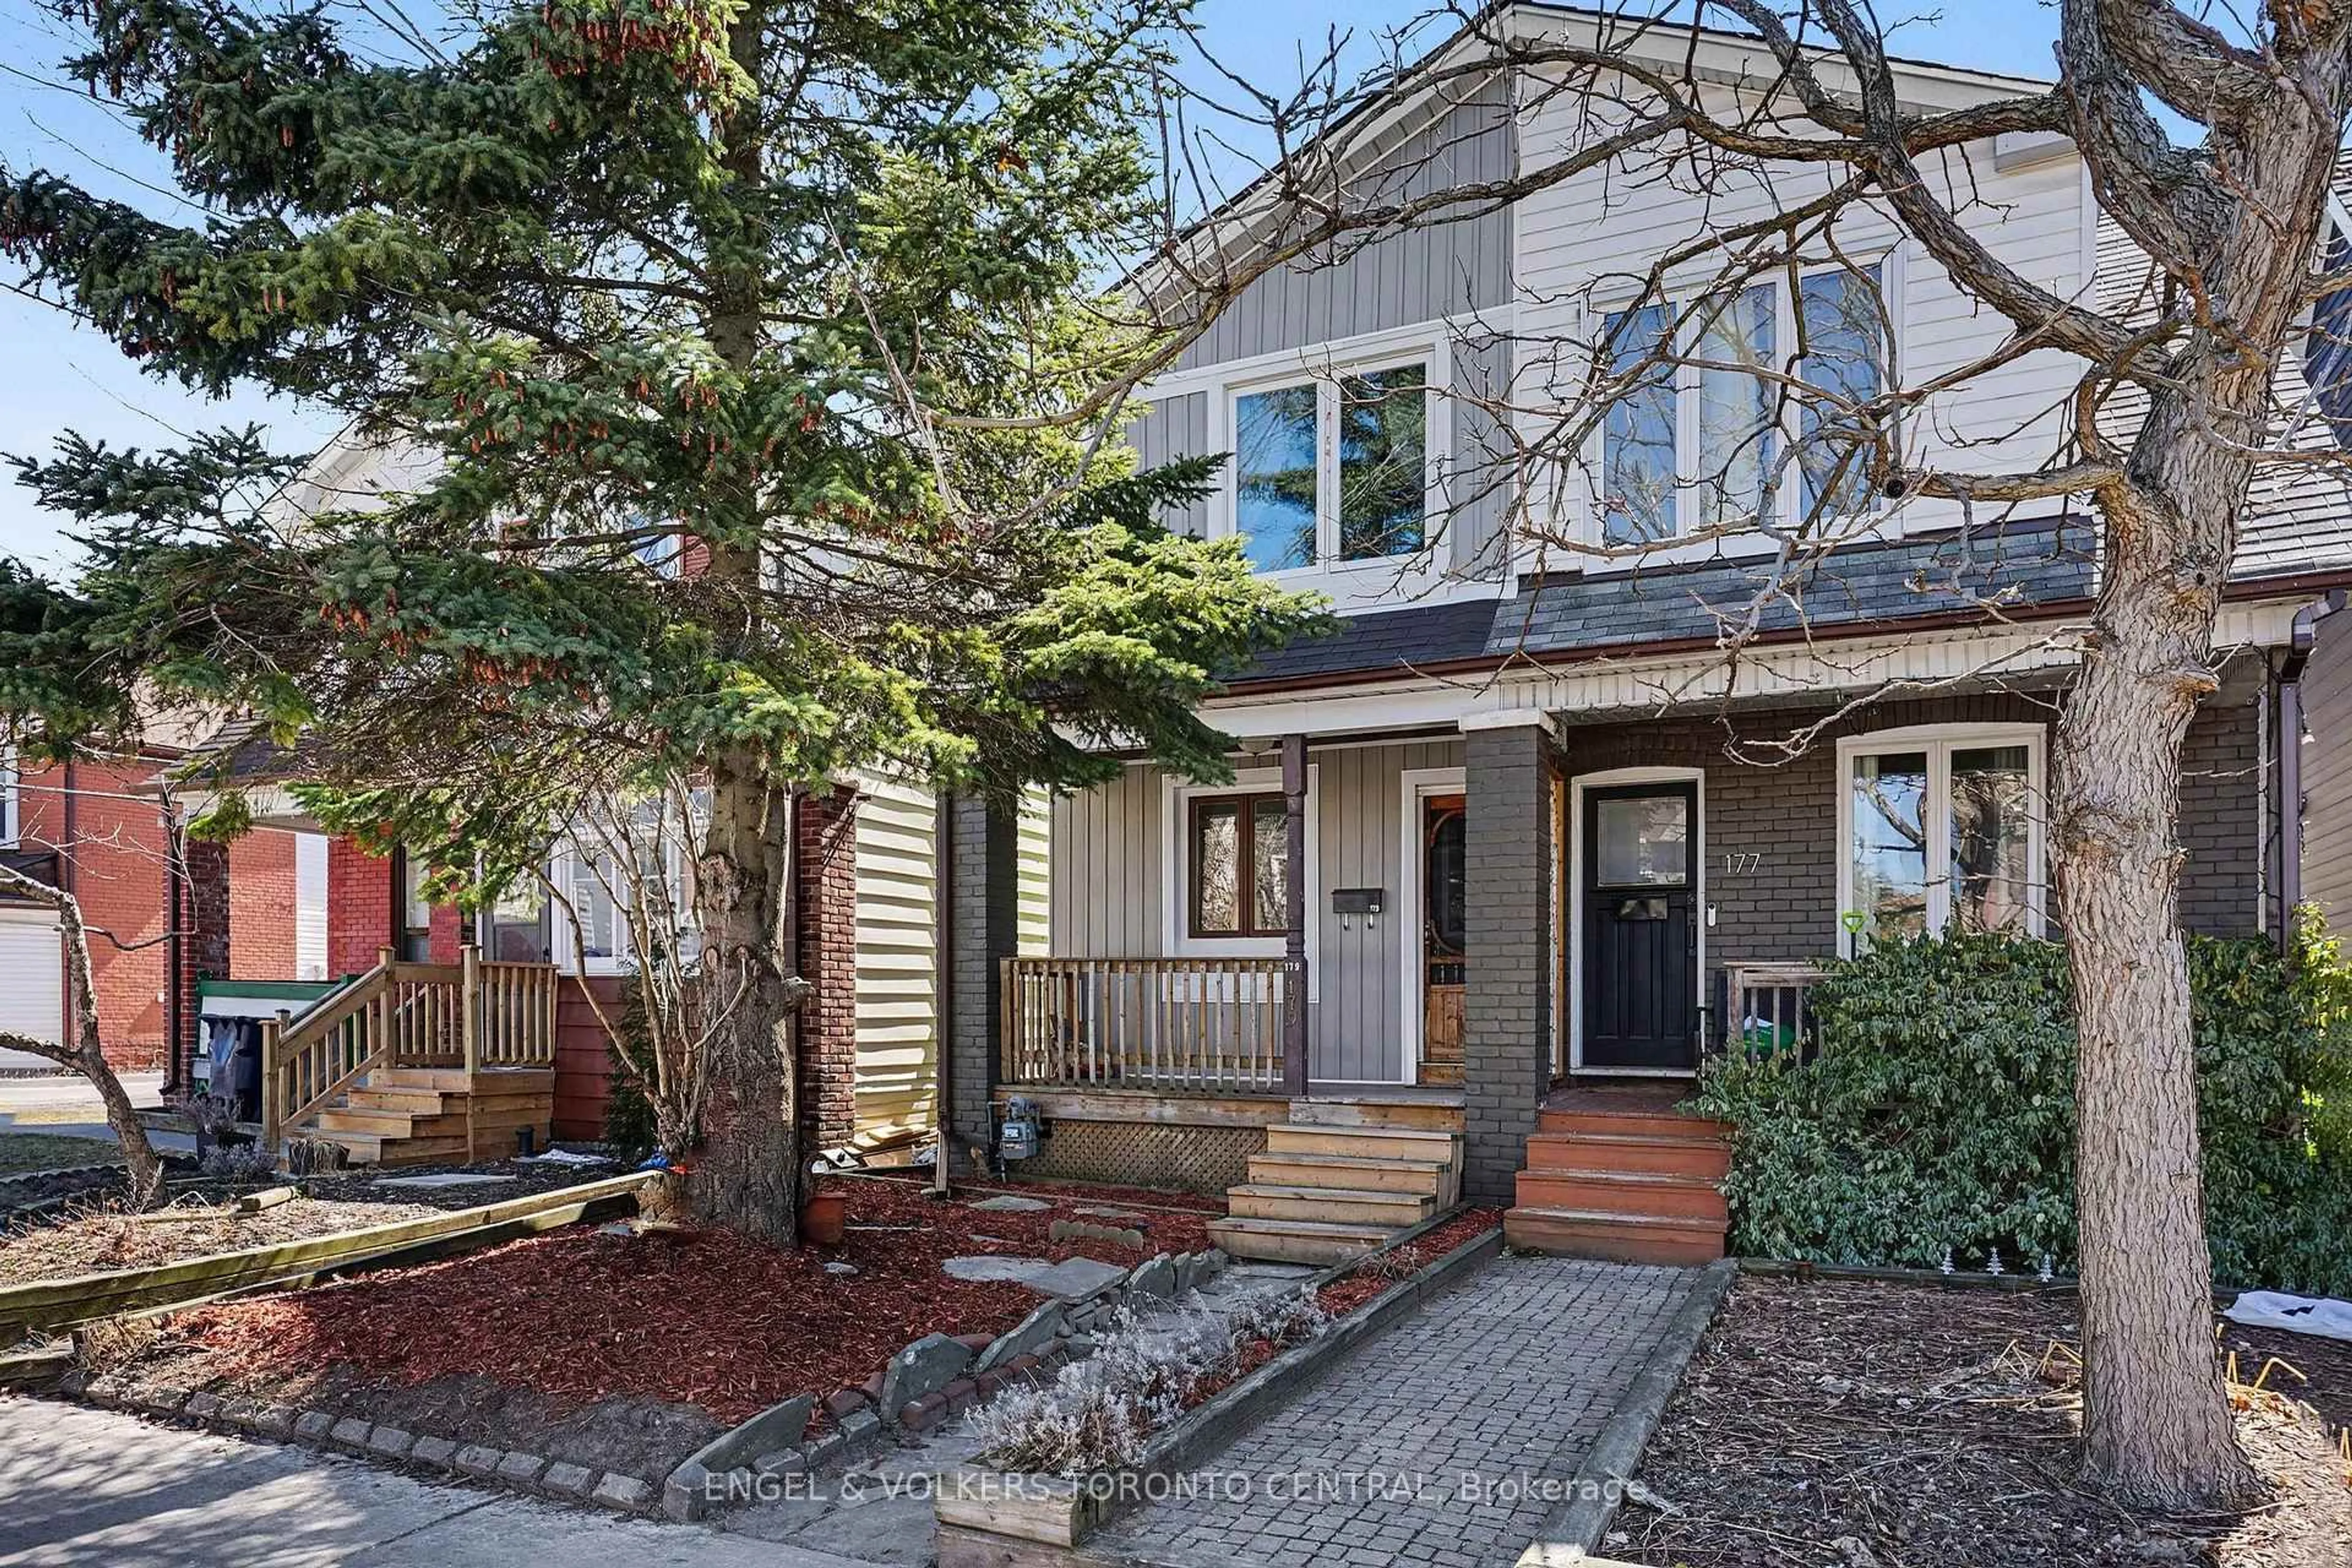
179 Coleman Ave, Toronto, Ontario M4C 1P9
Contact us about this property
Highlights
Estimated valueThis is the price Wahi expects this property to sell for.
The calculation is powered by our Instant Home Value Estimate, which uses current market and property price trends to estimate your home’s value with a 90% accuracy rate.Not available
Price/Sqft$934/sqft
Monthly cost
Open Calculator
Description
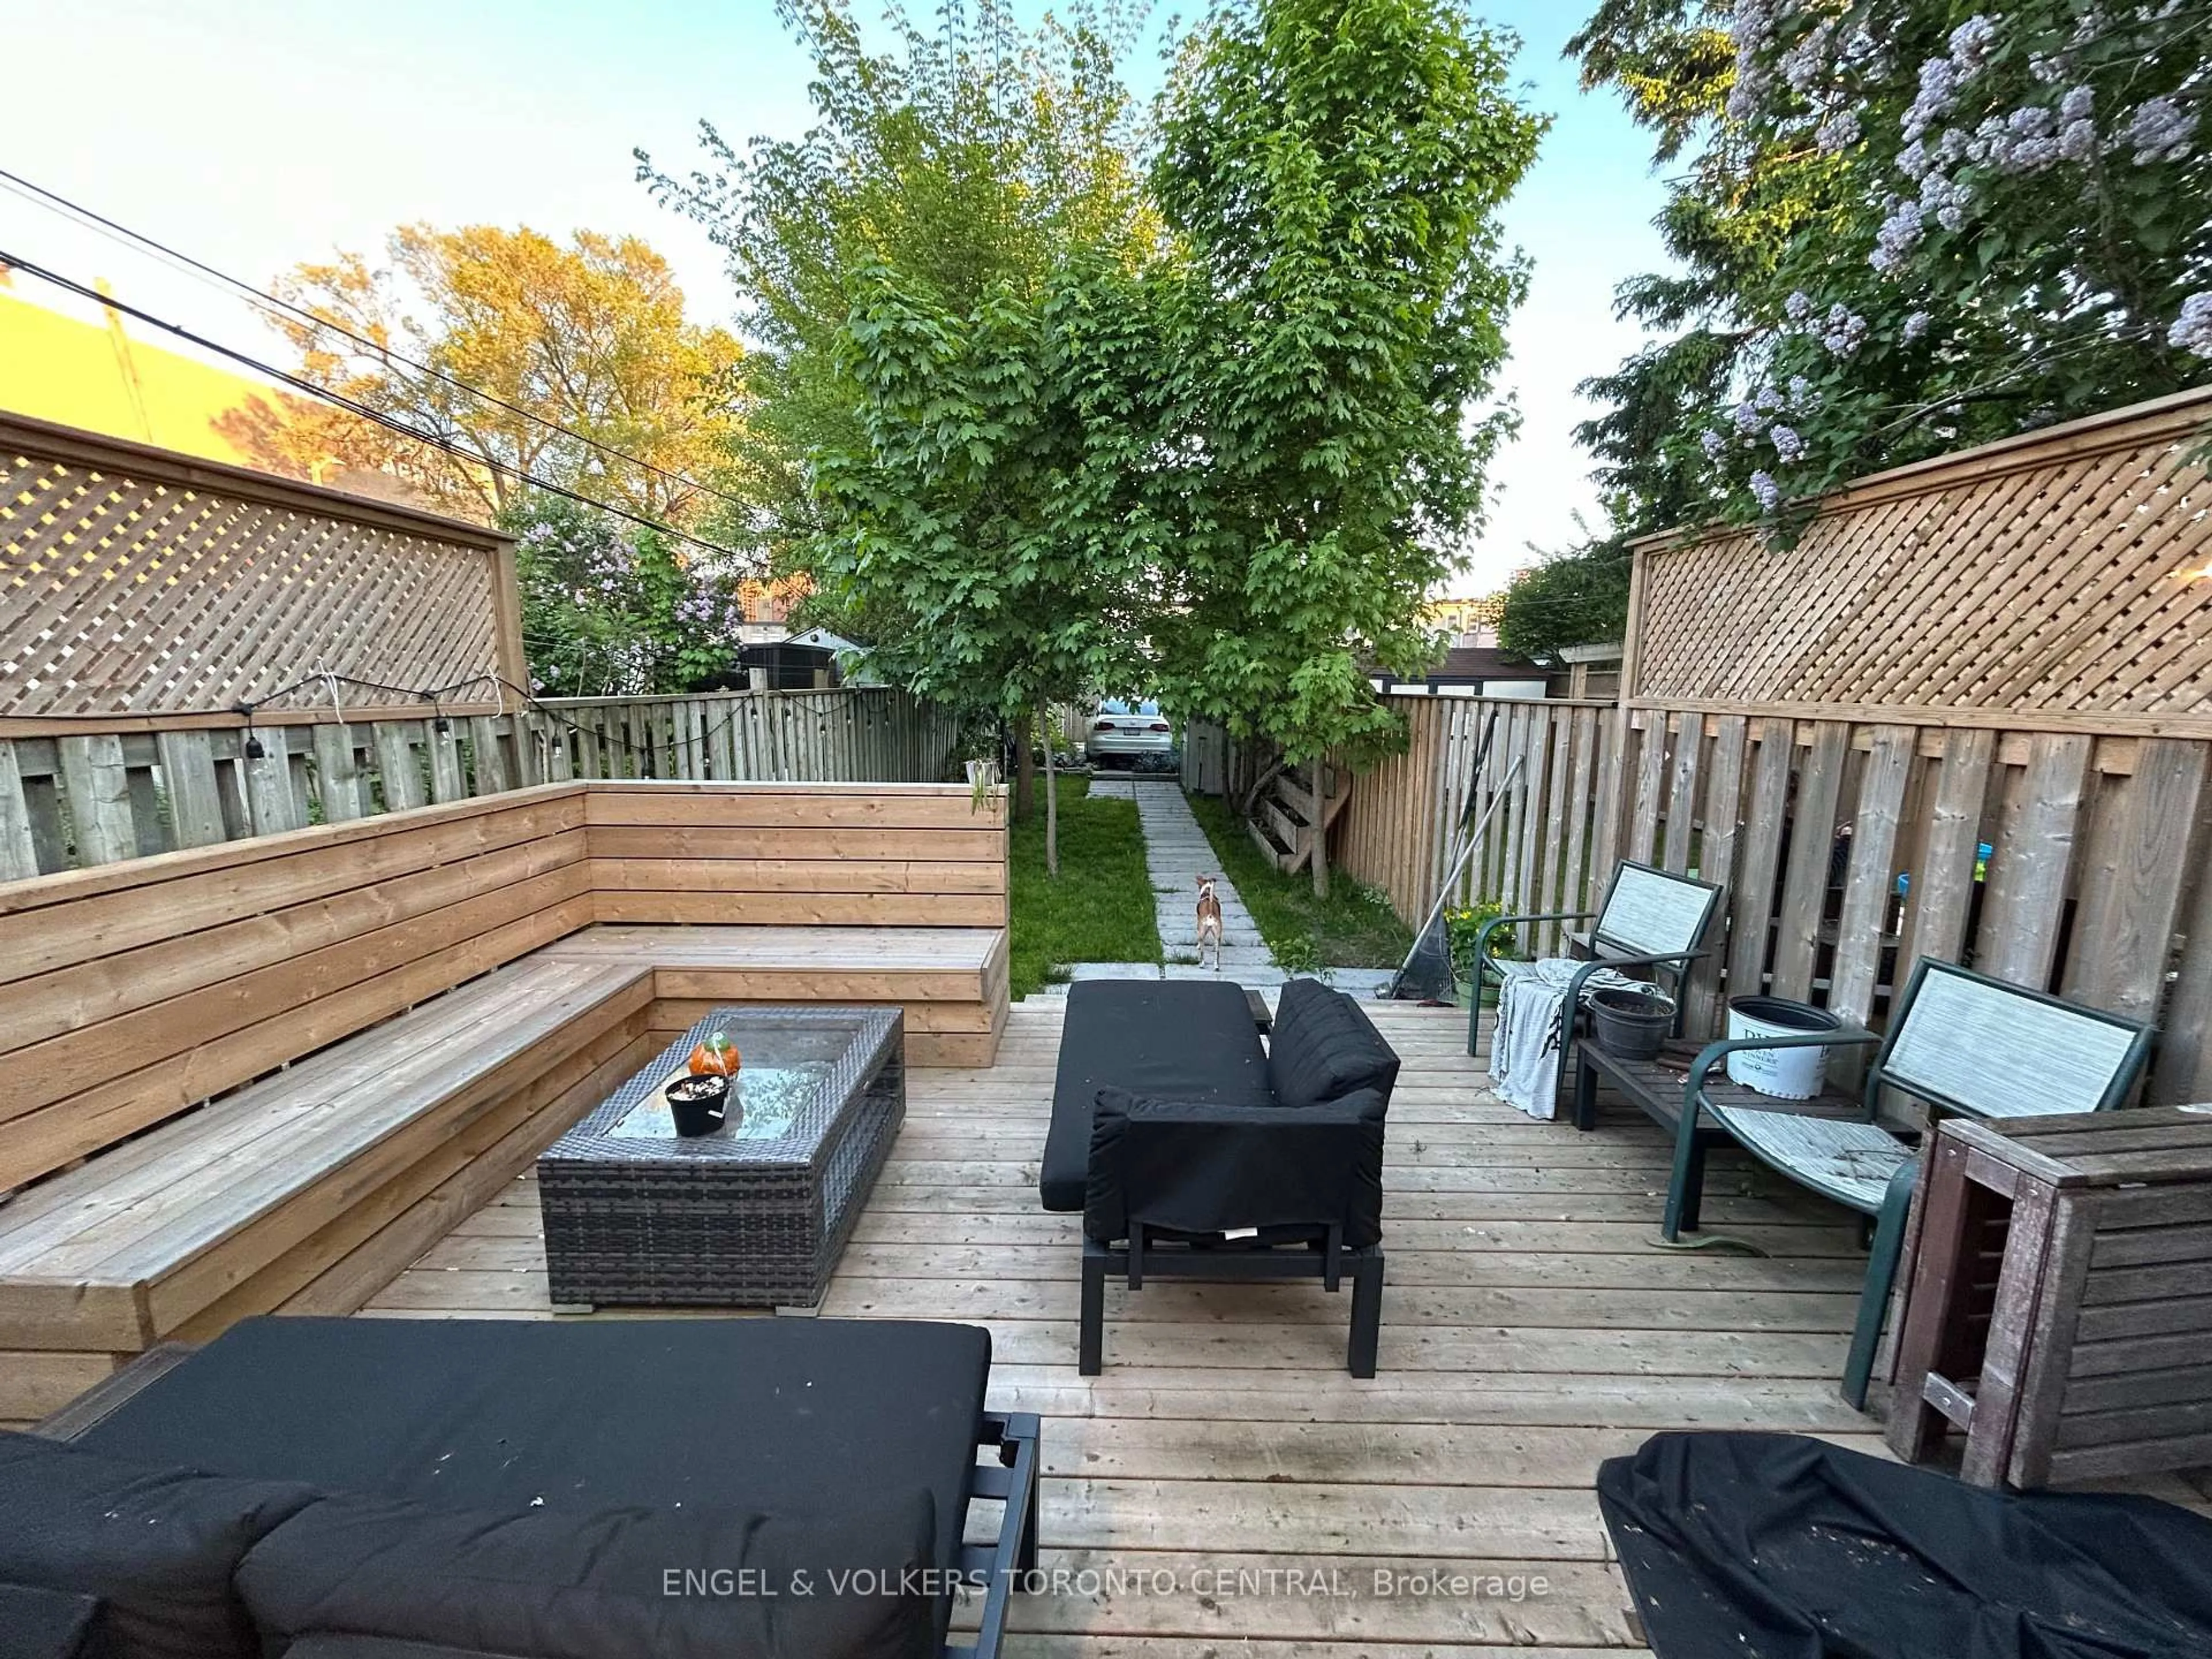
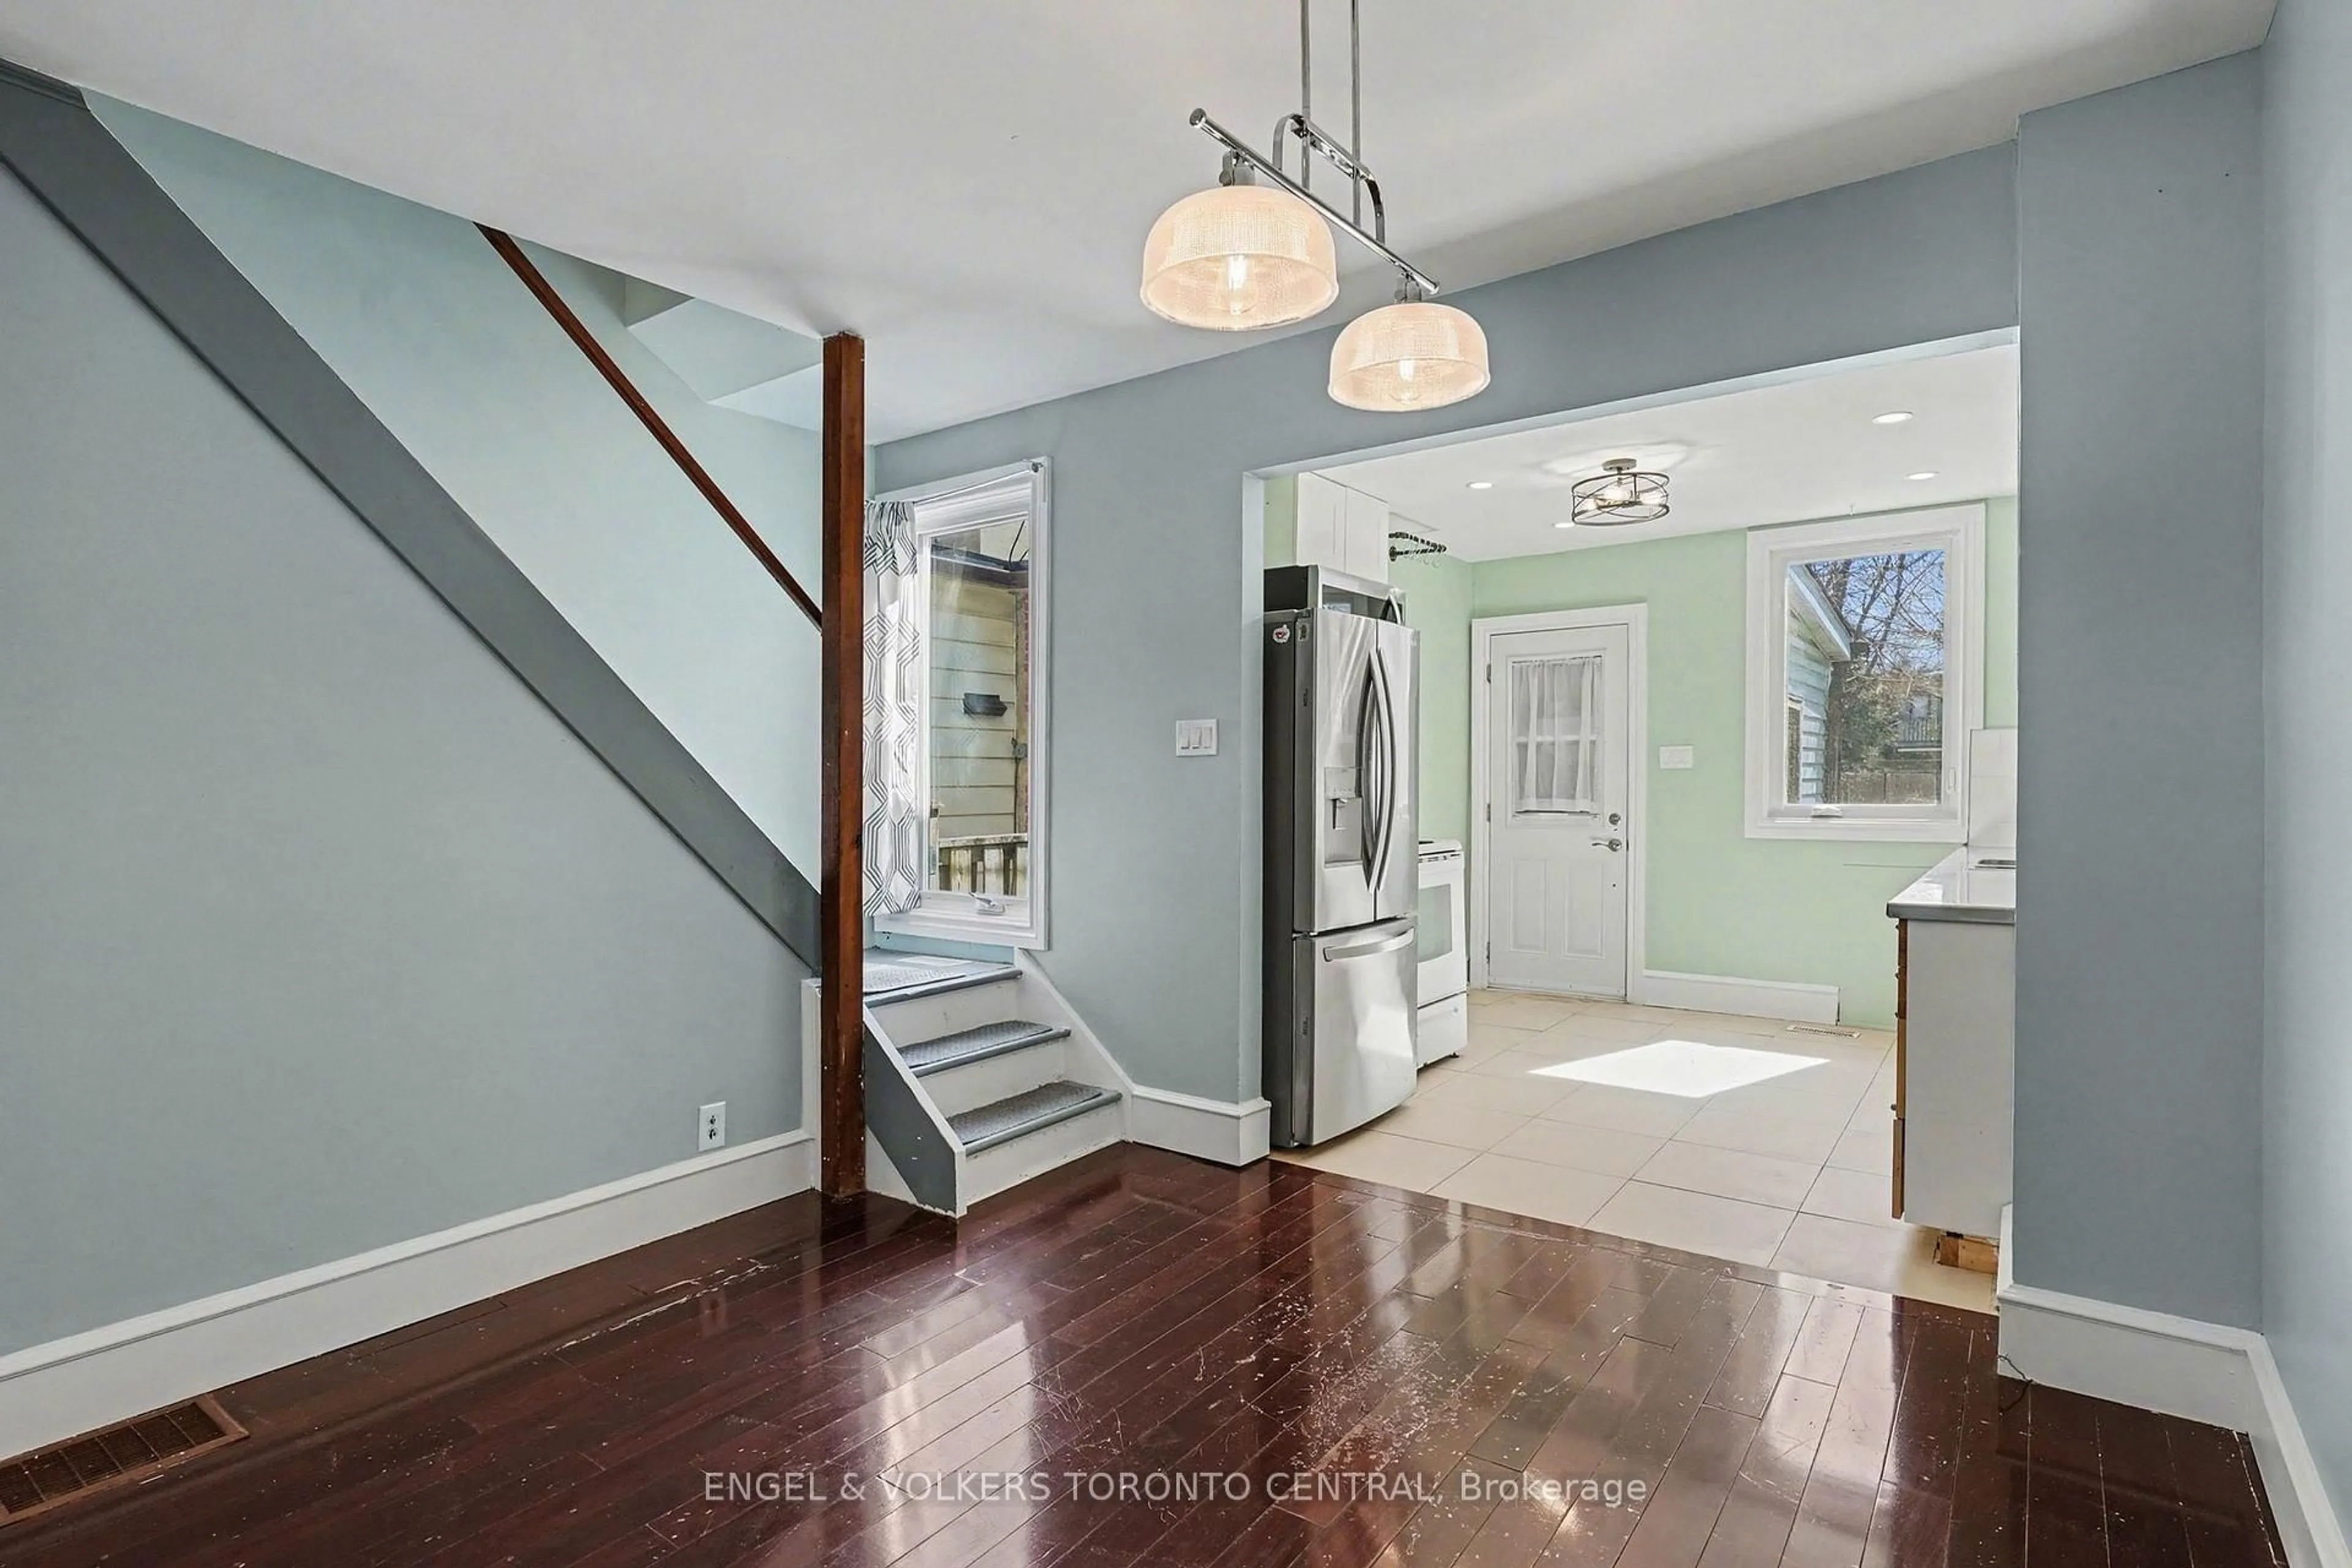
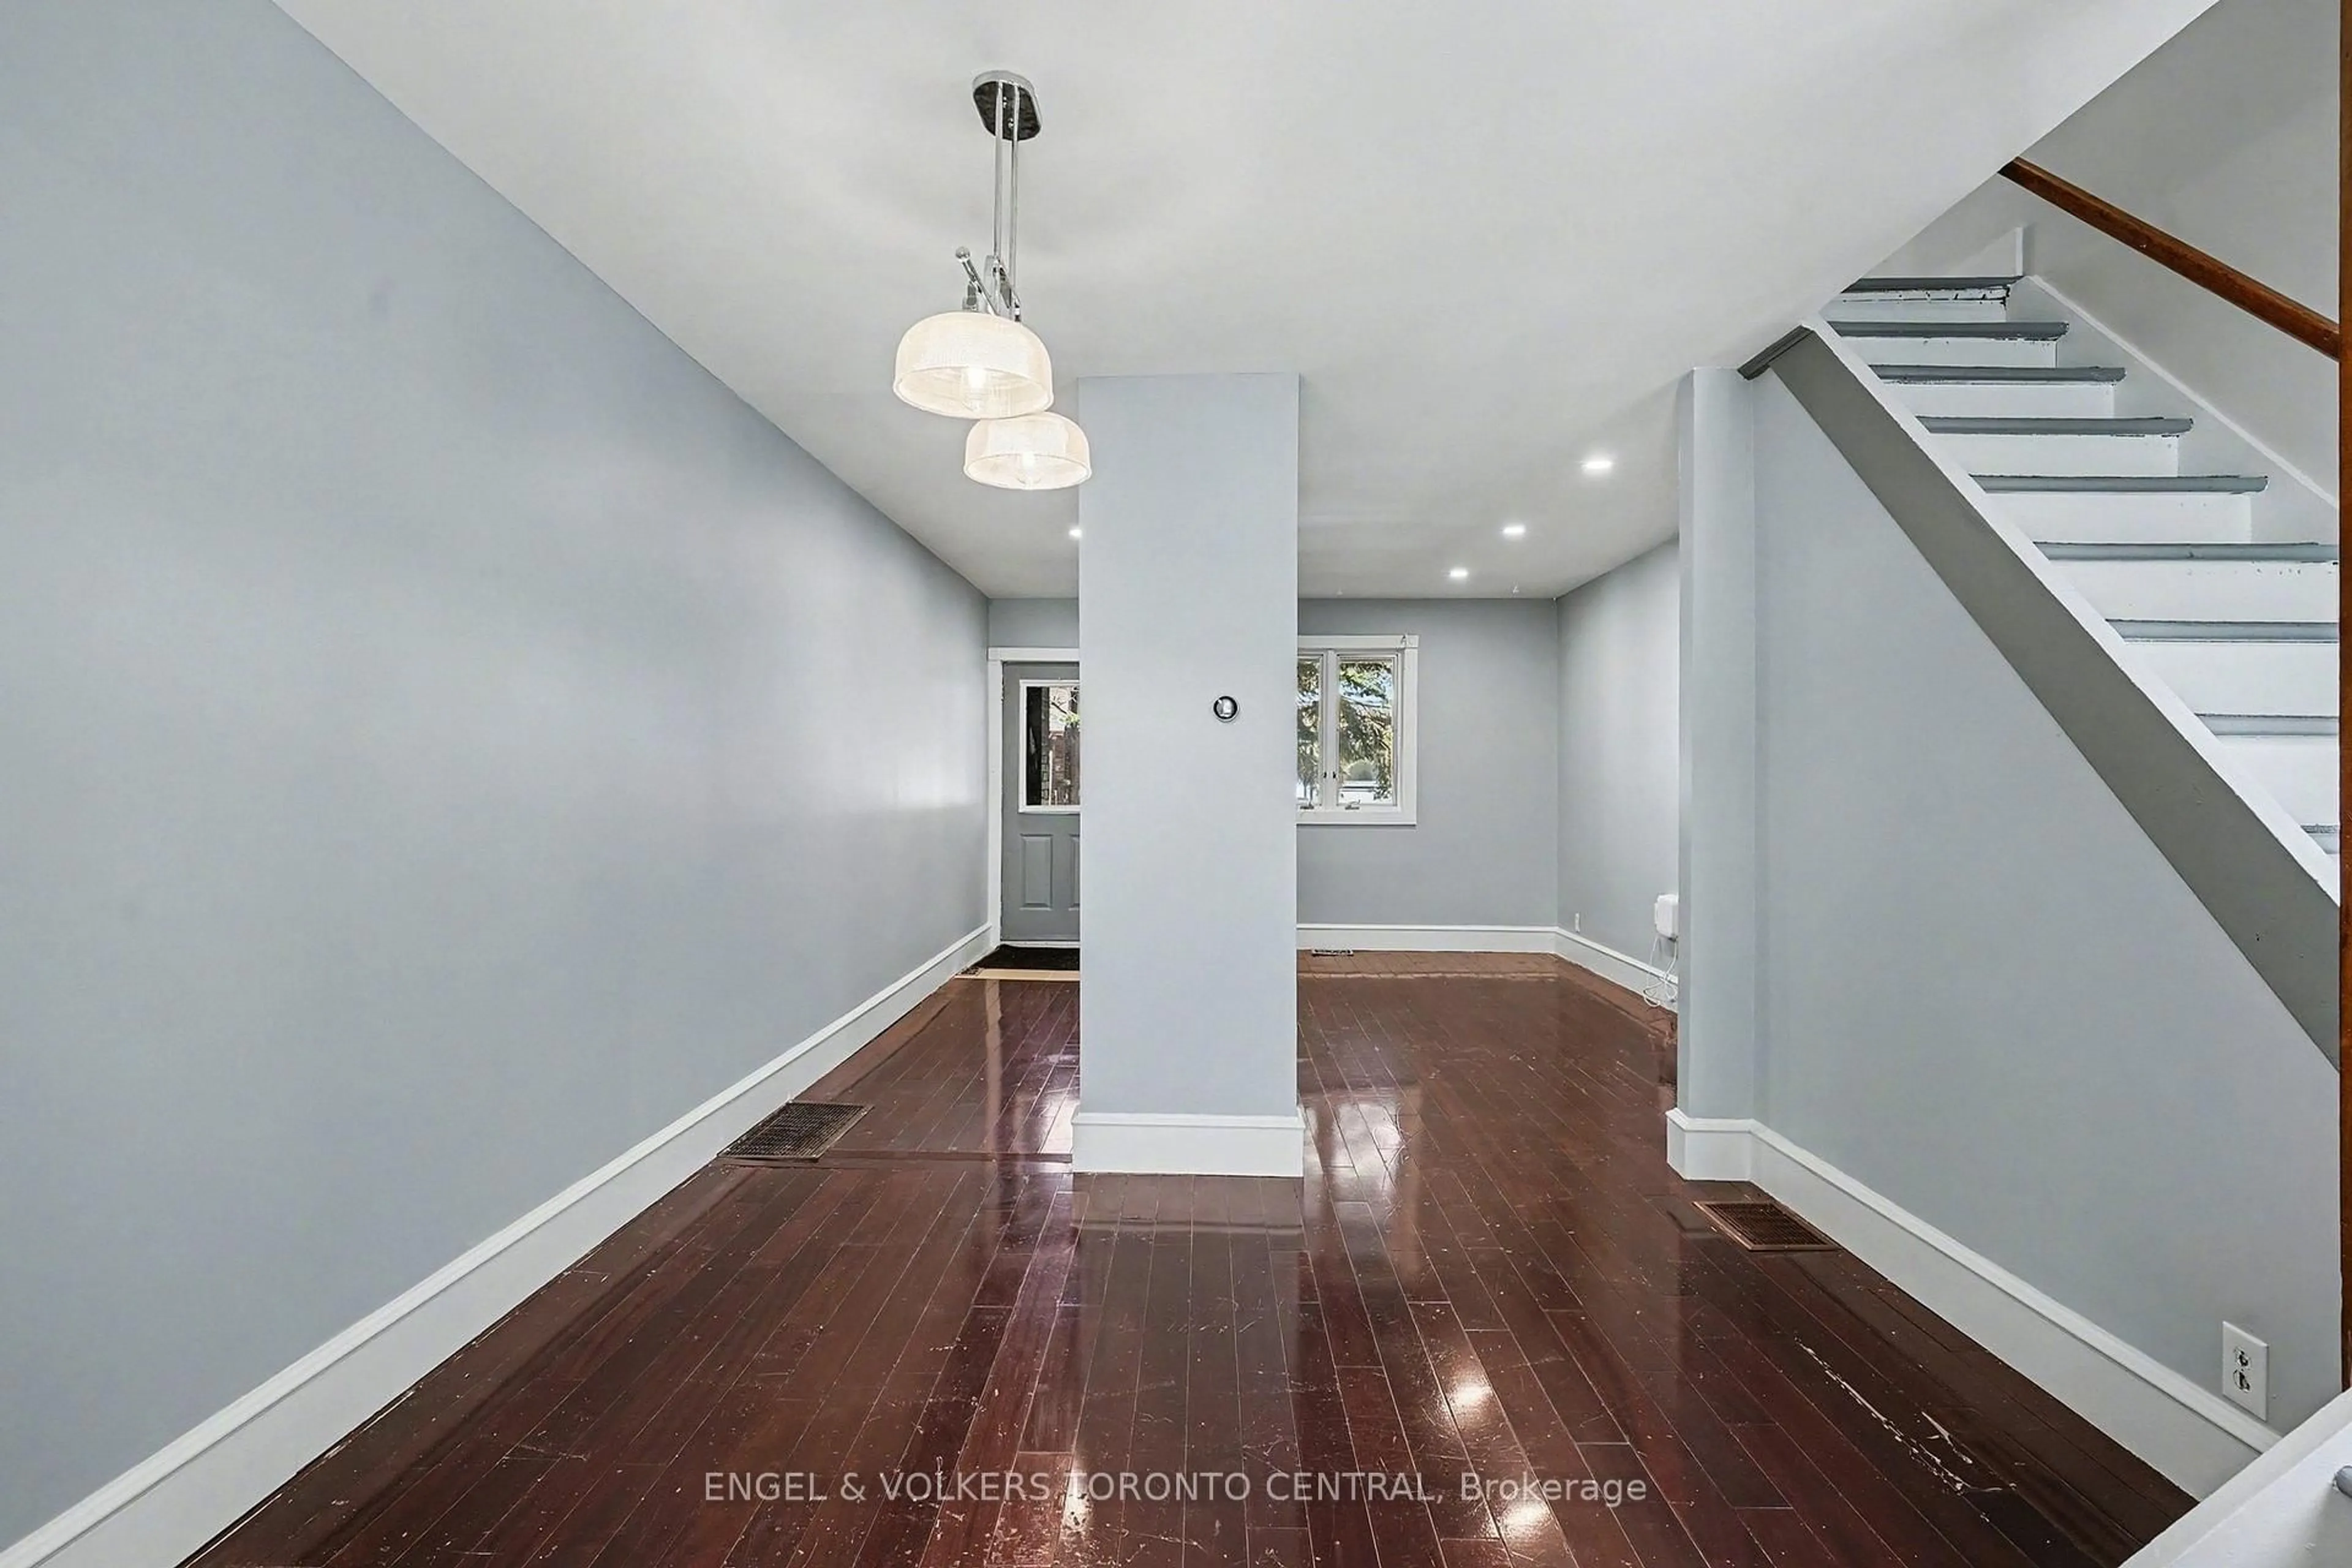
Build more live more, build your dream laneway suite. Discover this rare East End Danforth semi-detached home offering exceptional laneway house potential and modern infrastructure upgrades. Situated on a deep 144' lot, this property features: 2 spacious bedrooms on the second floor for comfort and privacy. Open-concept main floor, perfect for modern living and entertaining. Kitchen walks out to mud room with second fridge and out to large deck area with seating. Unfinished basement with the option for a 3rd bedroom or additional living space. 1 full bathroom with functional, moderate finishes -- clean and well-maintained, ready for personal upgrades. Upgraded 200amp electrical service, ensuring modern power capacity for future renovations or secondary suites. Backyard parking pad, providing convenient off-street parking while maximizing front yard space. Environmental/design survey (2023) confirming the lot meets City of Toronto zoning and bylaw requirements, including multiple blueprint options for a laneway house construction, make it "permit-ready." Located in a prime East York neighbourhood near transit, shops, and schools, this home is ideal for buyers looking for a property with future expansion potential, strong lot depth, and convenient parking -- all within an established community.
Property Details
Interior
Features
2nd Floor
Primary
4.2 x 4.2Closet / hardwood floor / Pot Lights
2nd Br
3.1 x 3.0Closet / hardwood floor / Large Window
Exterior
Features
Parking
Garage spaces -
Garage type -
Total parking spaces 2
Property History
 27
27