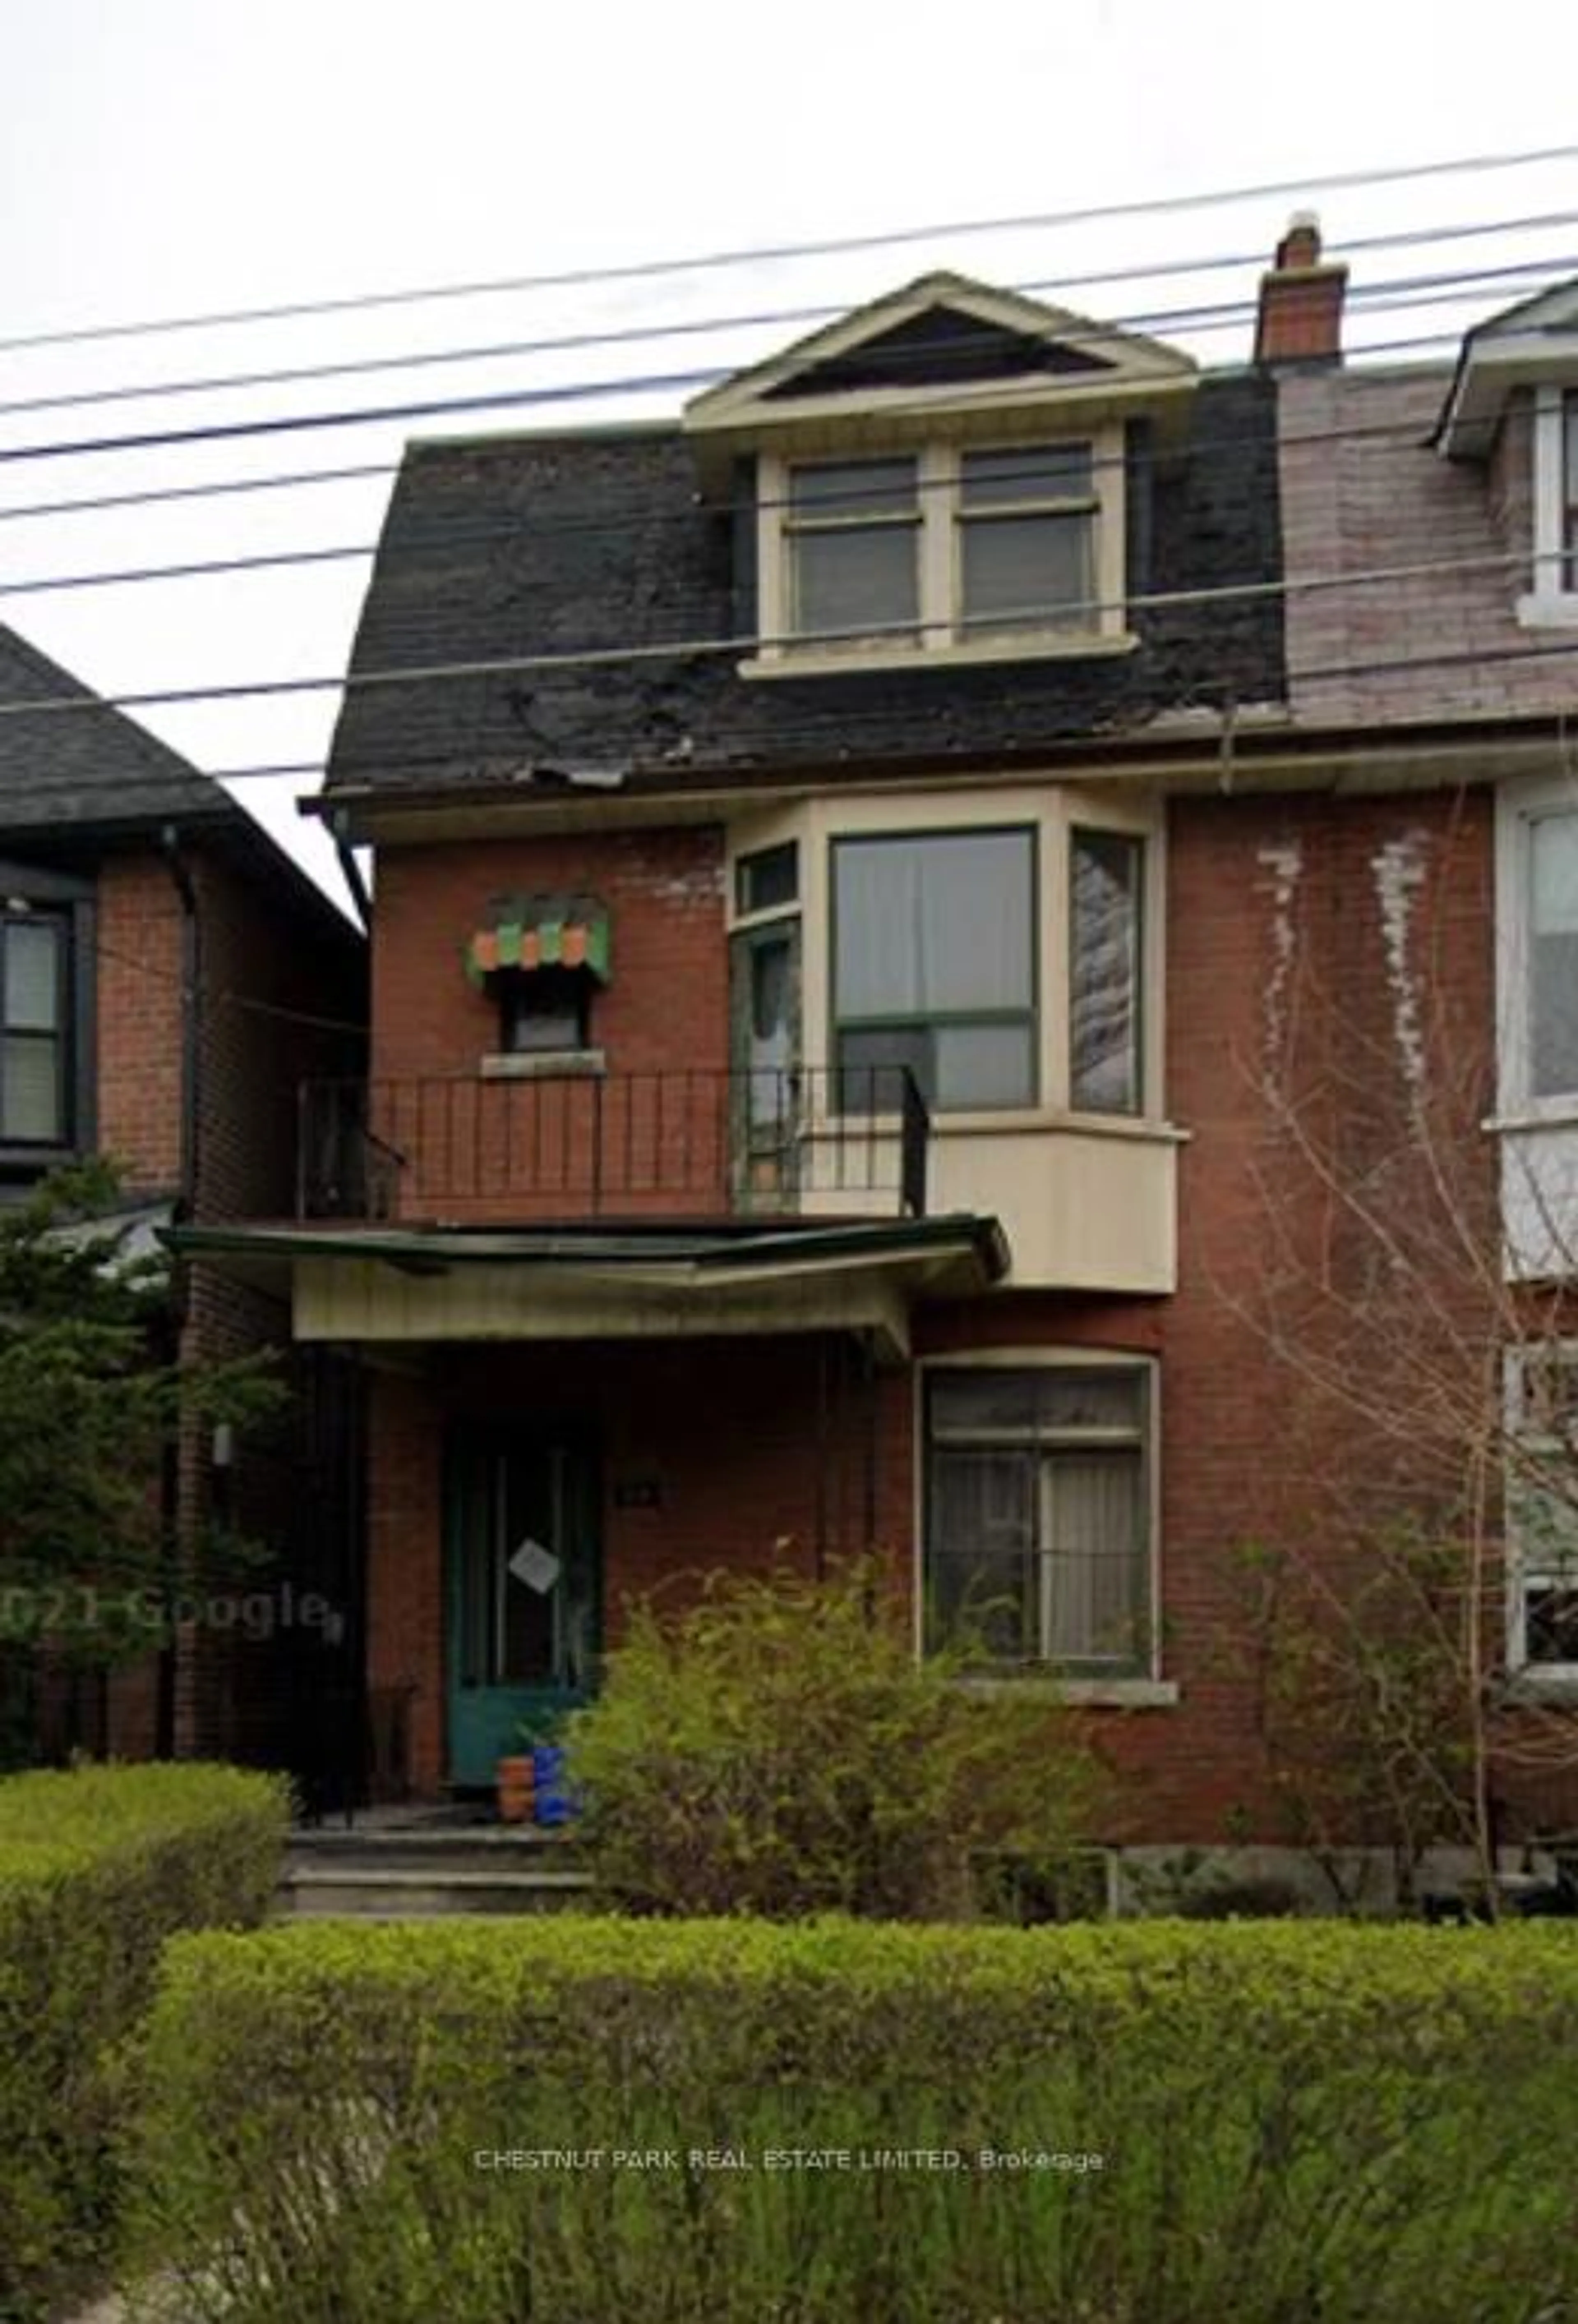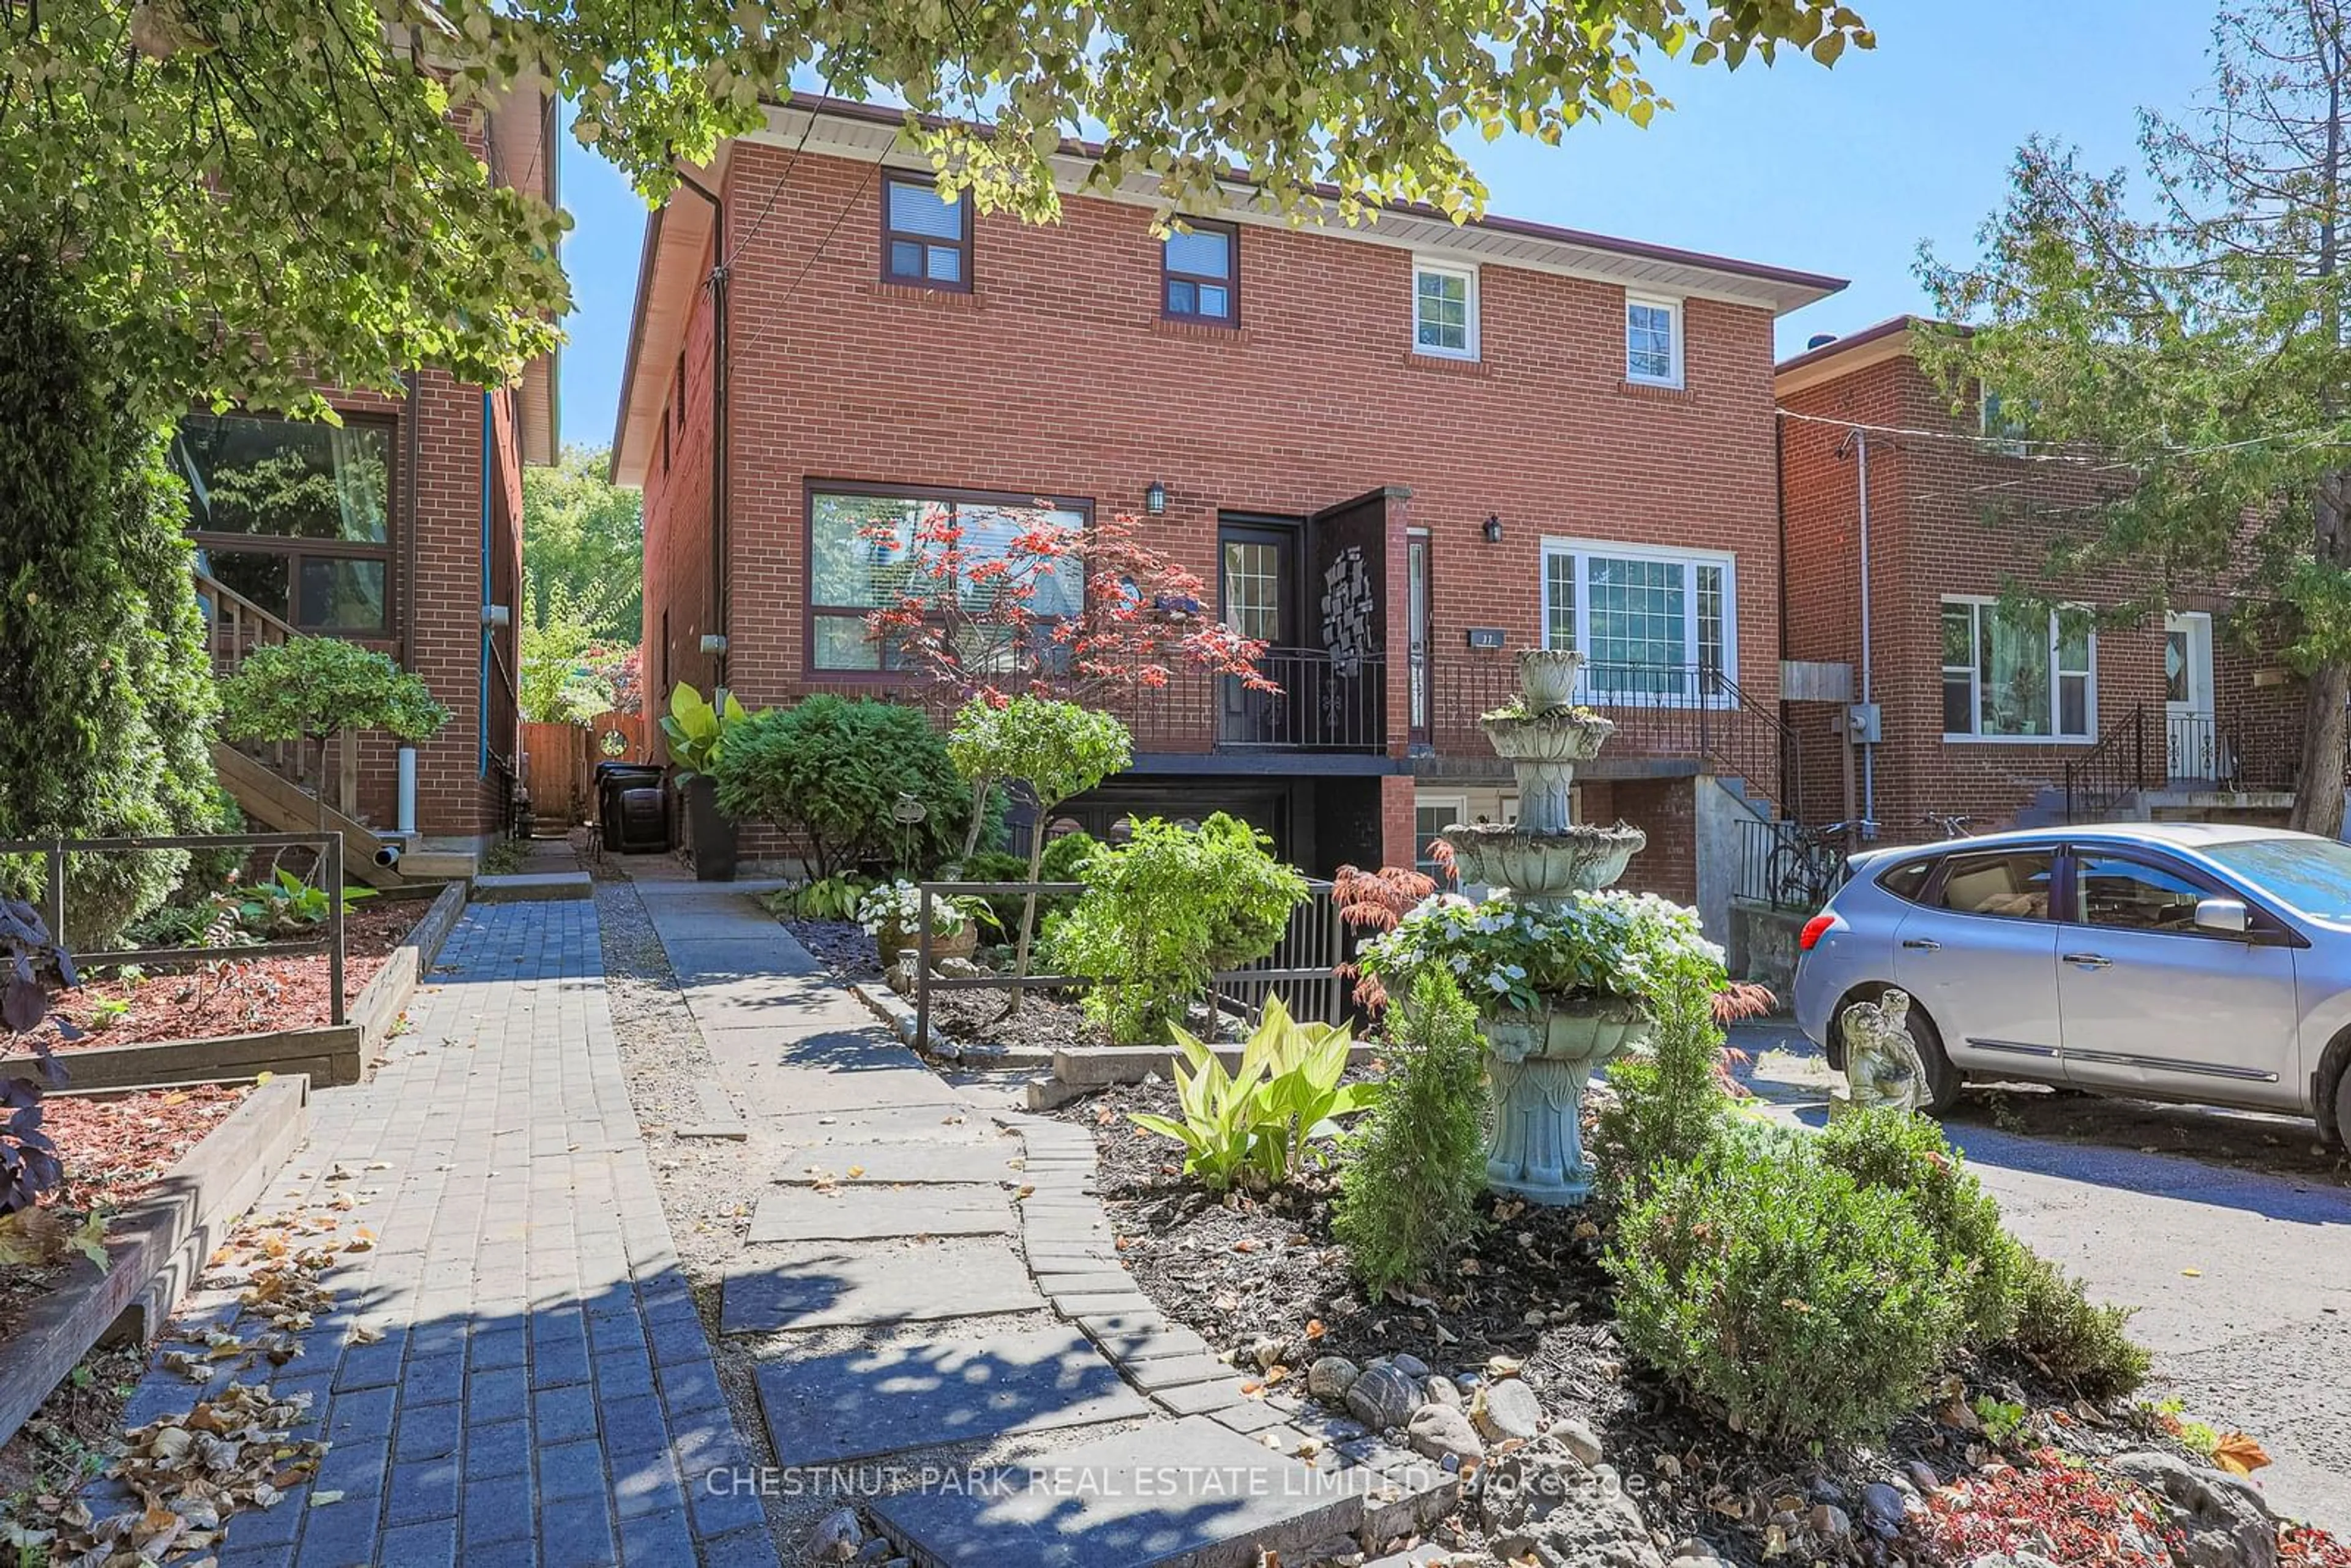
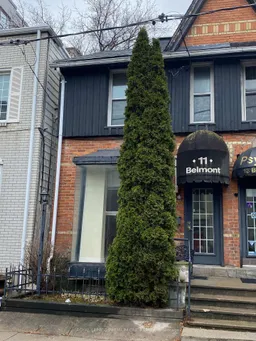
11 BELMONT St, Toronto, Ontario M5R 1P9
Contact us about this property
Highlights
Estimated ValueThis is the price Wahi expects this property to sell for.
The calculation is powered by our Instant Home Value Estimate, which uses current market and property price trends to estimate your home’s value with a 90% accuracy rate.Not available
Price/Sqft$1,401/sqft
Est. Mortgage$5,148/mo
Tax Amount (2024)$5,200/yr
Days On Market6 days
Description
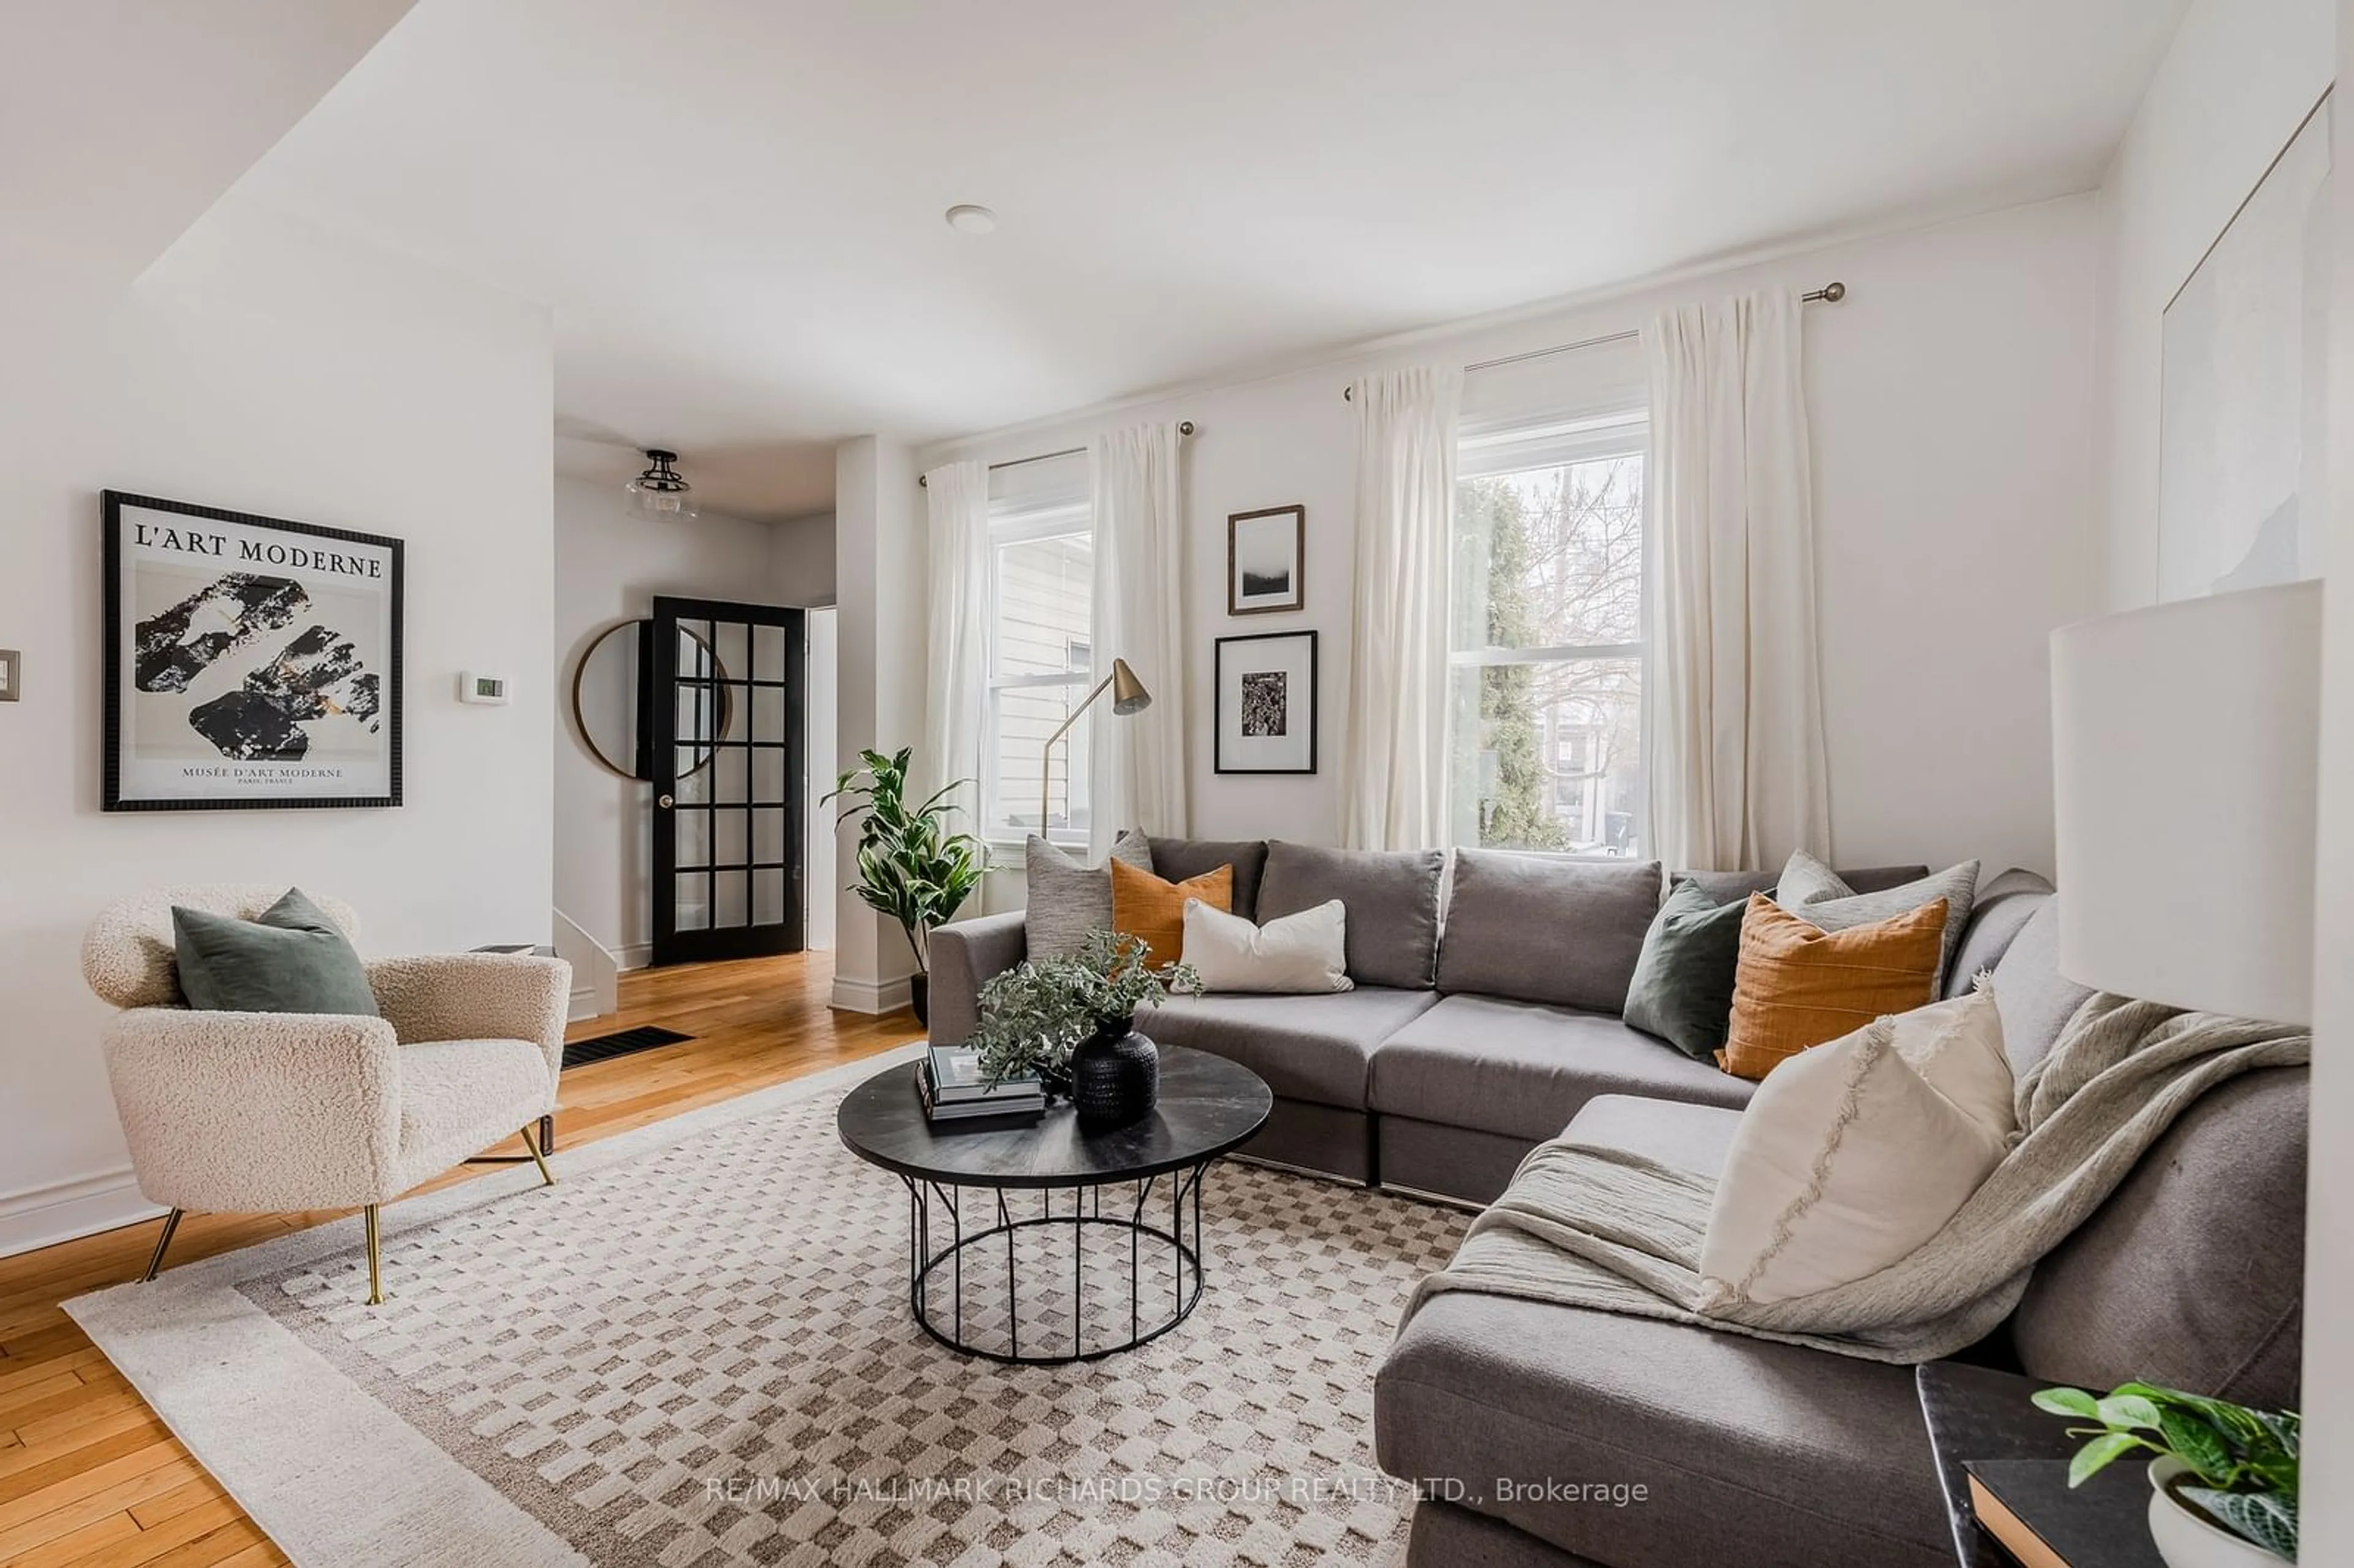
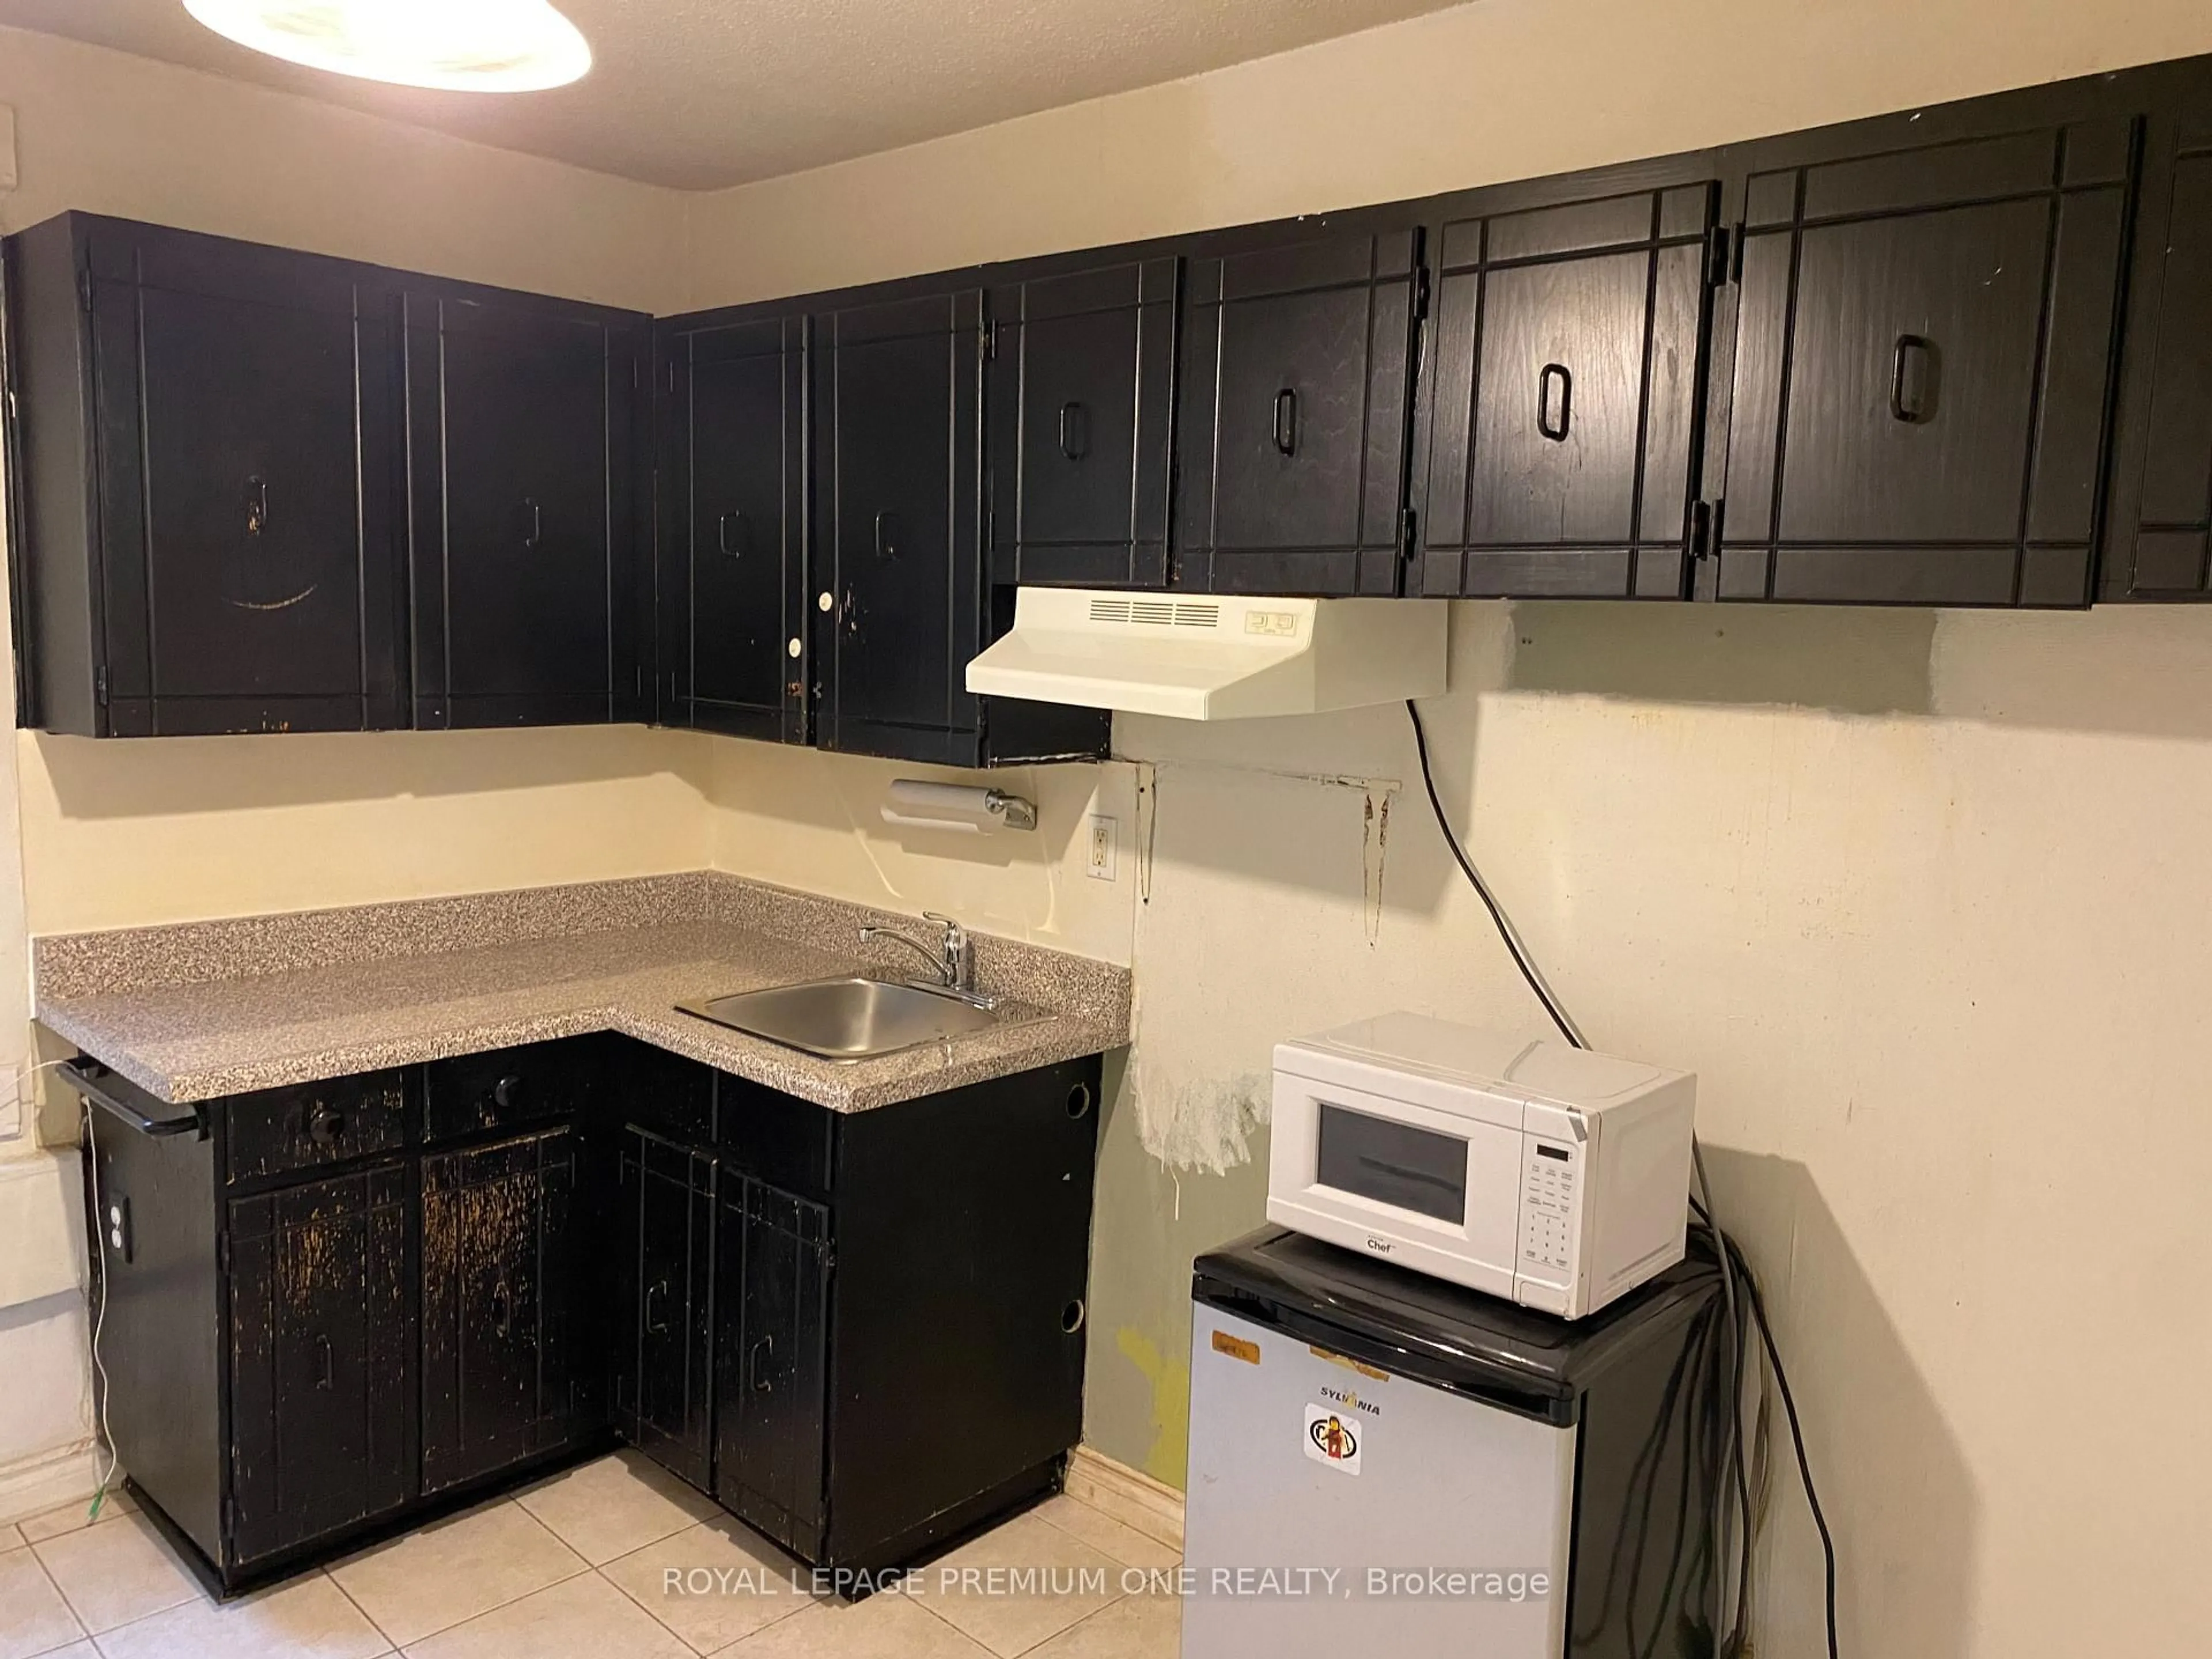
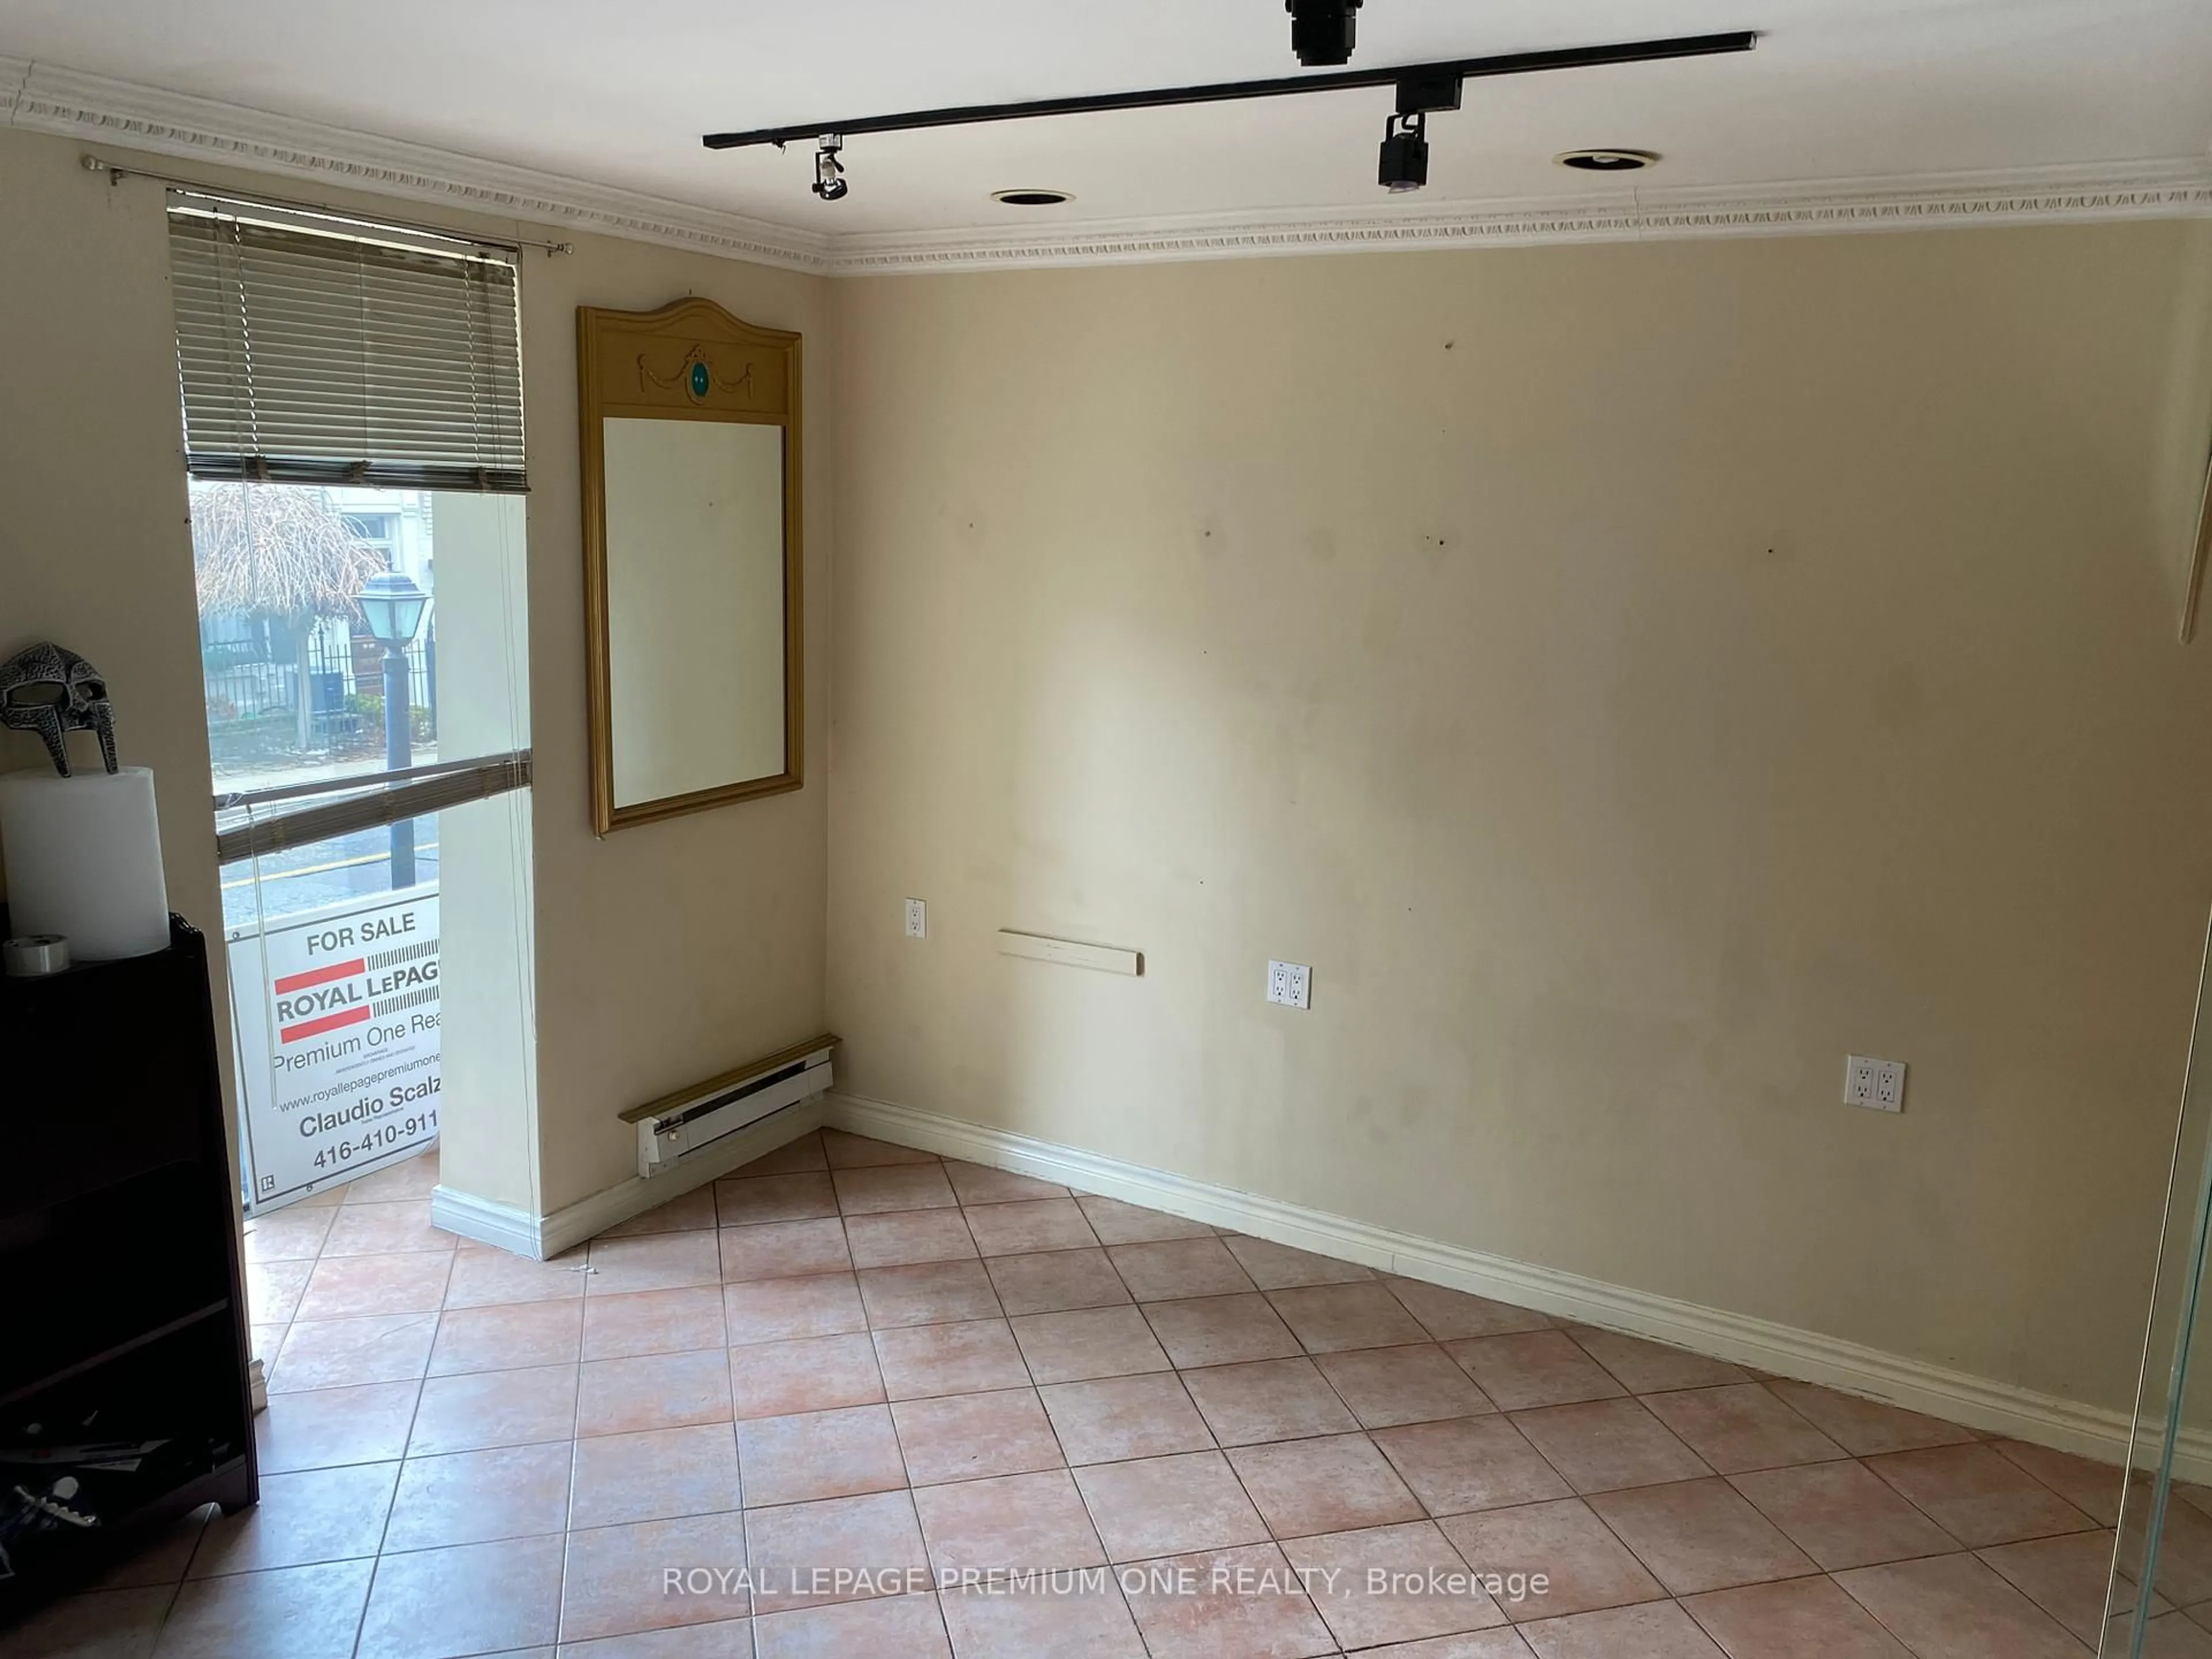
Location! Location! Location! 11 Belmont street presents an amazing opportunity for an investor or end user. Zoned for both commercial and residential in the heart of Yorkville/Forest Hill! Solid building, great area for many uses including, salon, professional office for boutique office use- accountant lawyer, insurance broker, Or choose to live there and enjoy all that Yorkville, with it's chic boutiques & high end living has to offer!
Property Details
Interior
Features
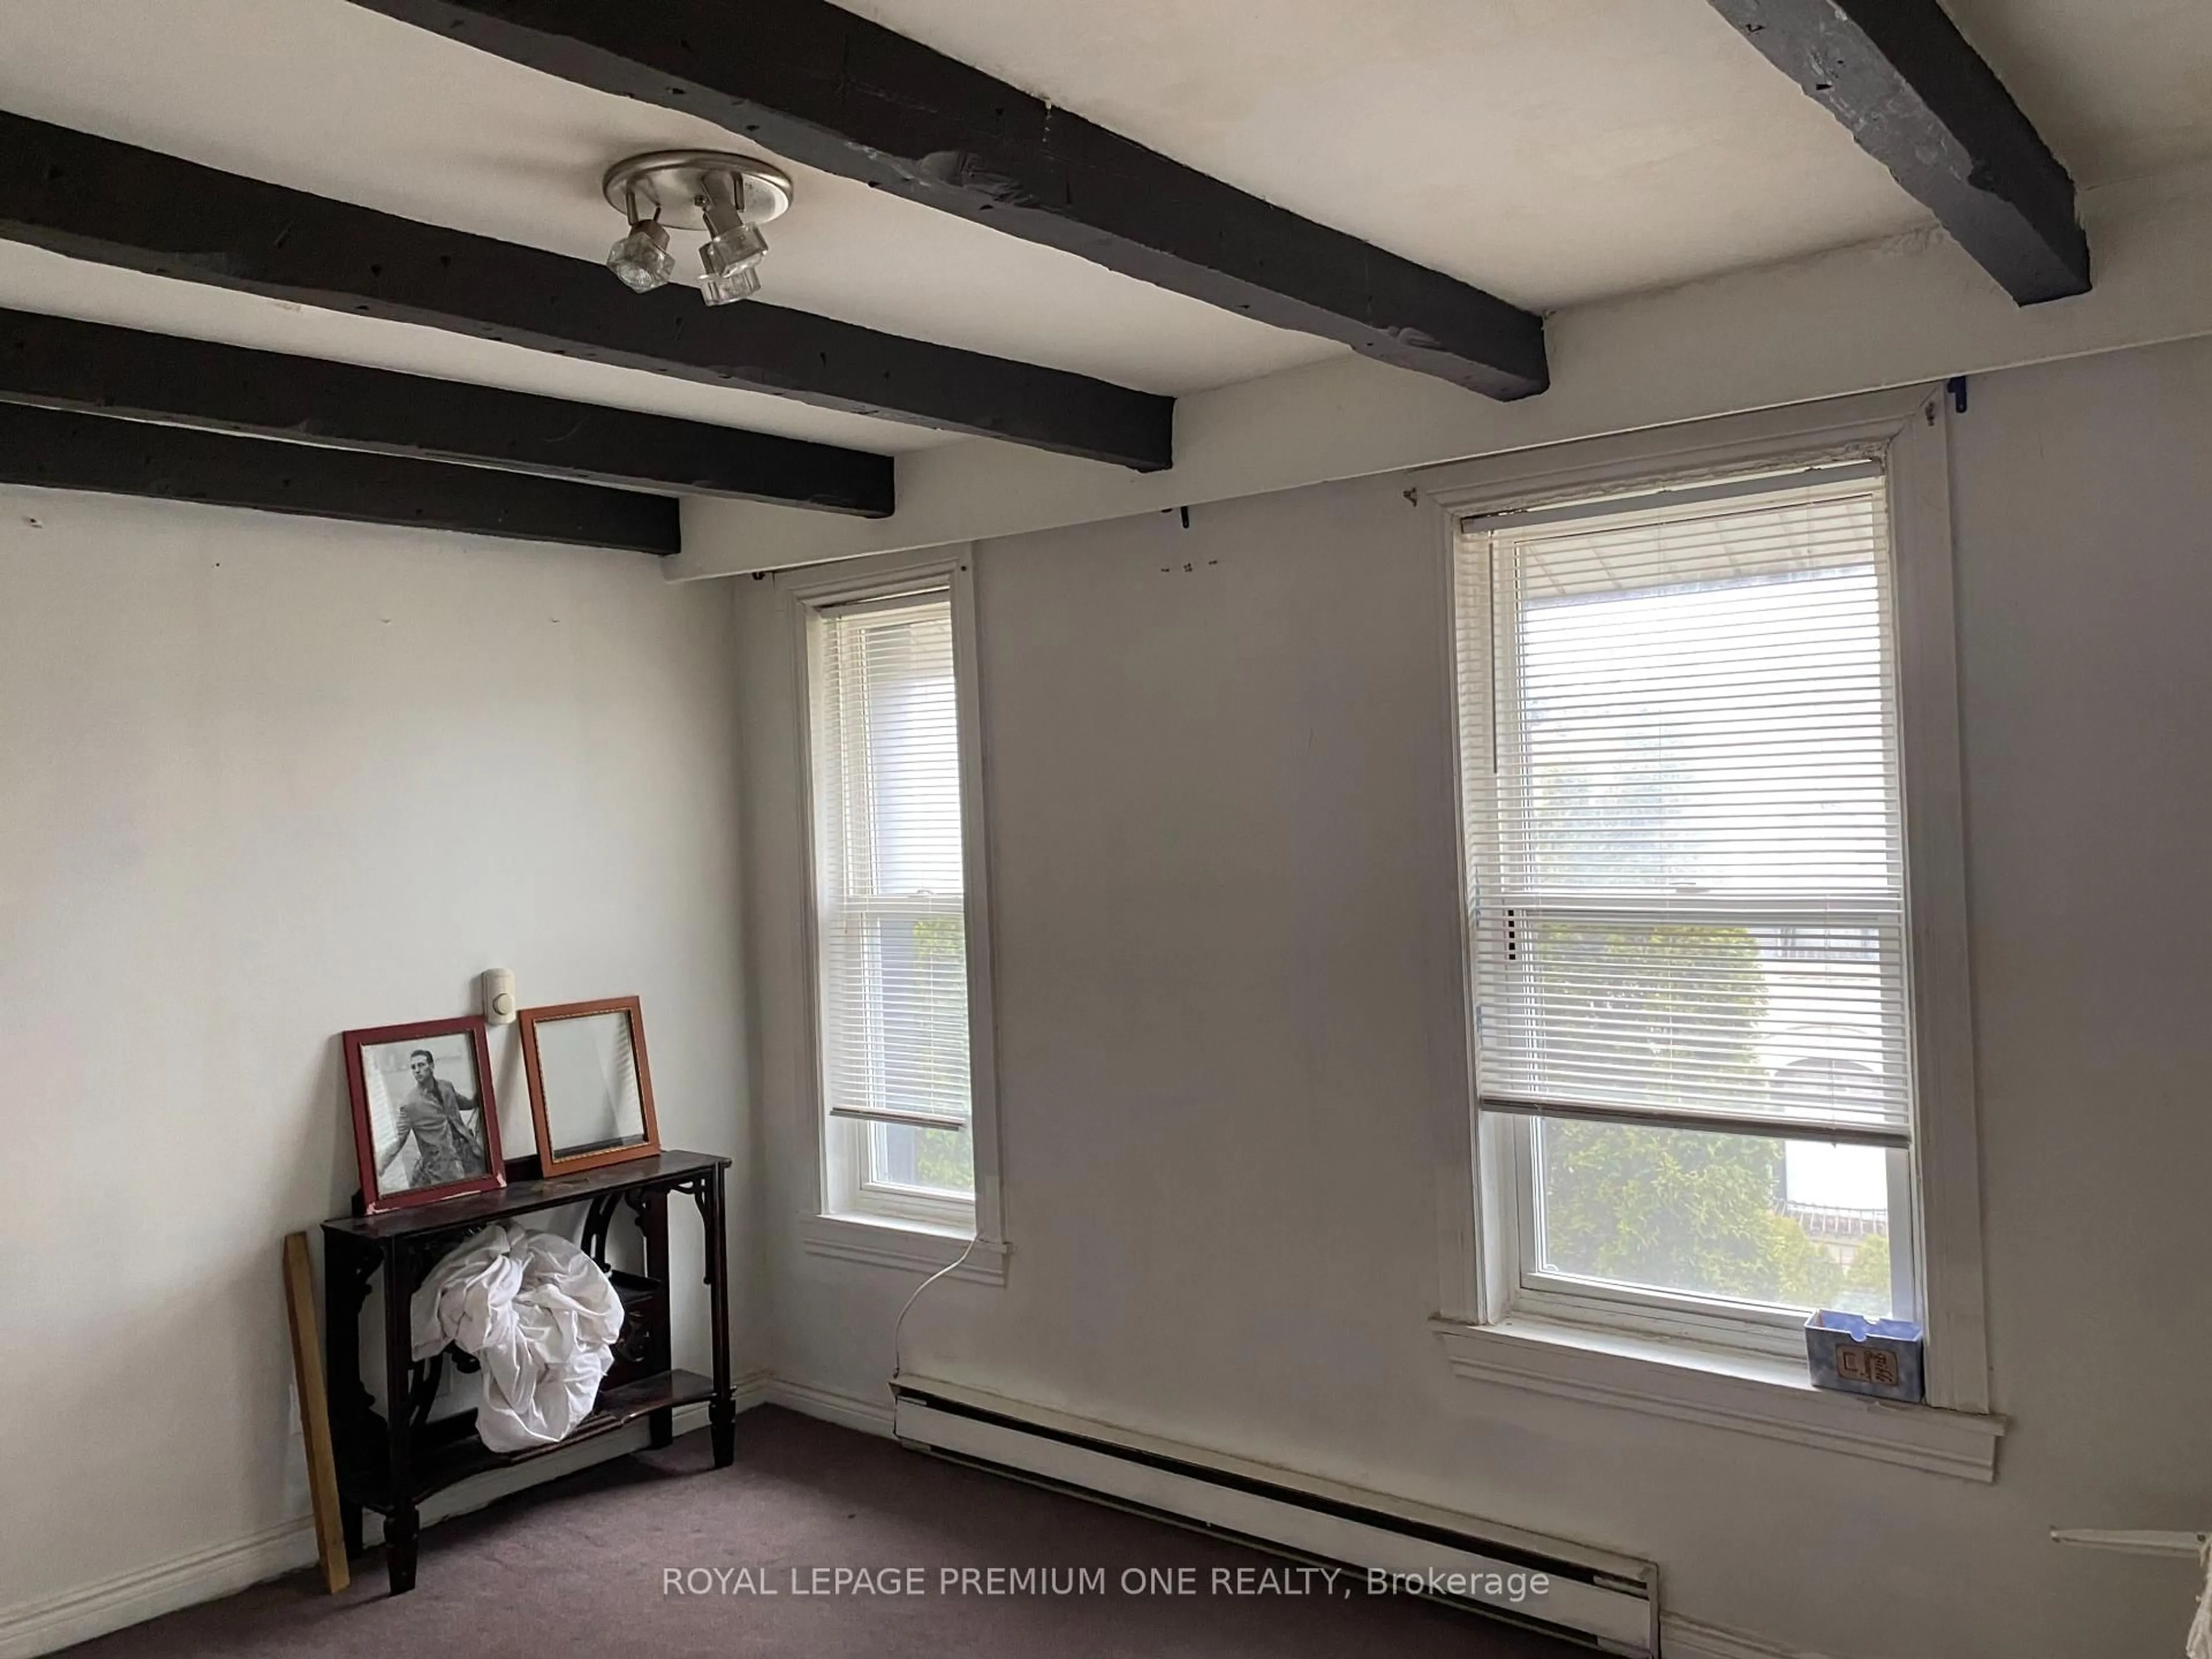
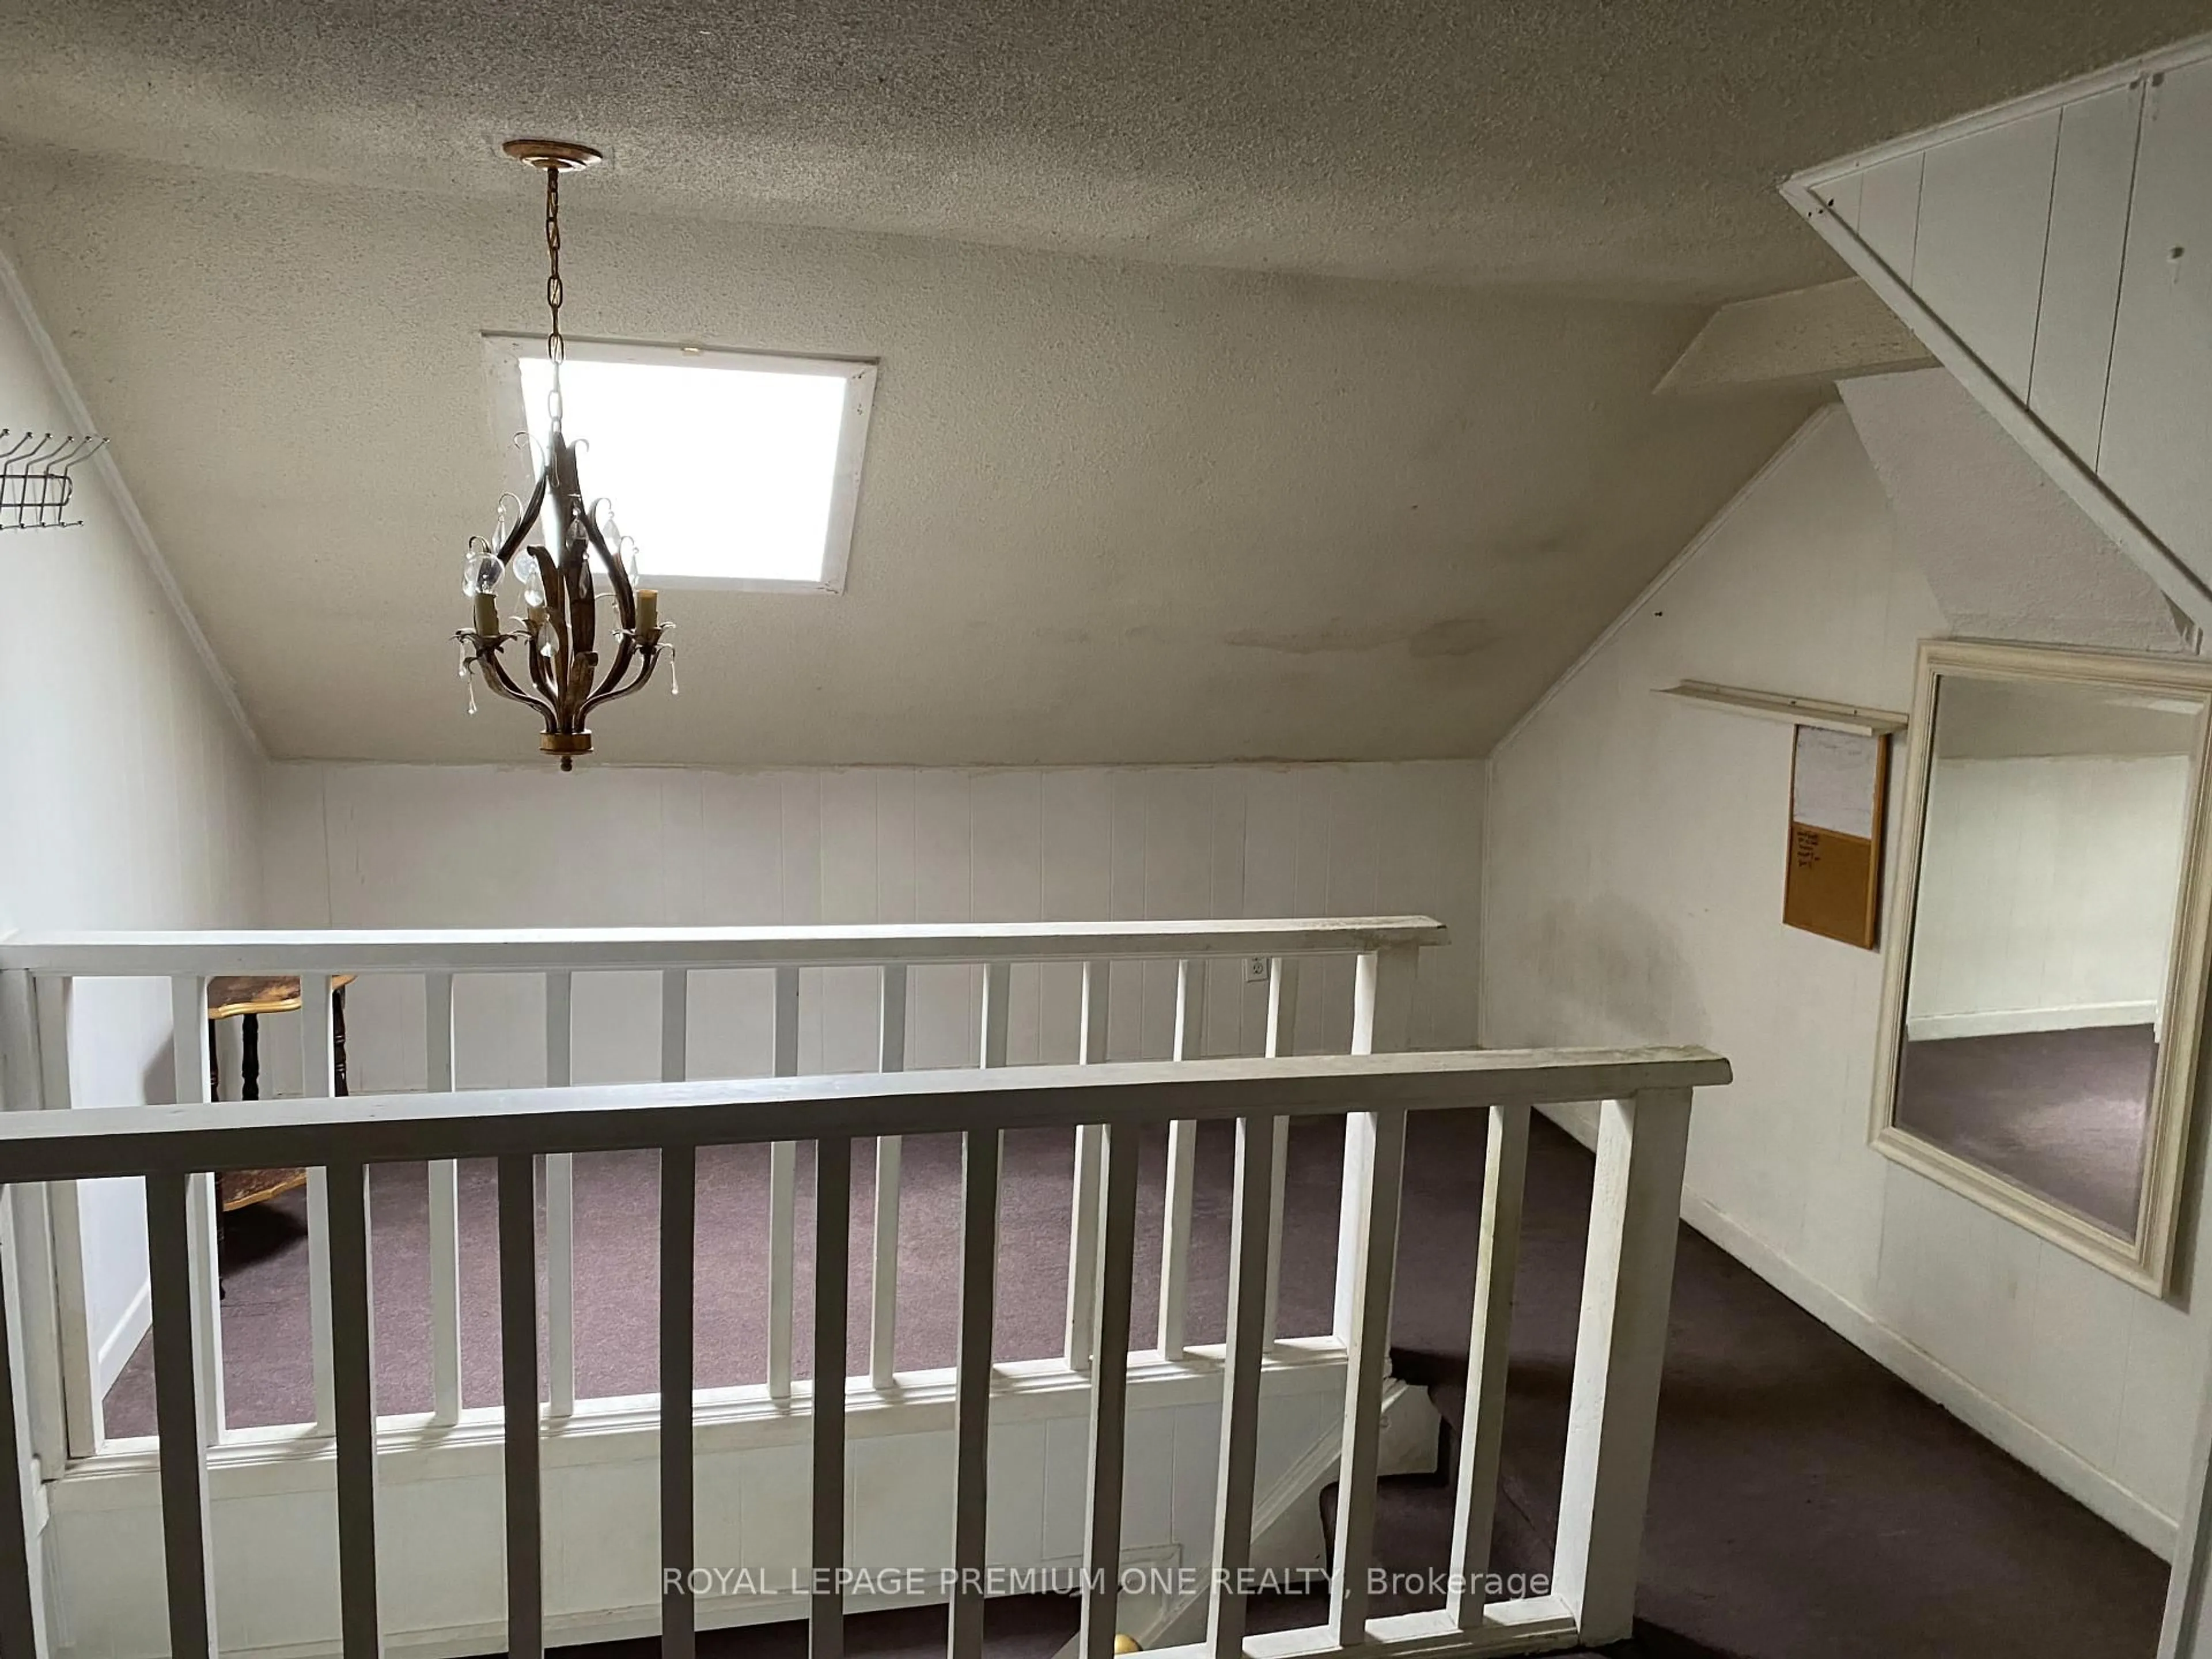
3rd Floor
2nd Br
4.0 x 3.29carpet free / Window
Exterior
Features
Property History
 8
8Get up to 1% cashback when you buy your dream home with Wahi Cashback

A new way to buy a home that puts cash back in your pocket.
- Our in-house Realtors do more deals and bring that negotiating power into your corner
- We leverage technology to get you more insights, move faster and simplify the process
- Our digital business model means we pass the savings onto you, with up to 1% cashback on the purchase of your home