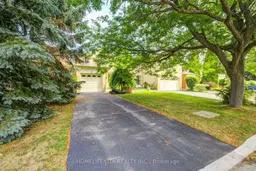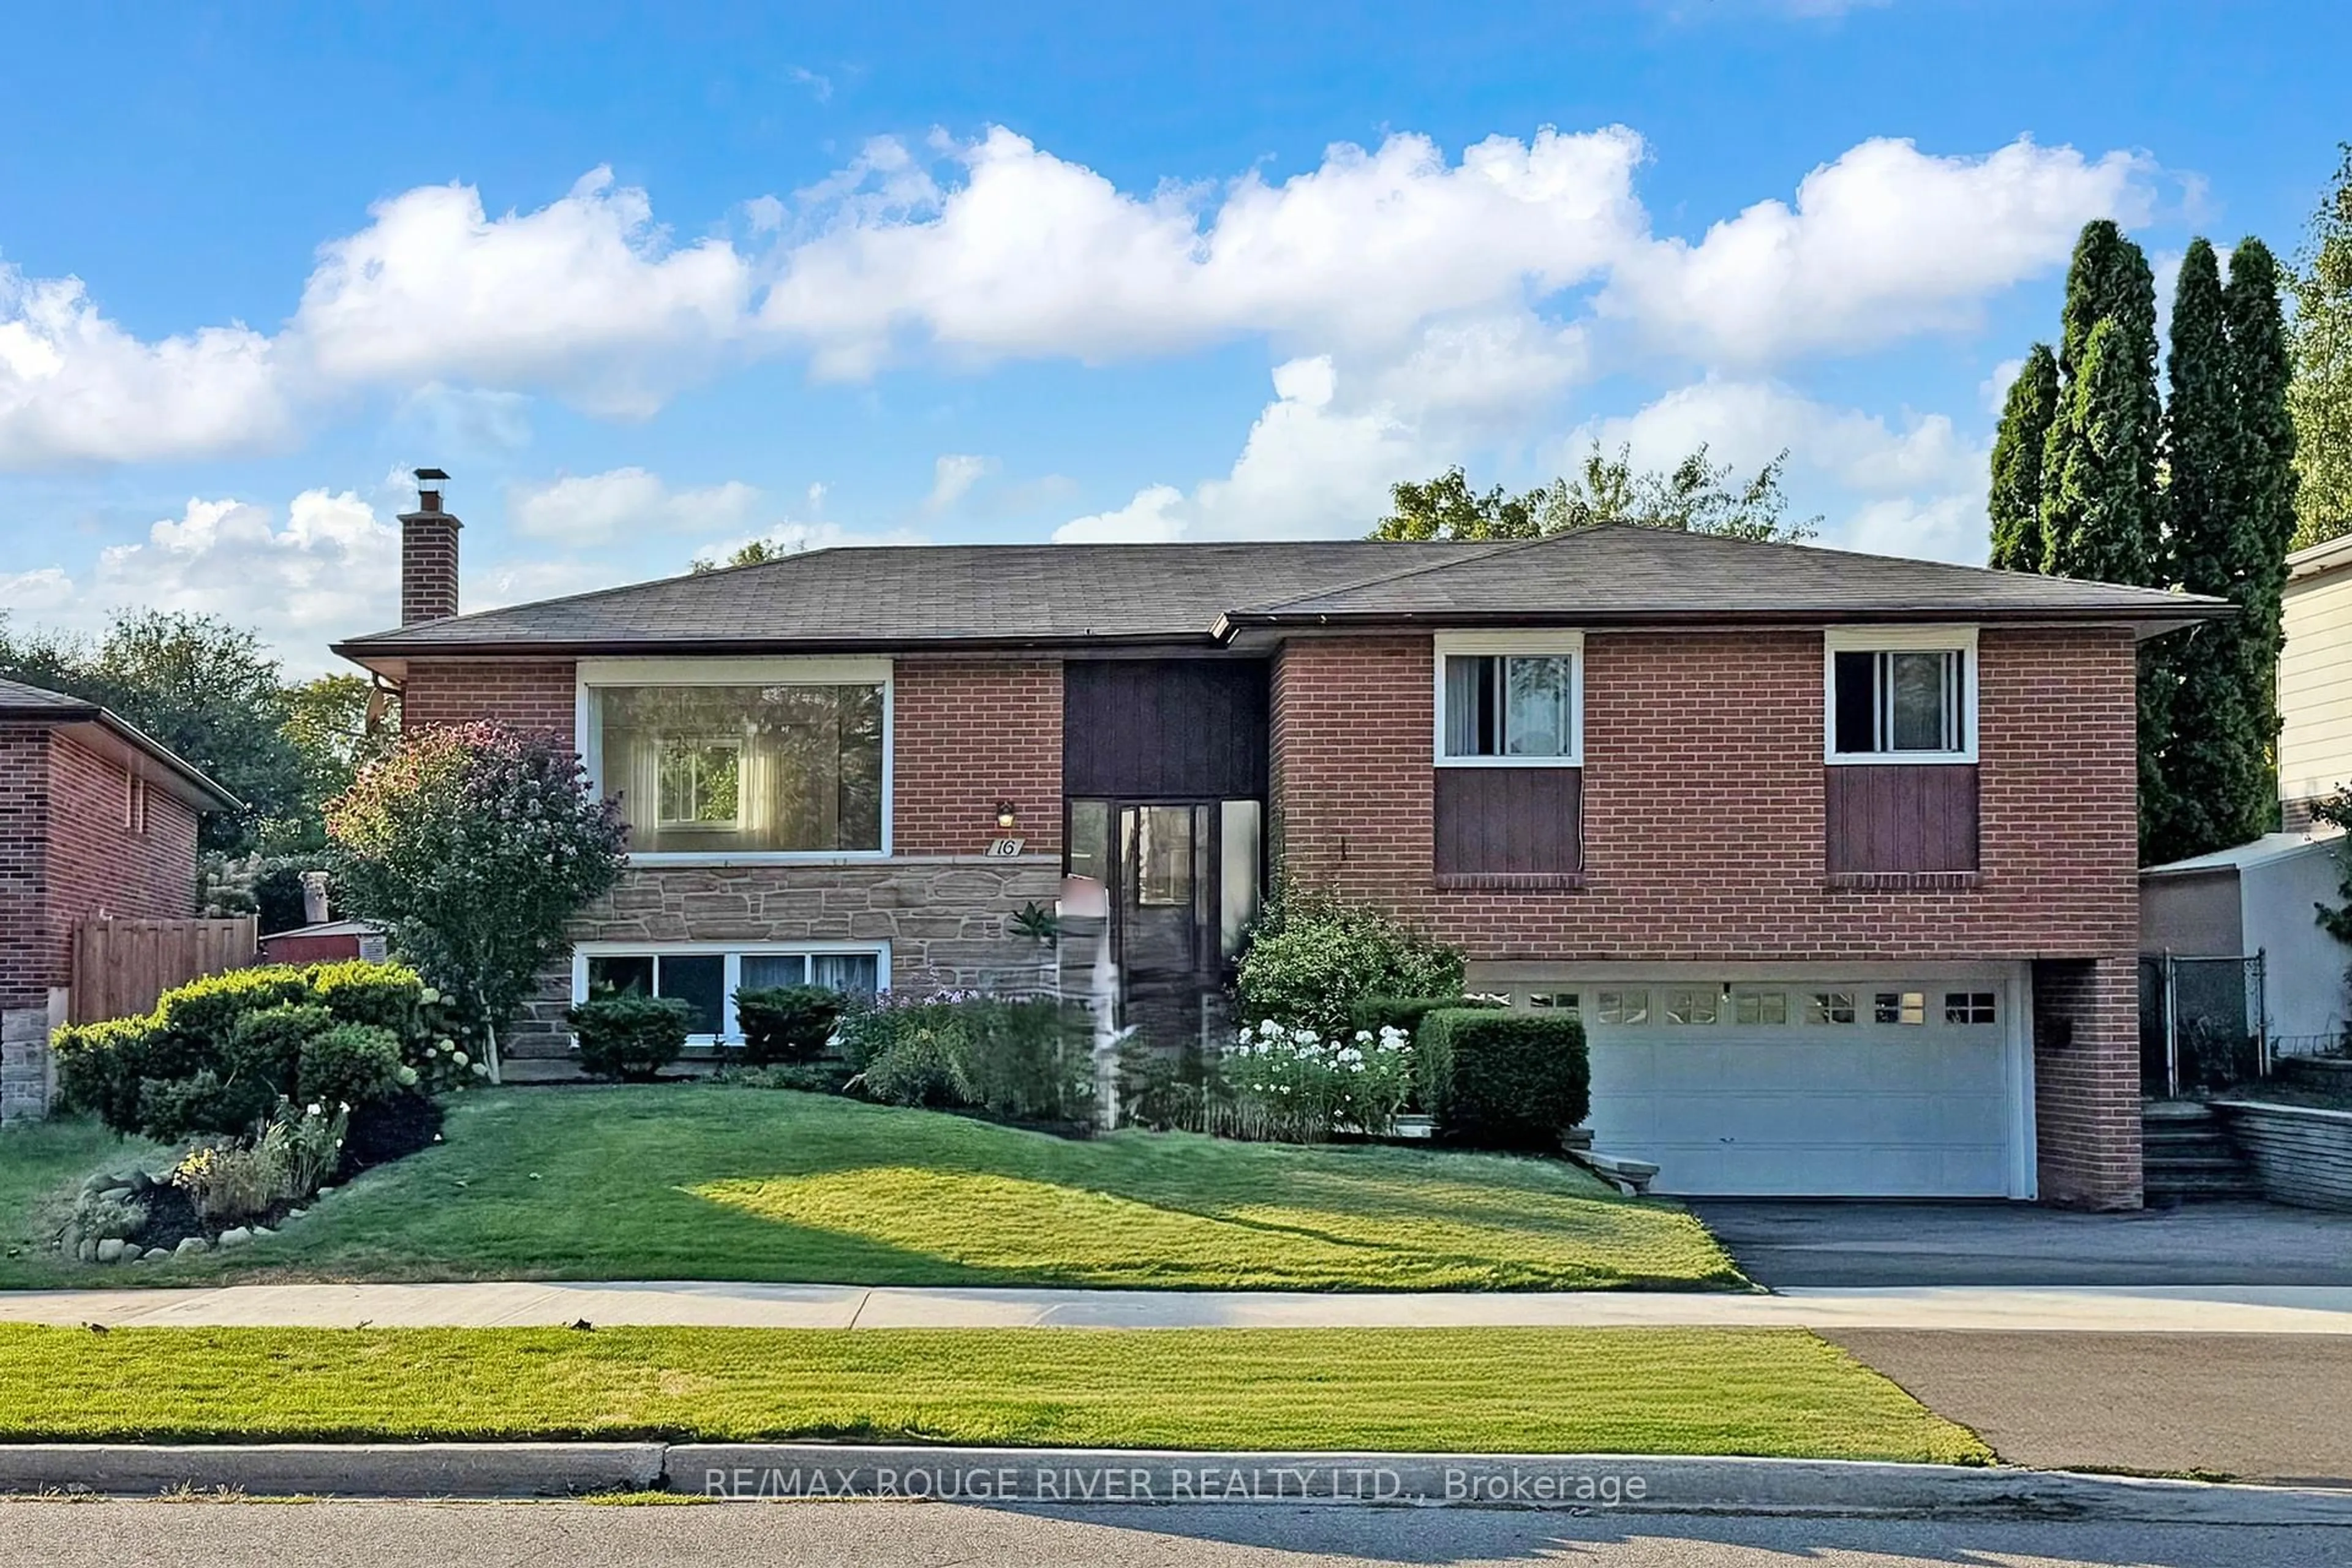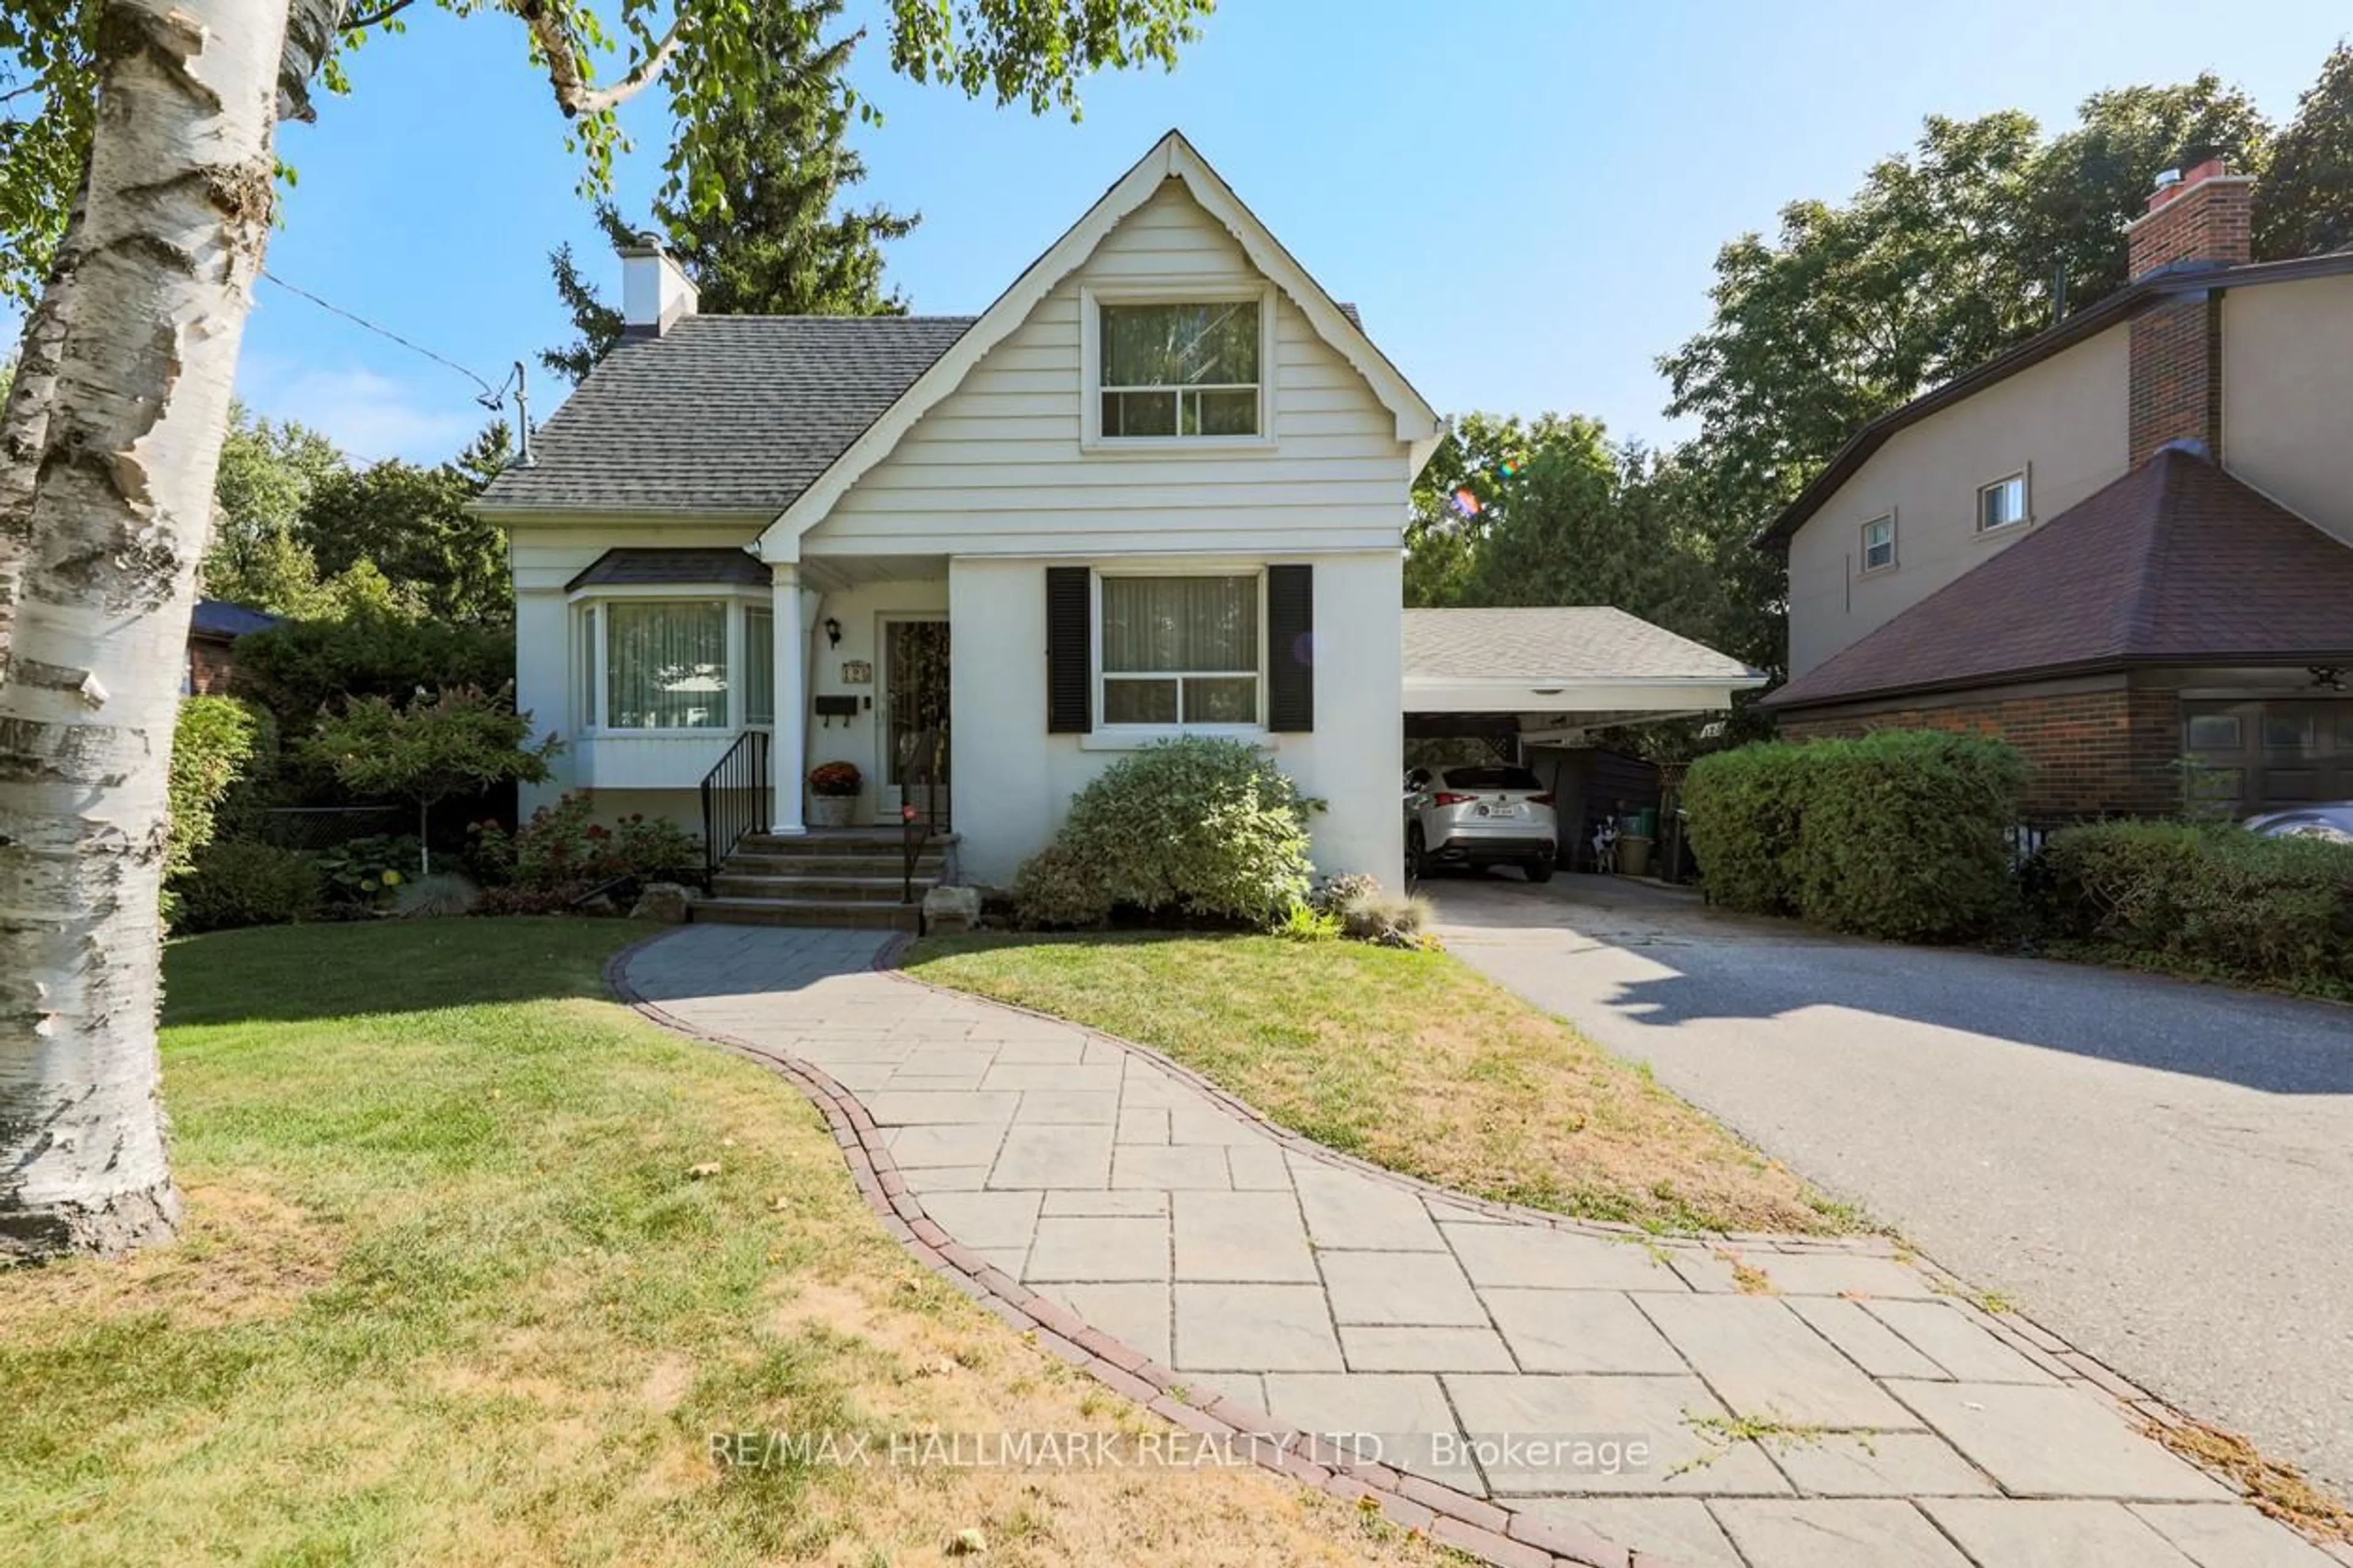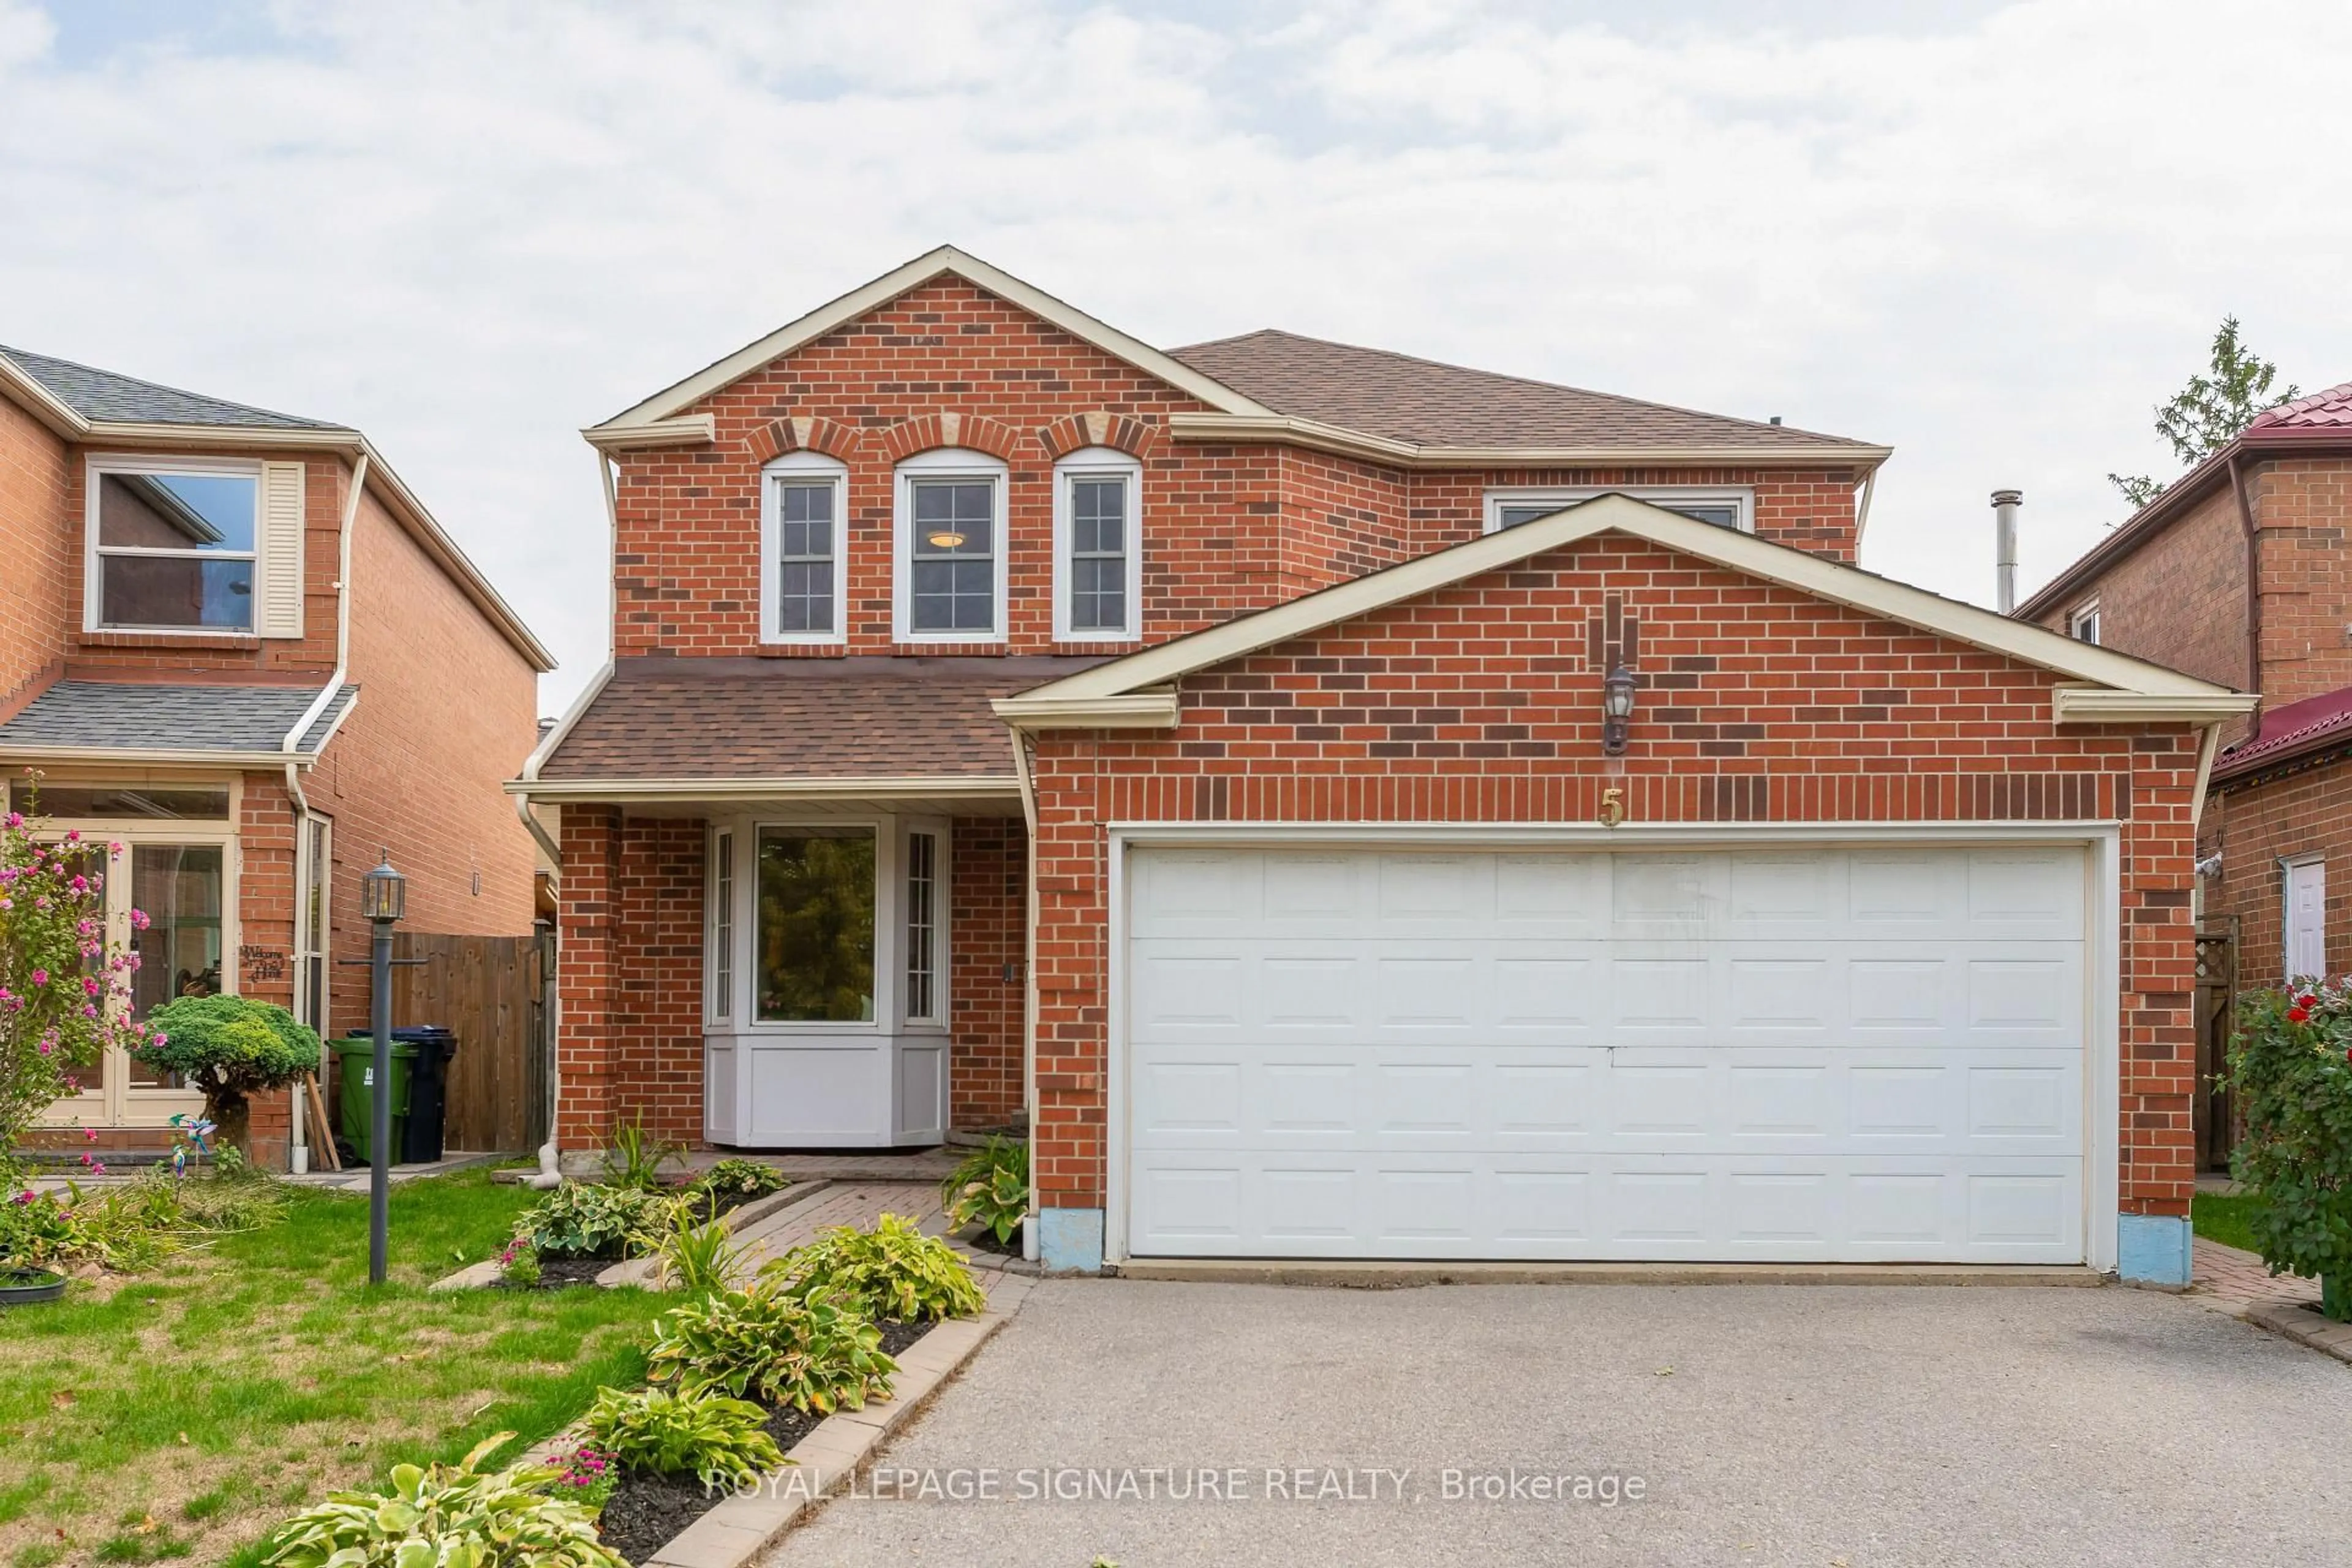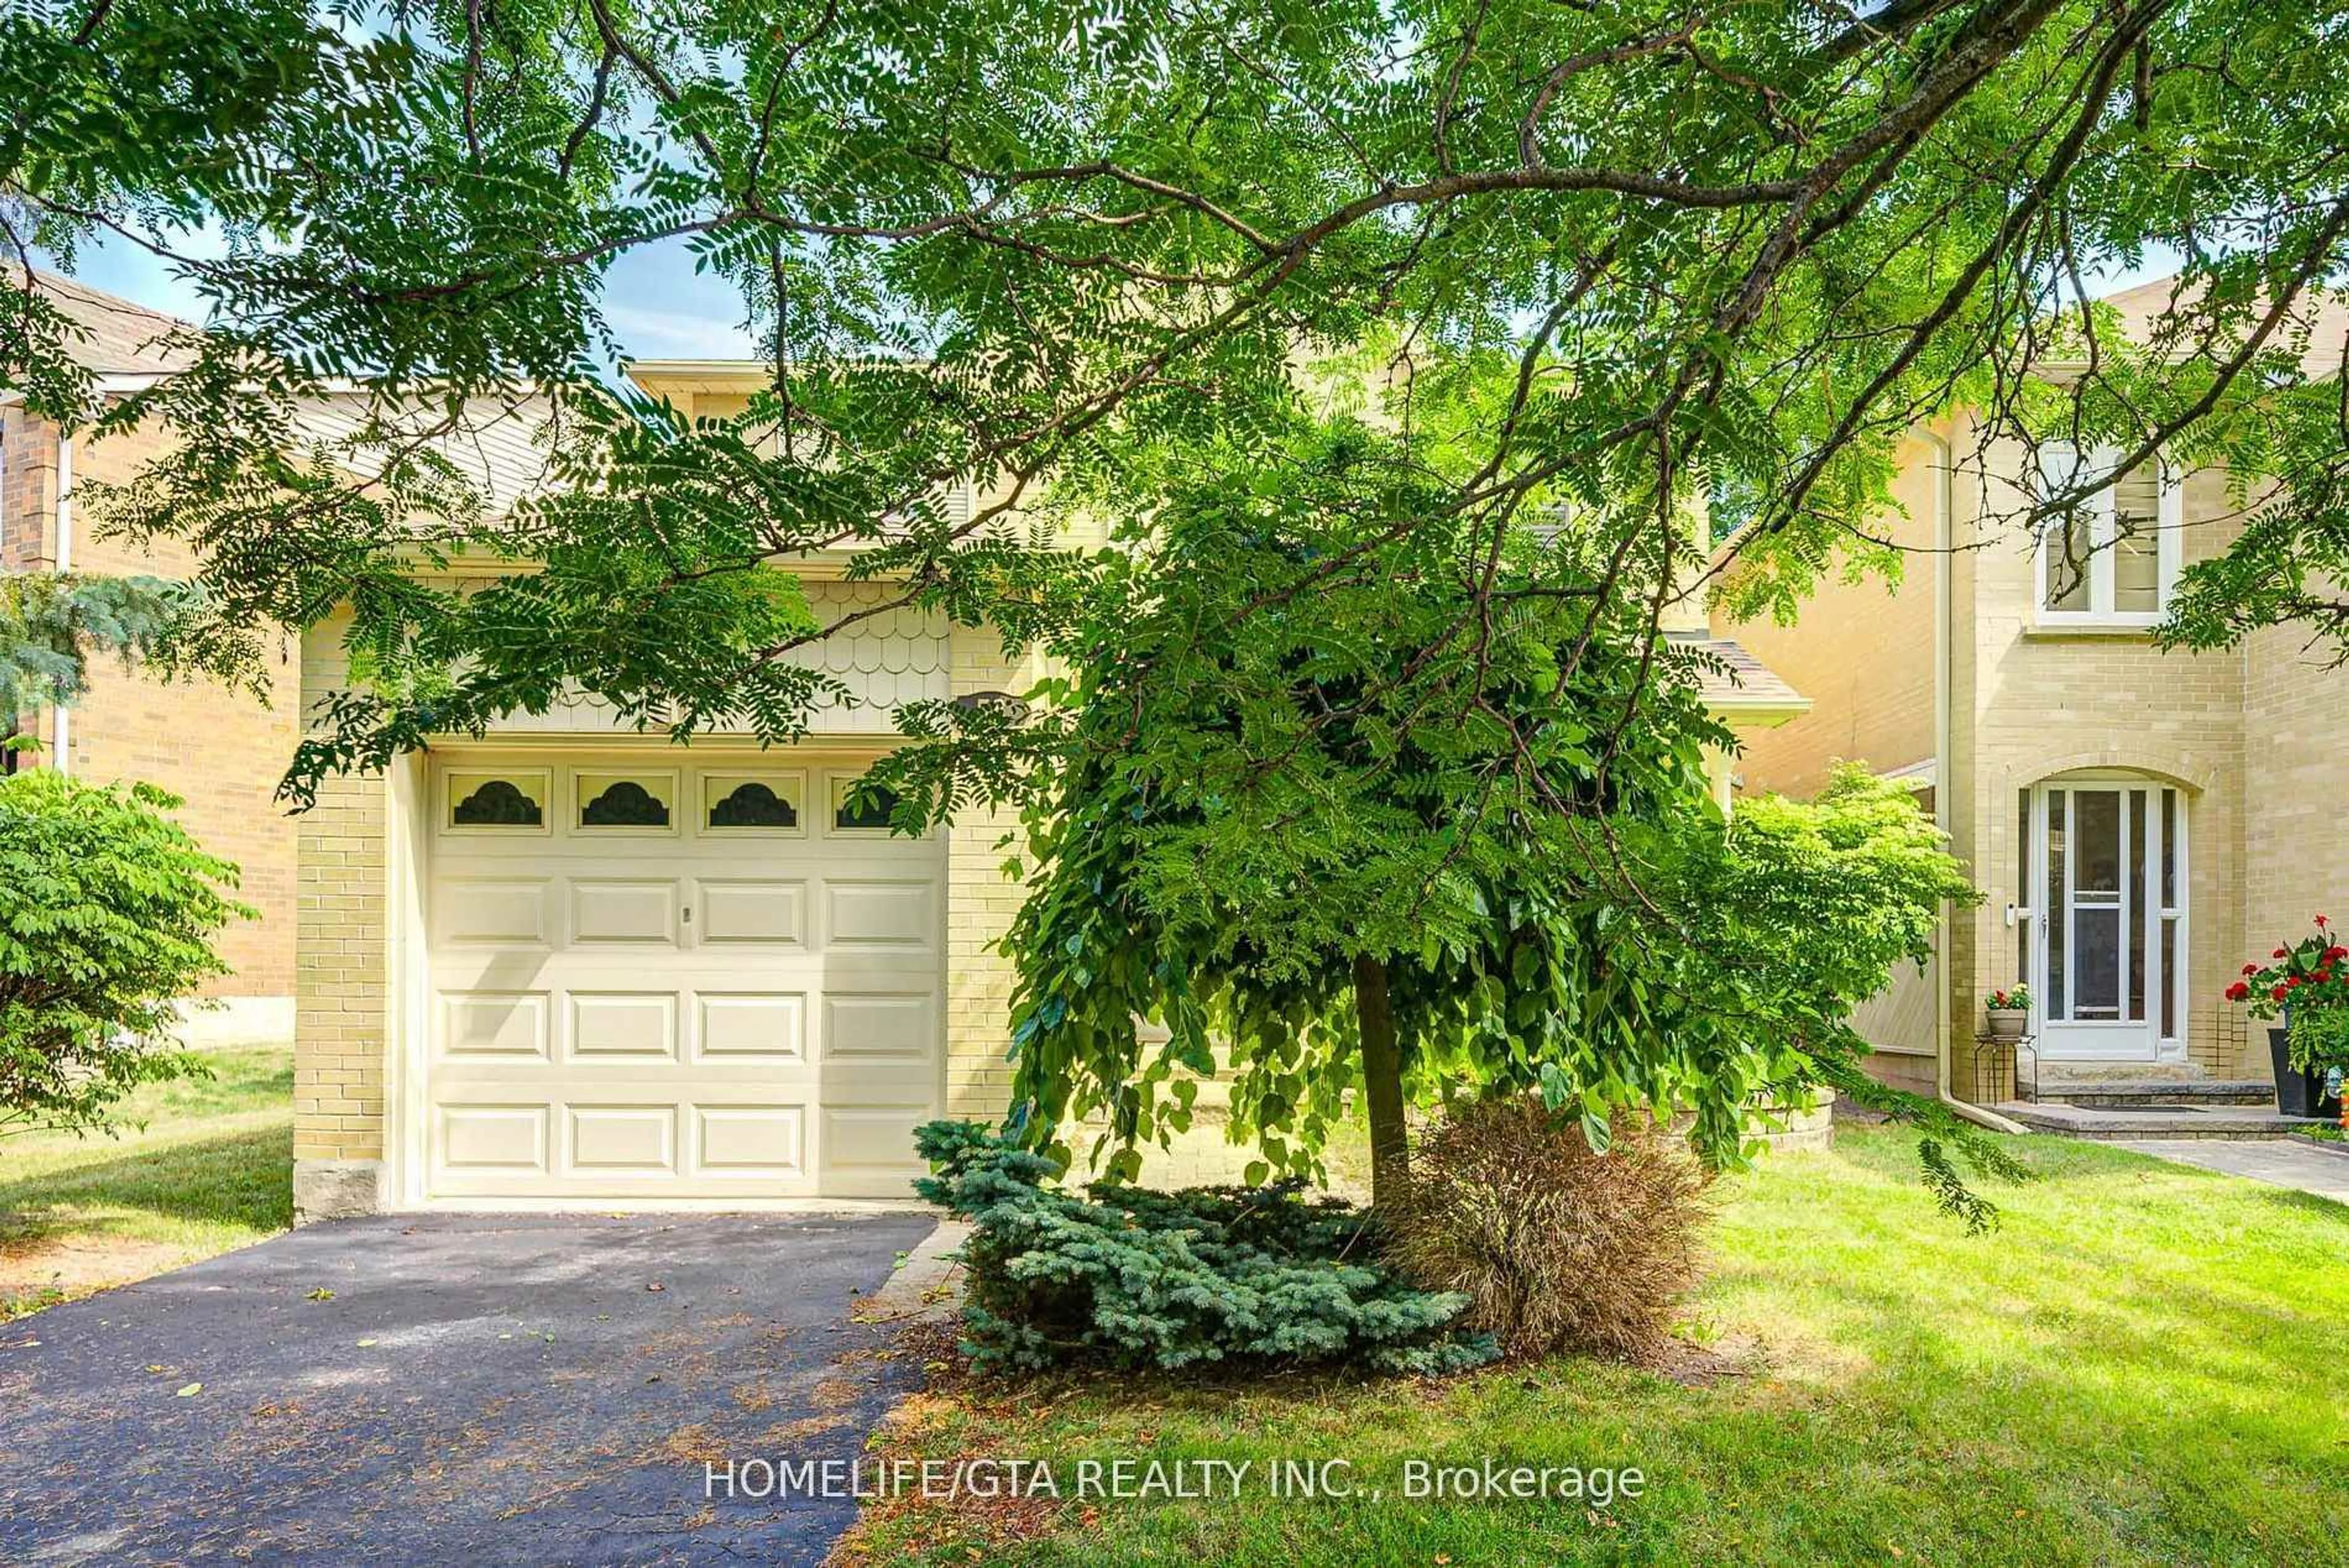
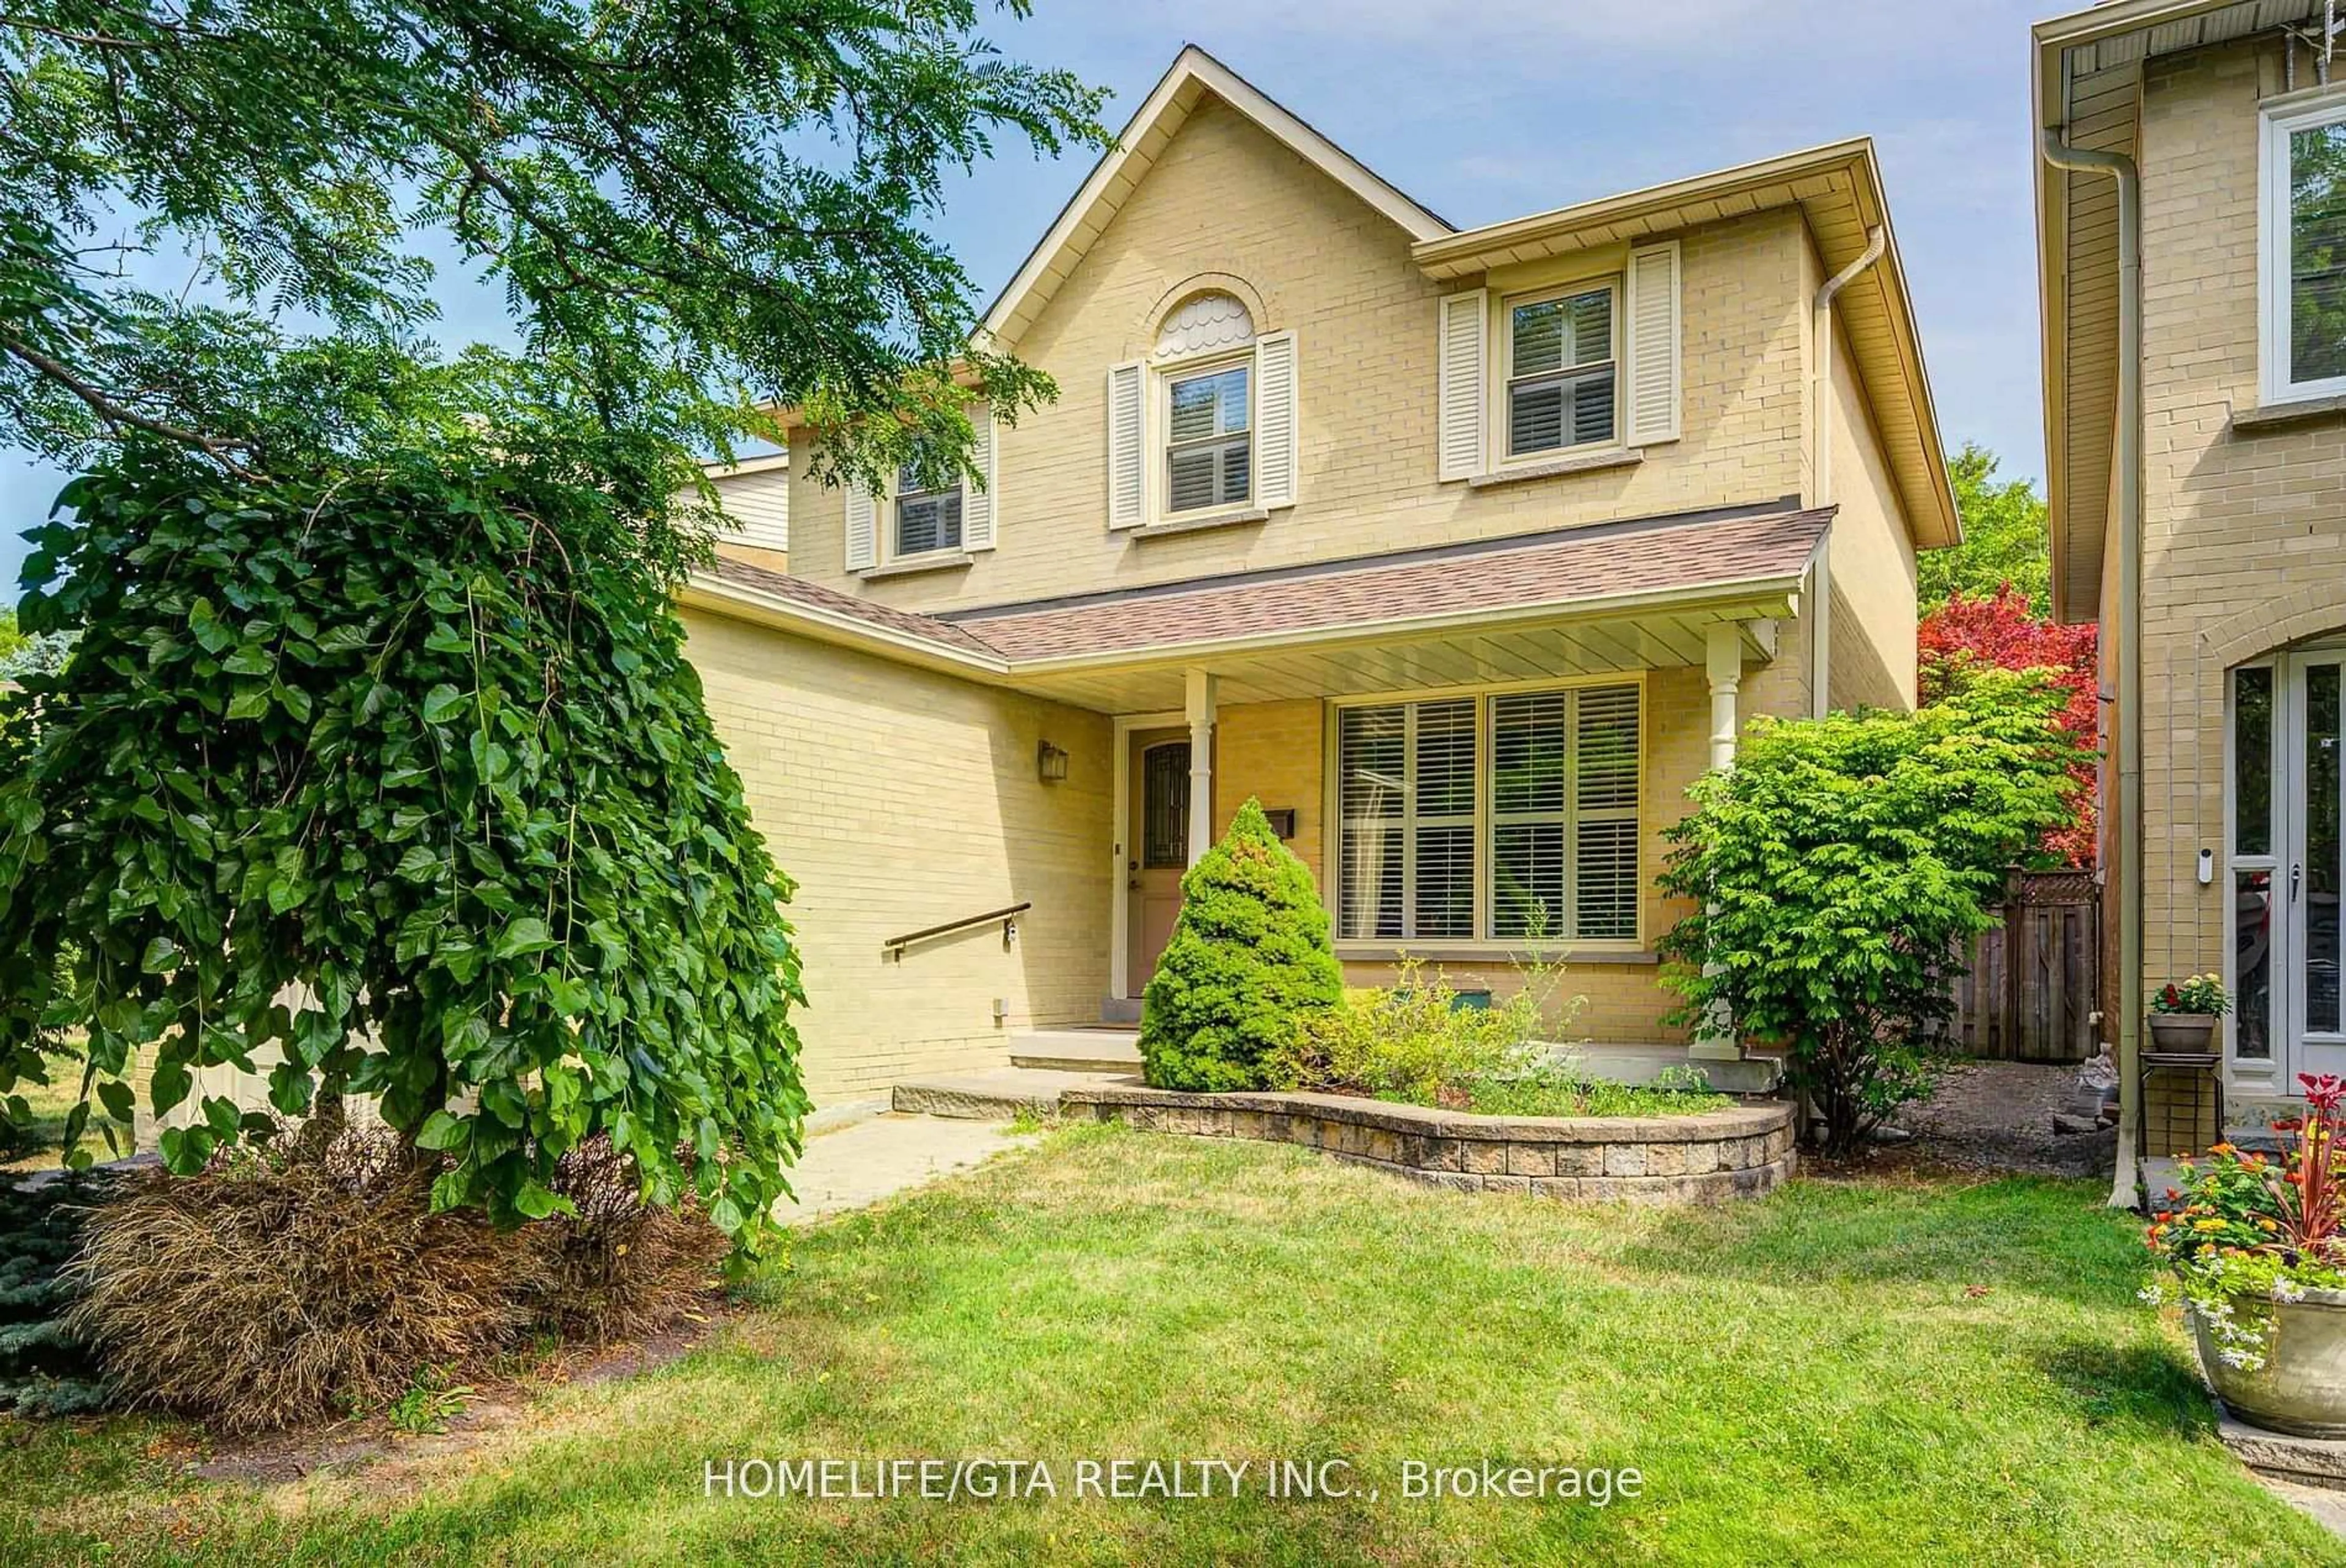
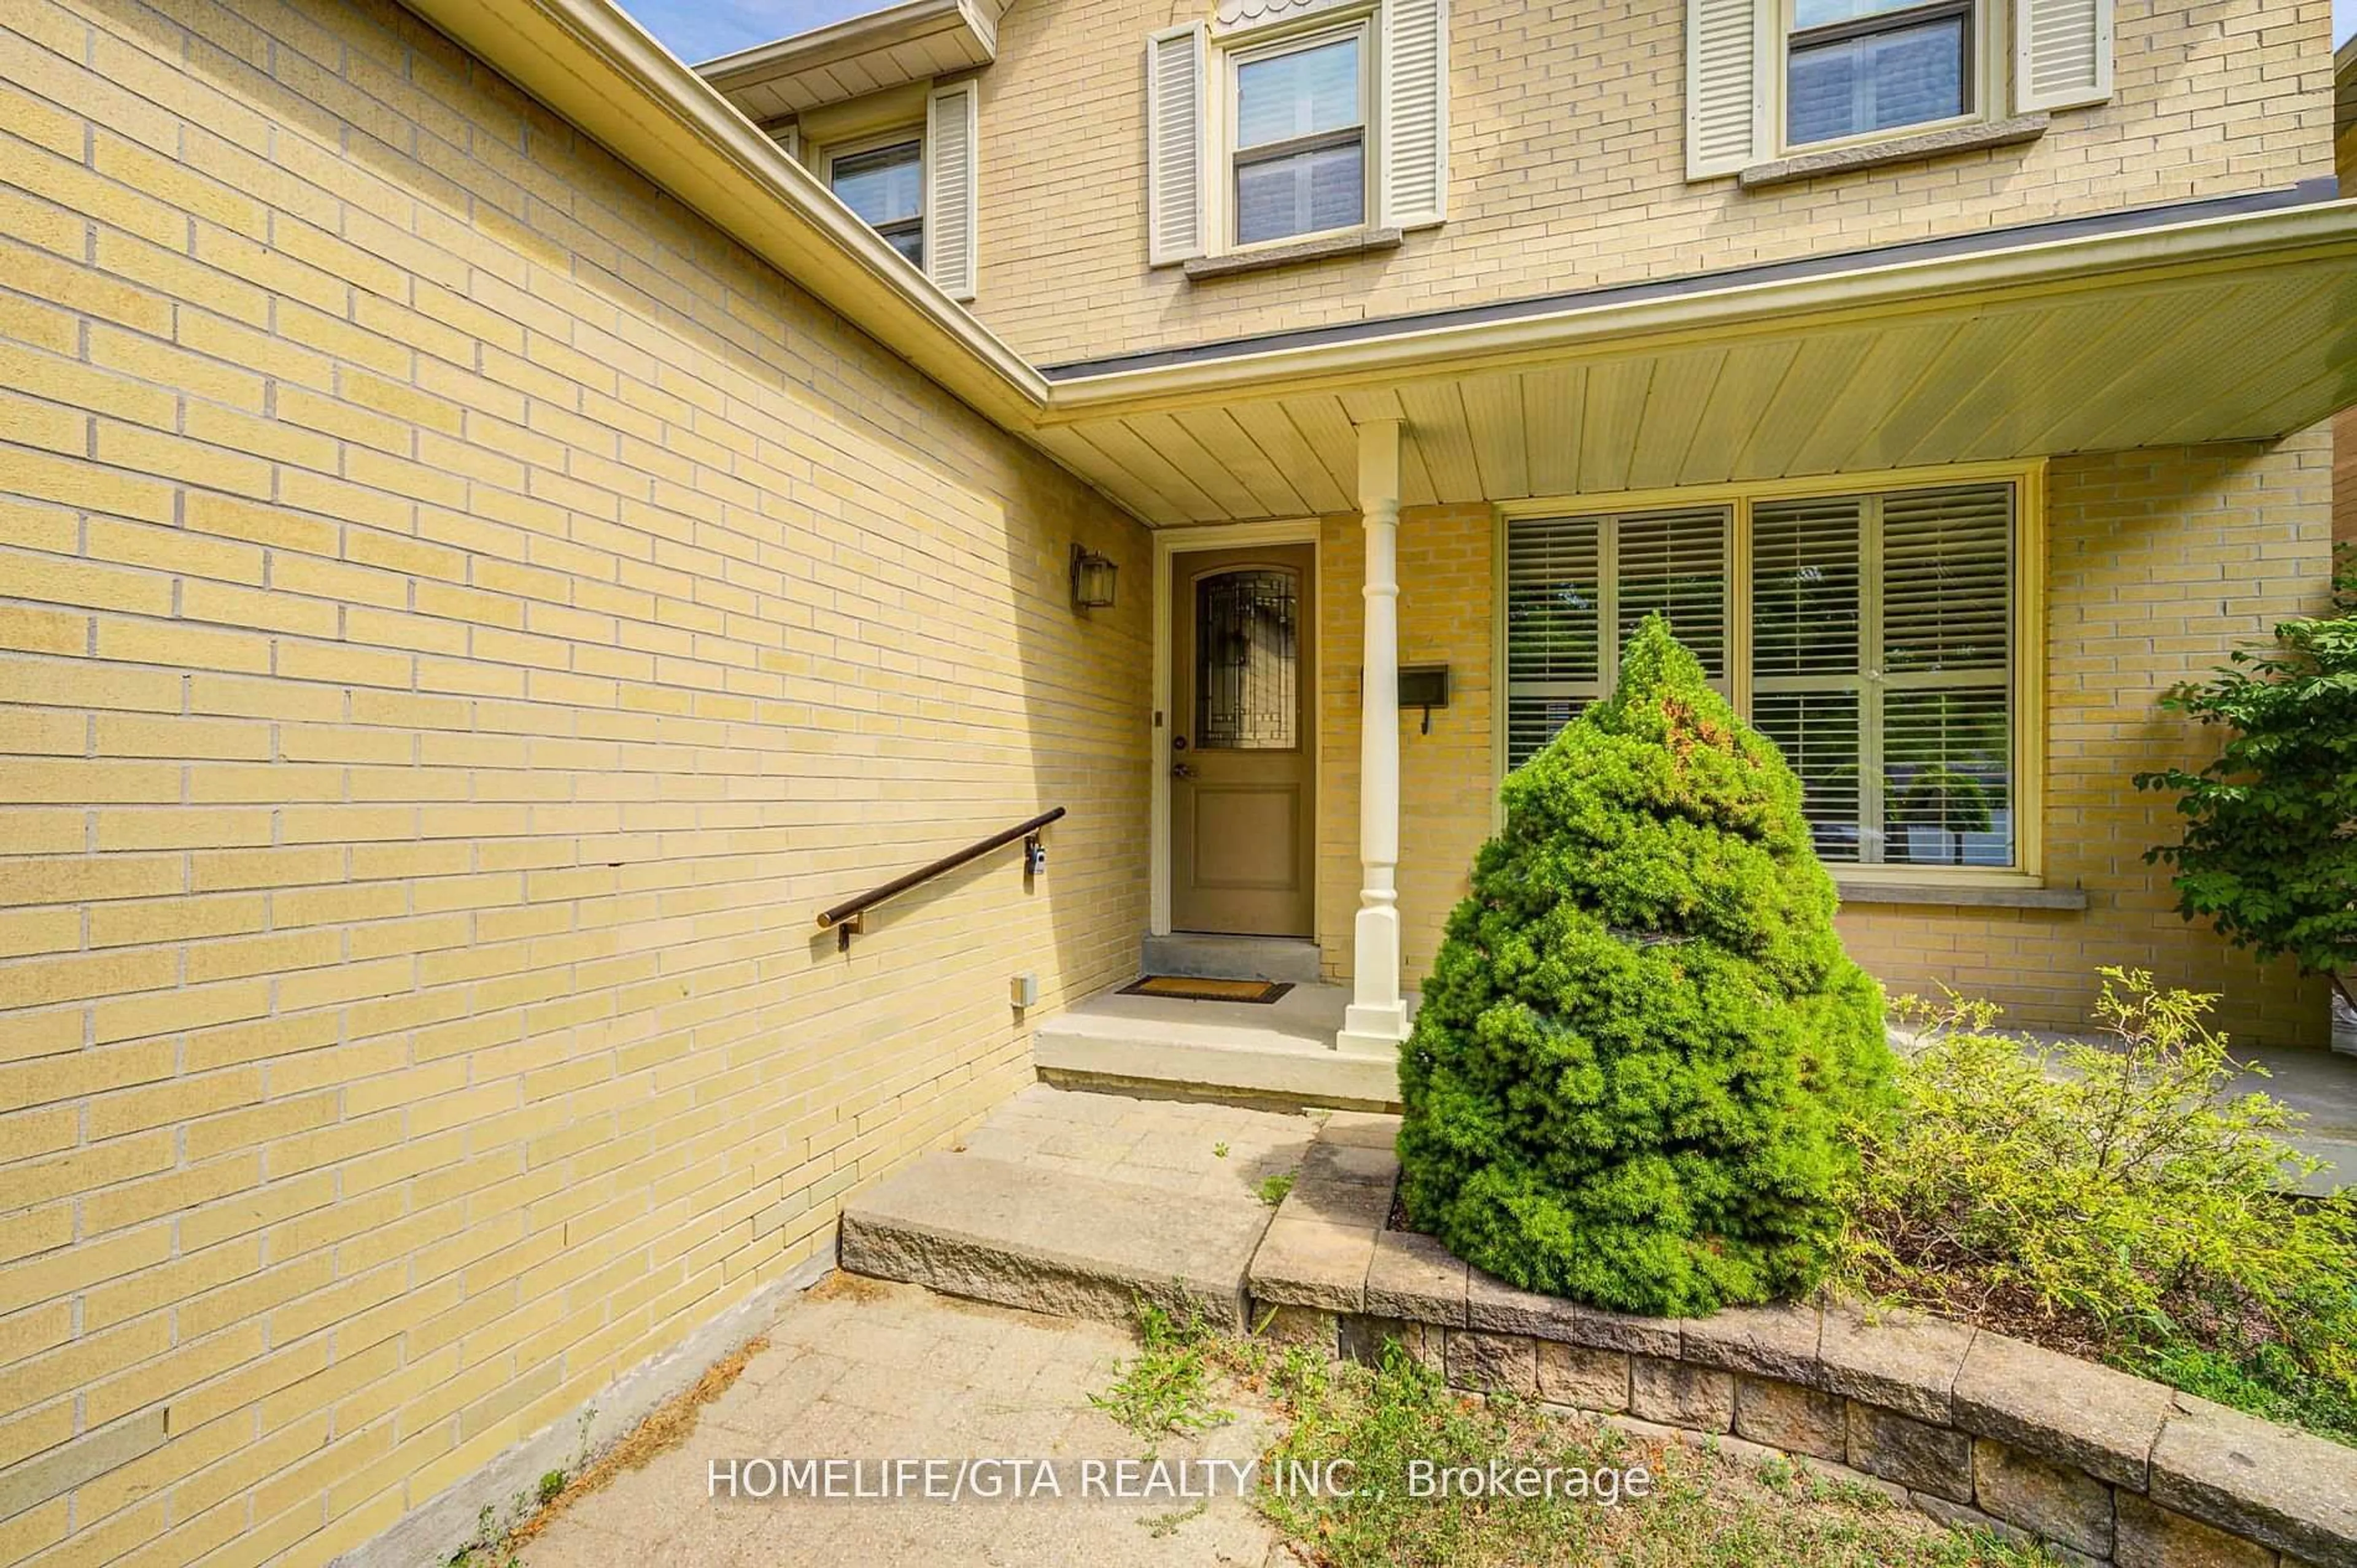
58 Milldock Dr, Toronto, Ontario M1C 4R3
Contact us about this property
Highlights
Estimated valueThis is the price Wahi expects this property to sell for.
The calculation is powered by our Instant Home Value Estimate, which uses current market and property price trends to estimate your home’s value with a 90% accuracy rate.Not available
Price/Sqft$788/sqft
Monthly cost
Open Calculator
Description
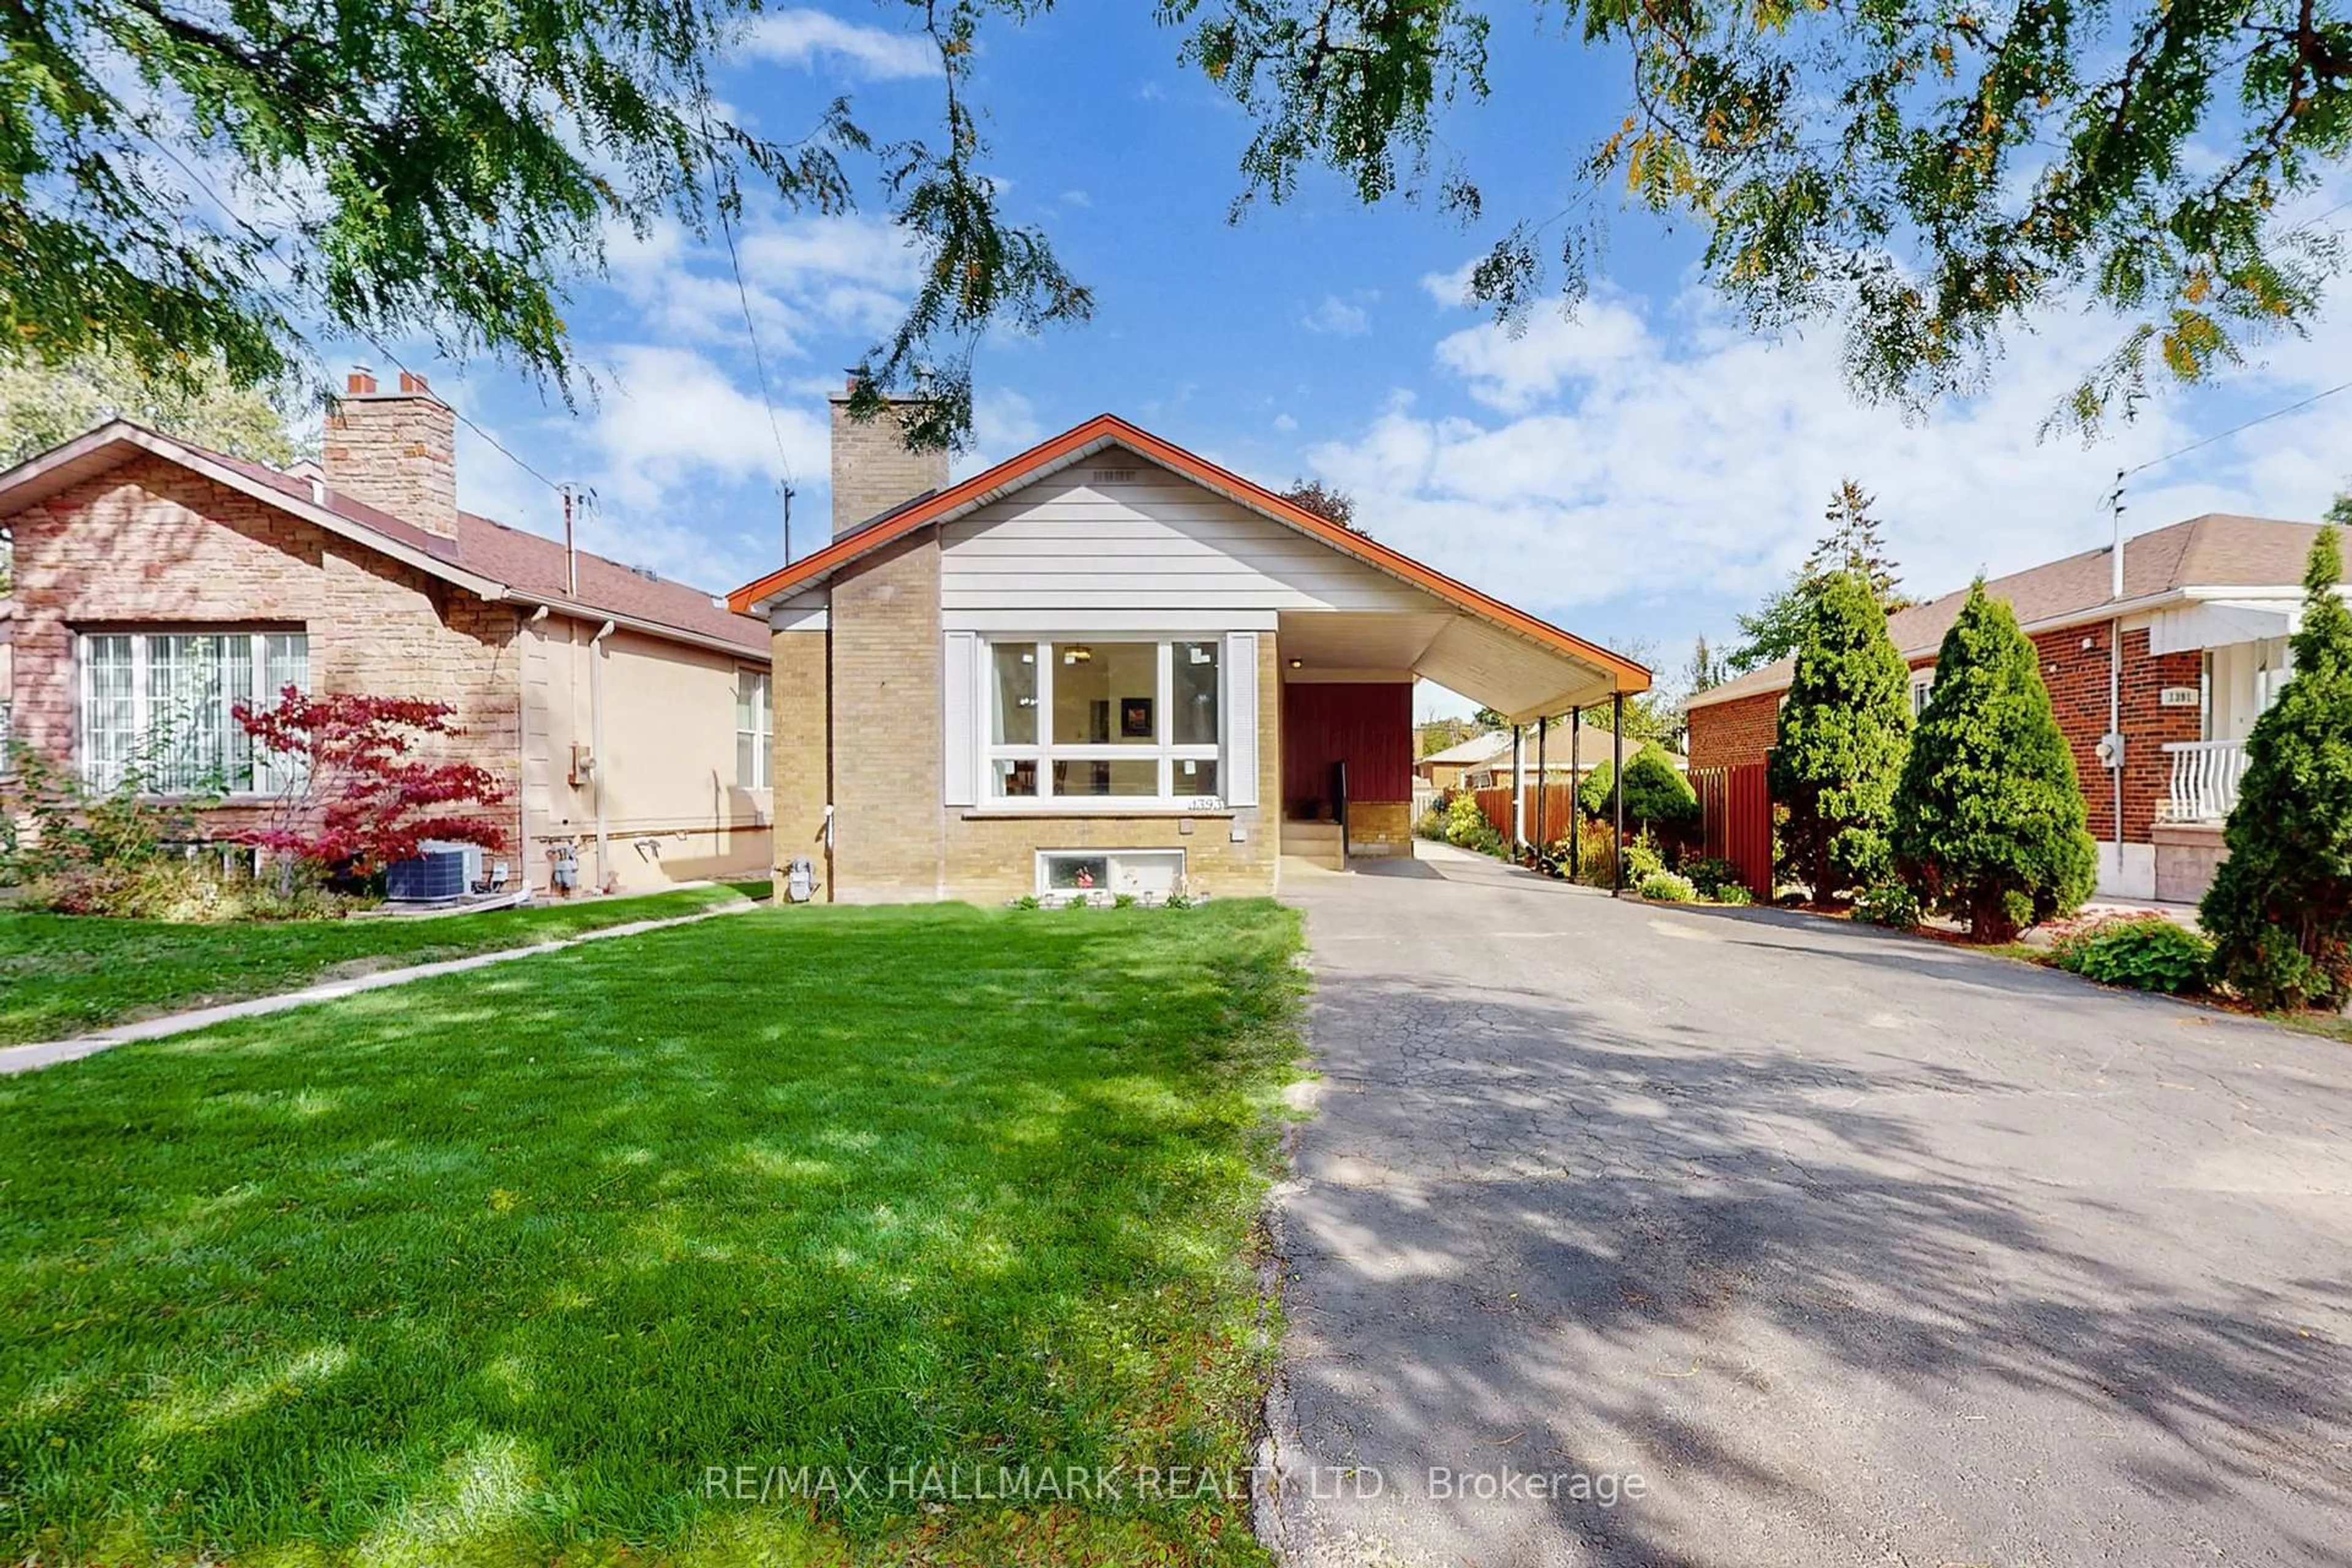
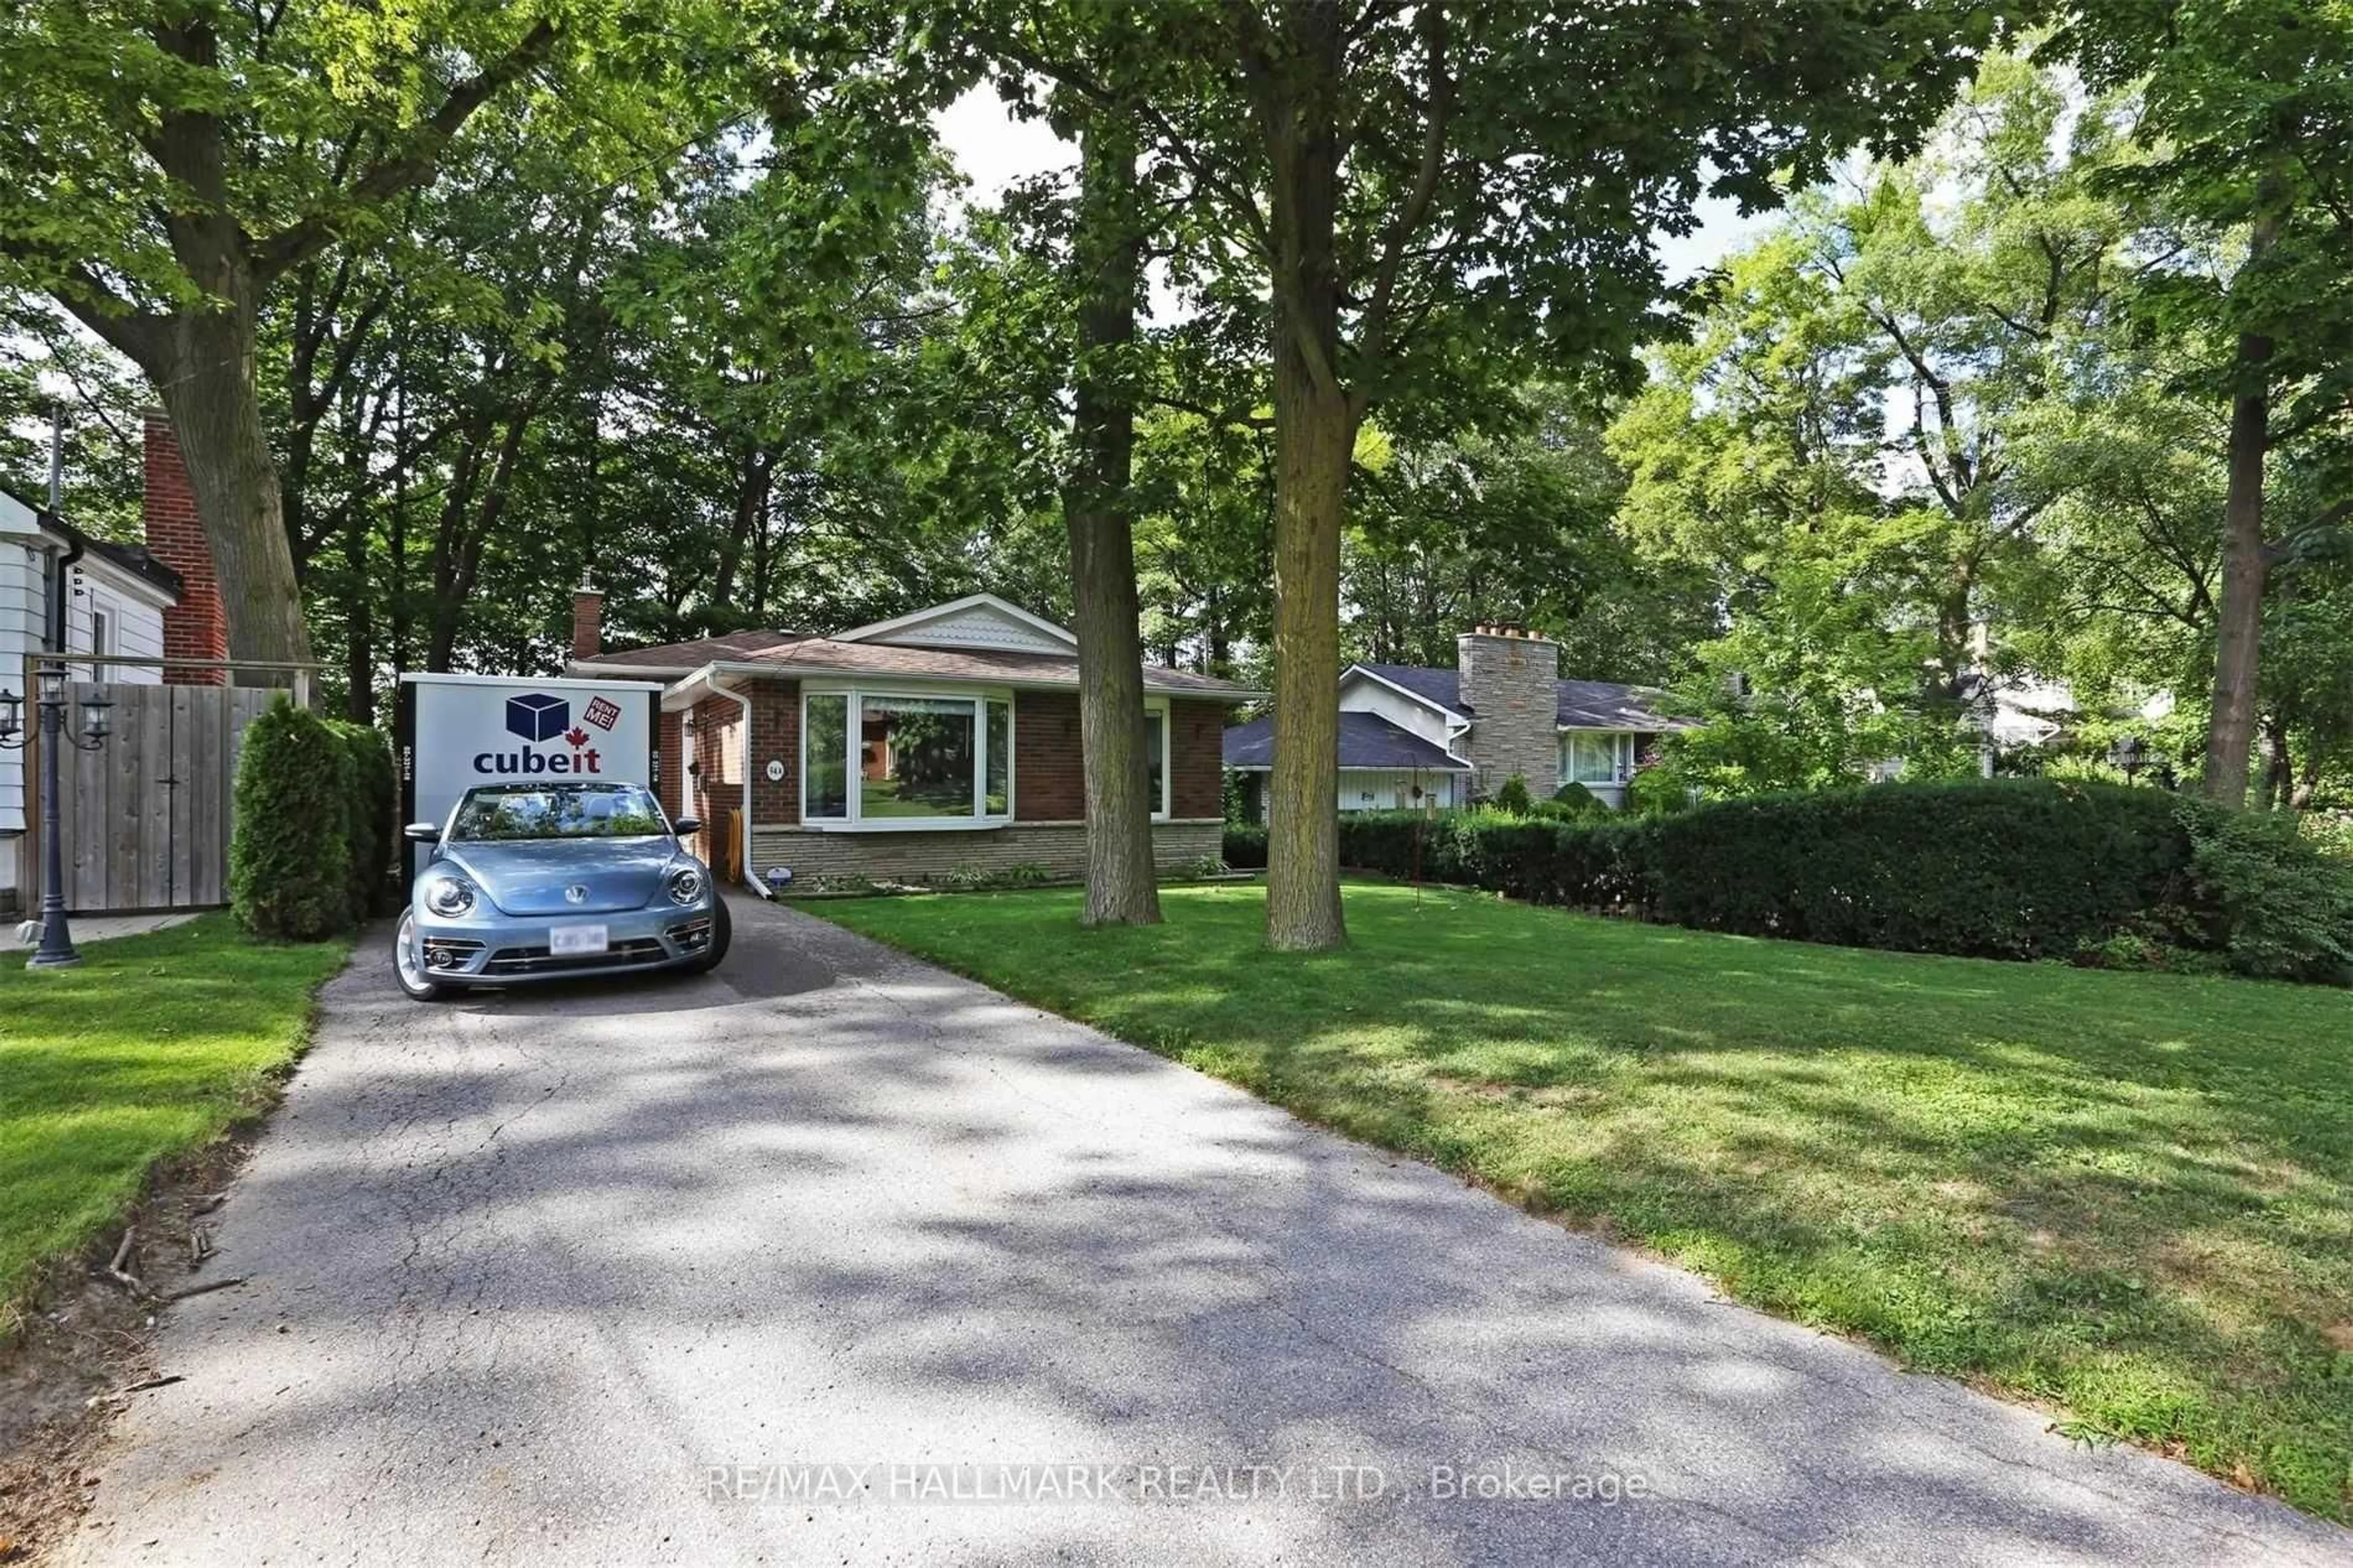
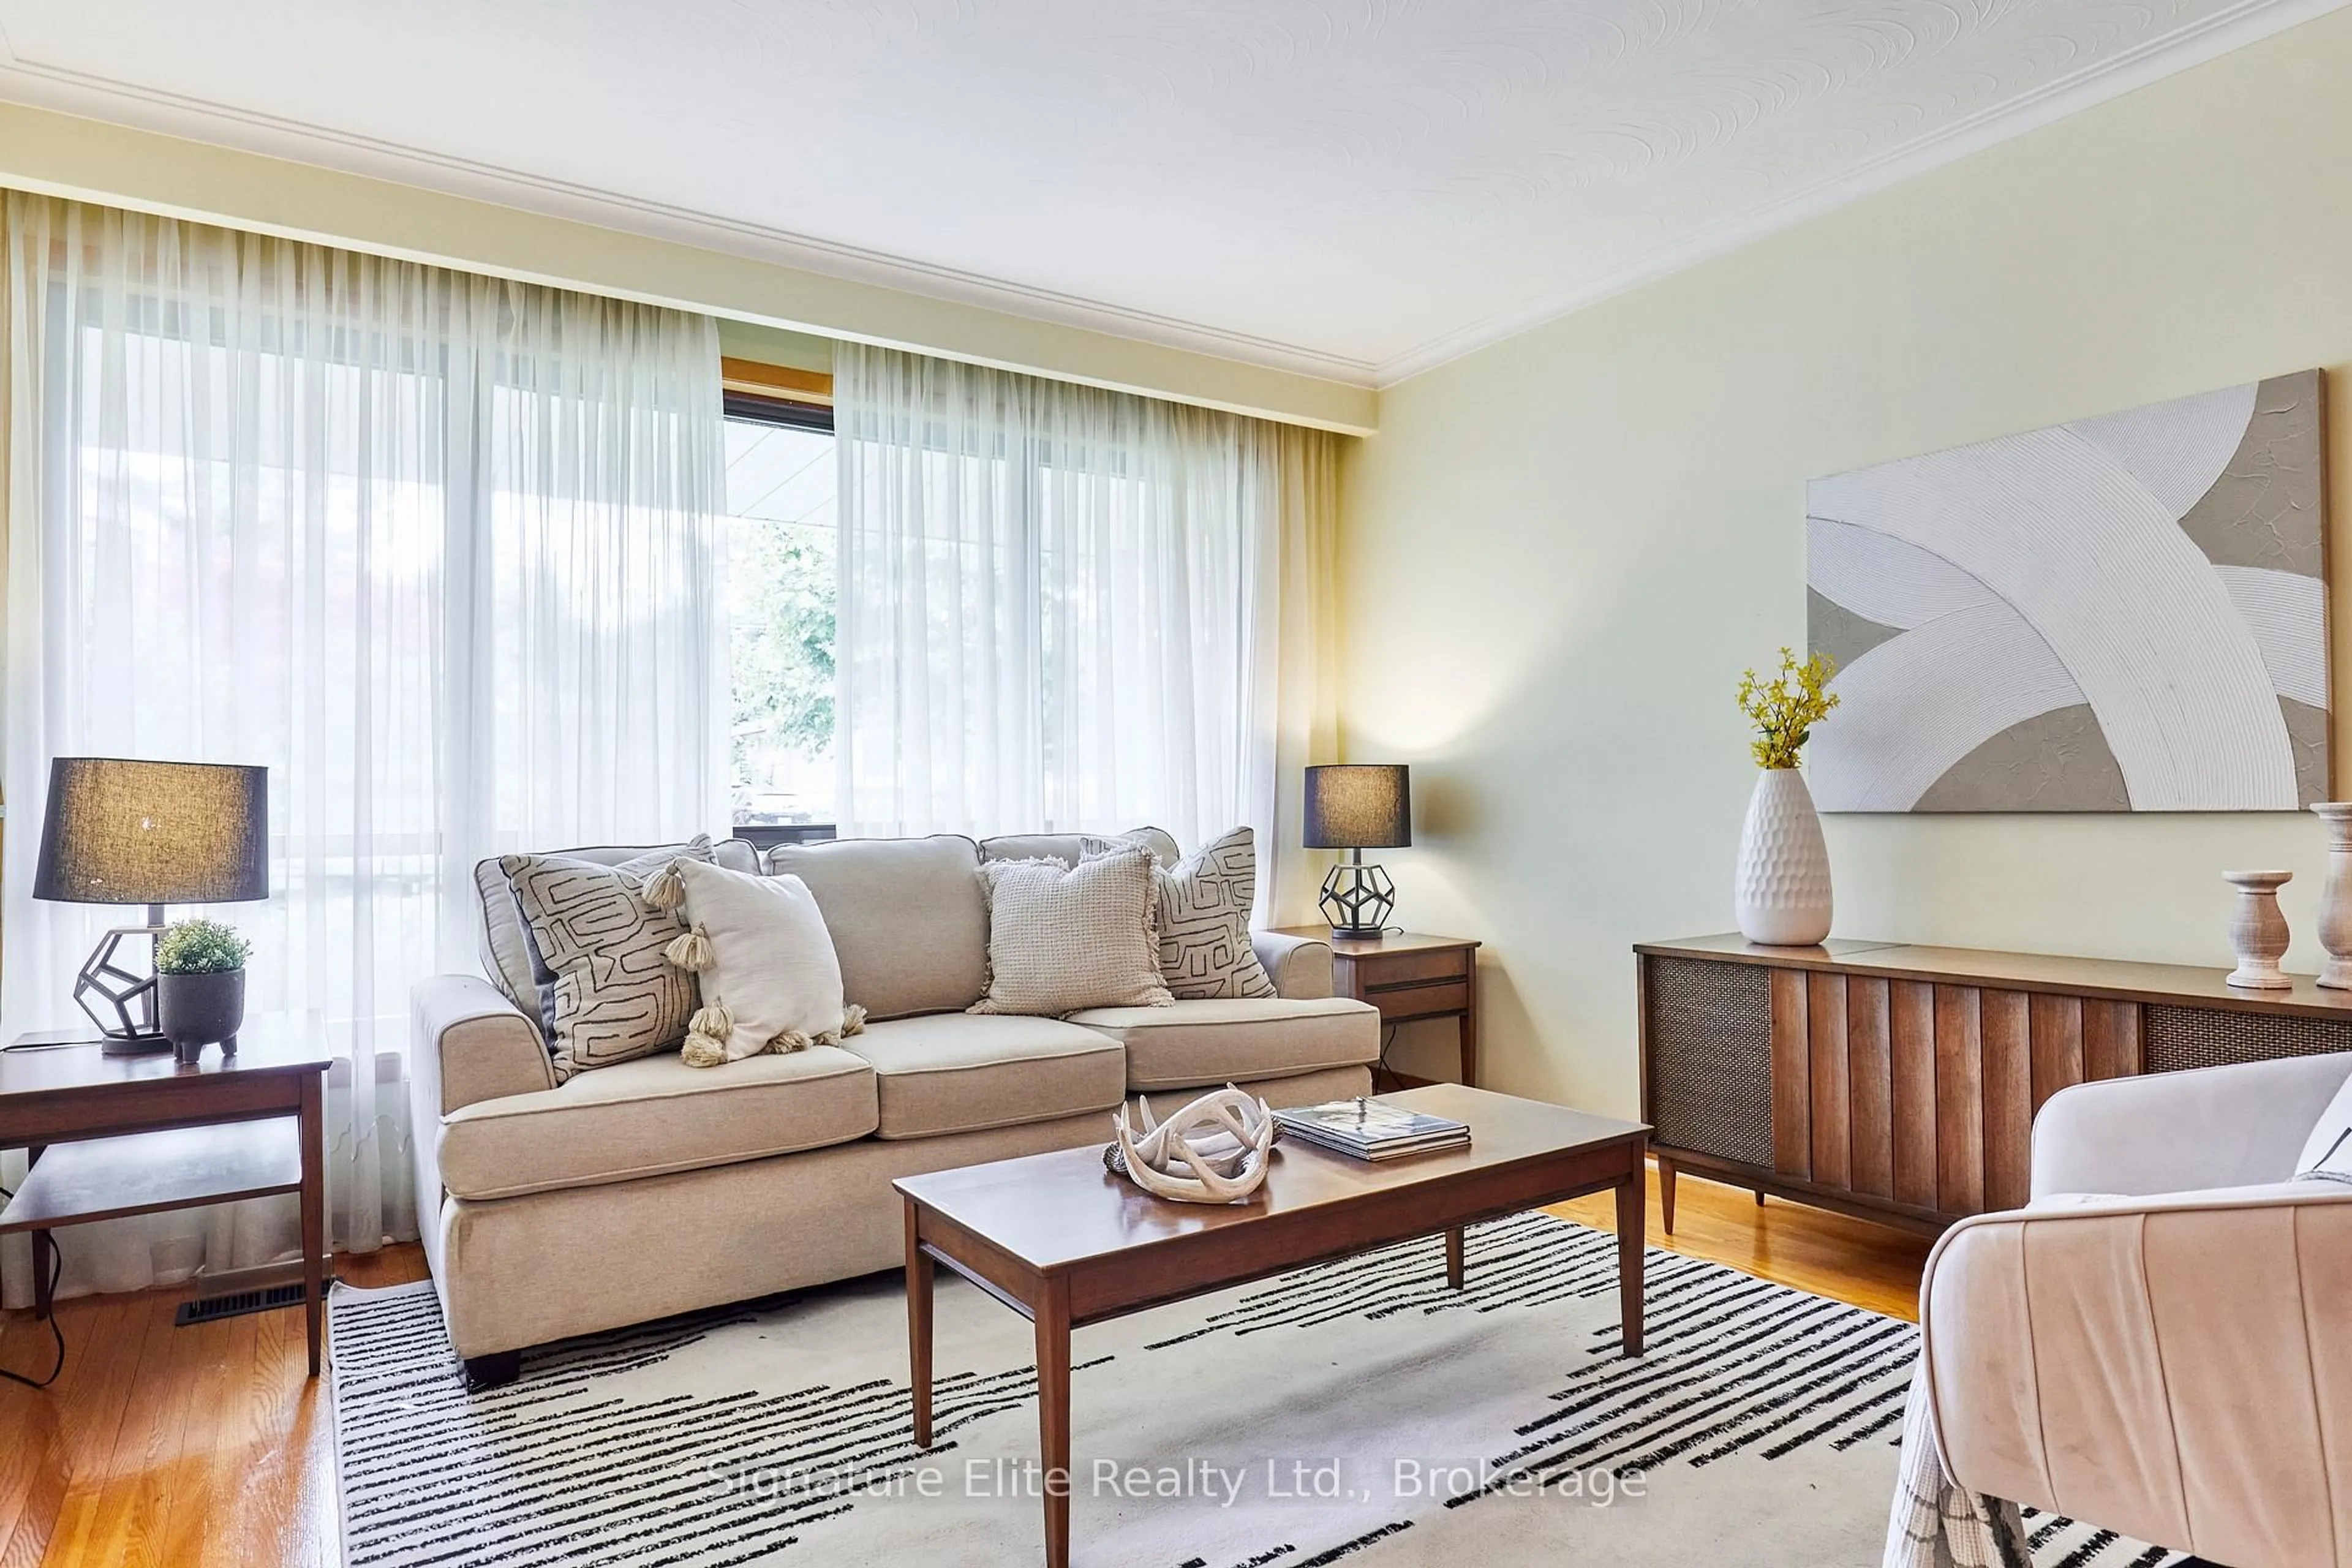
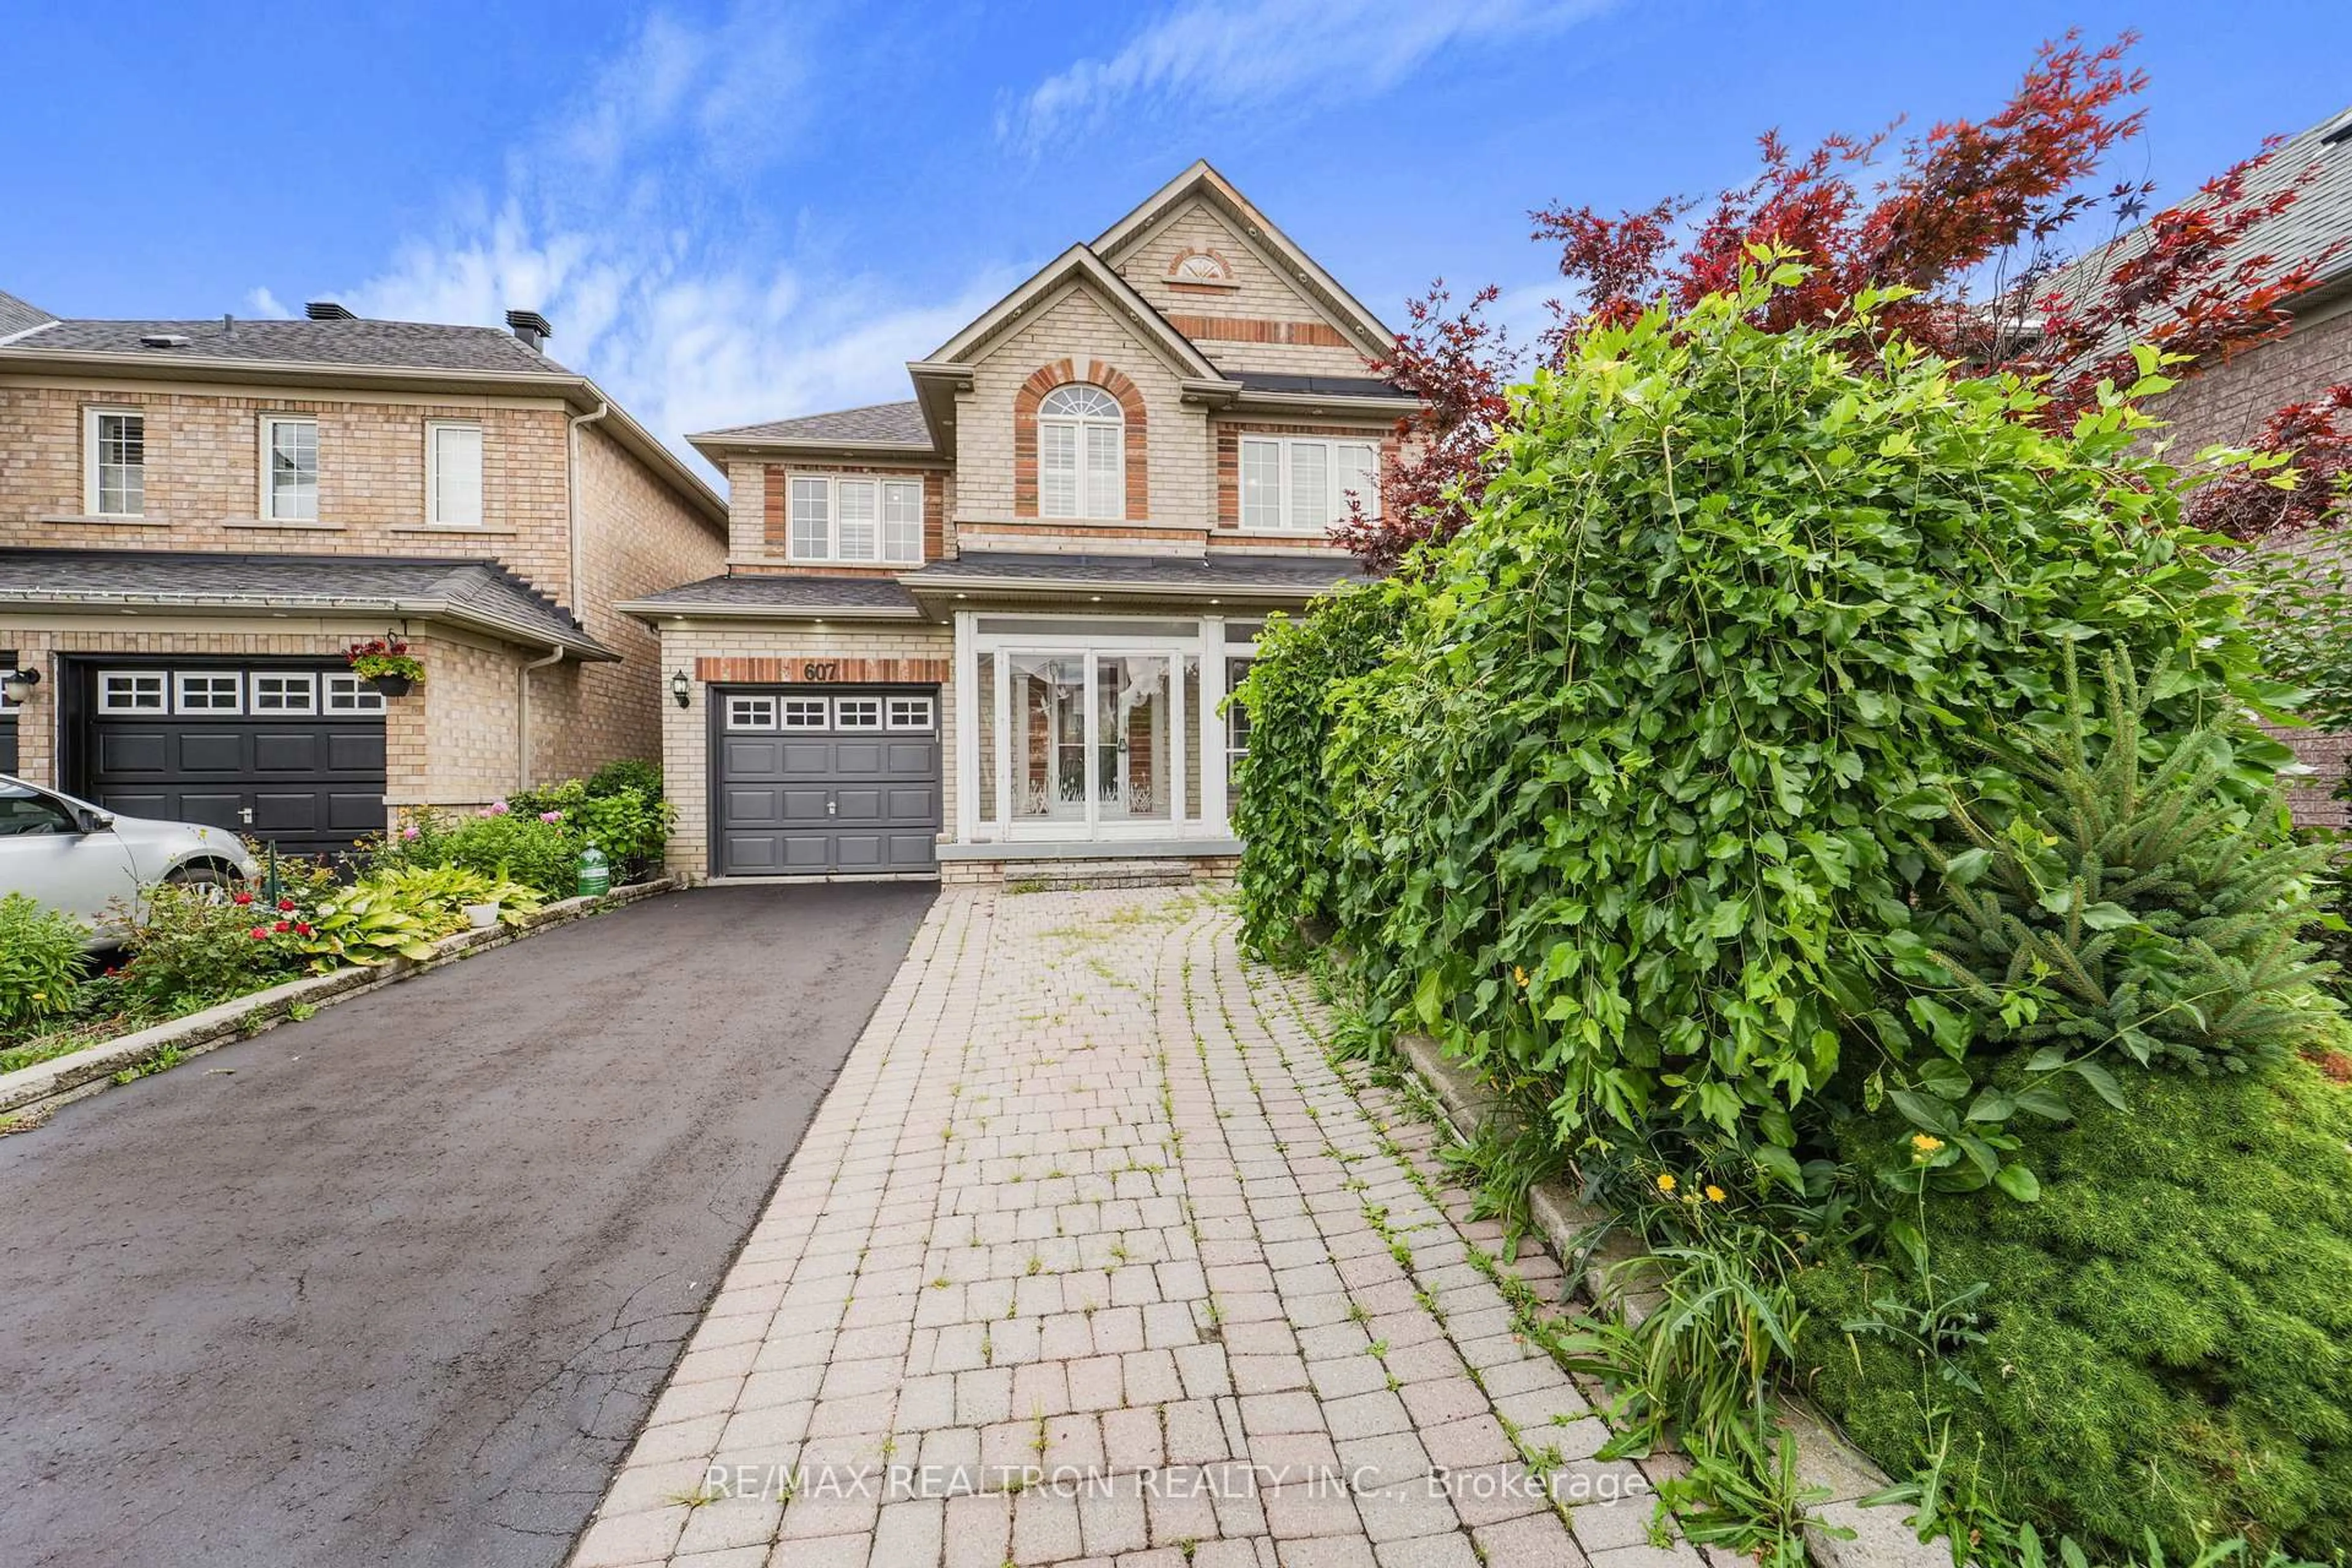
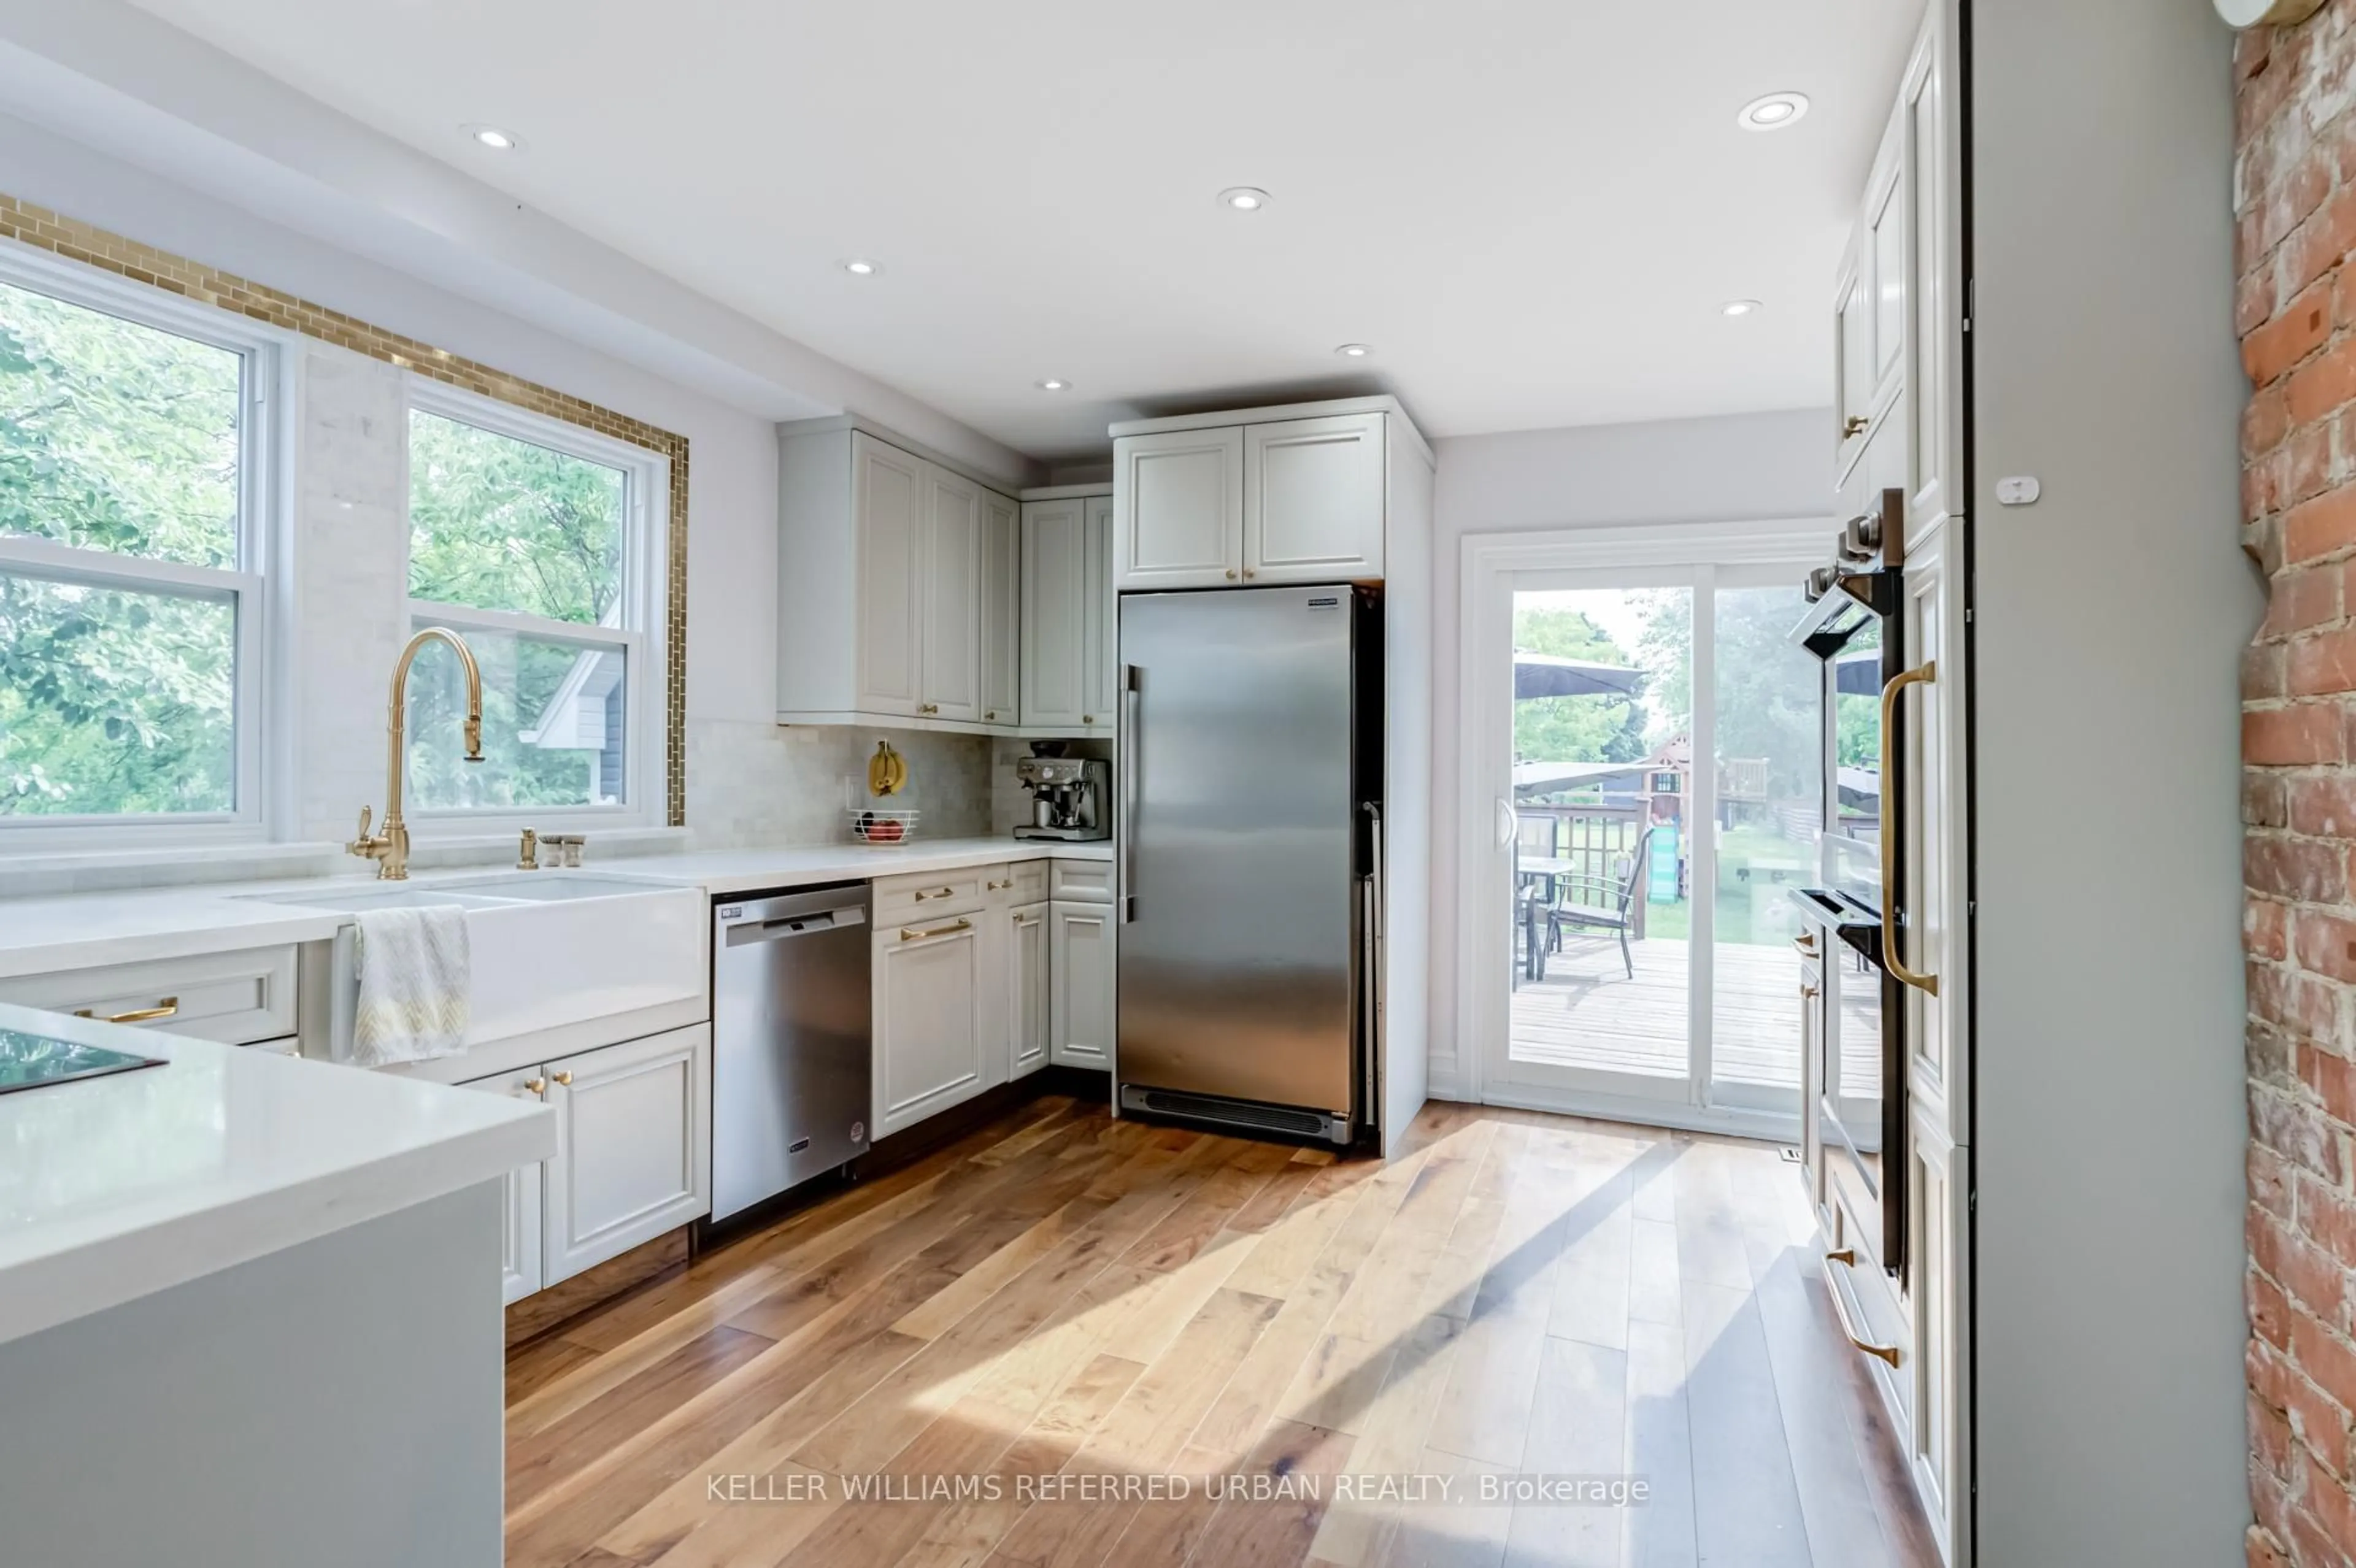
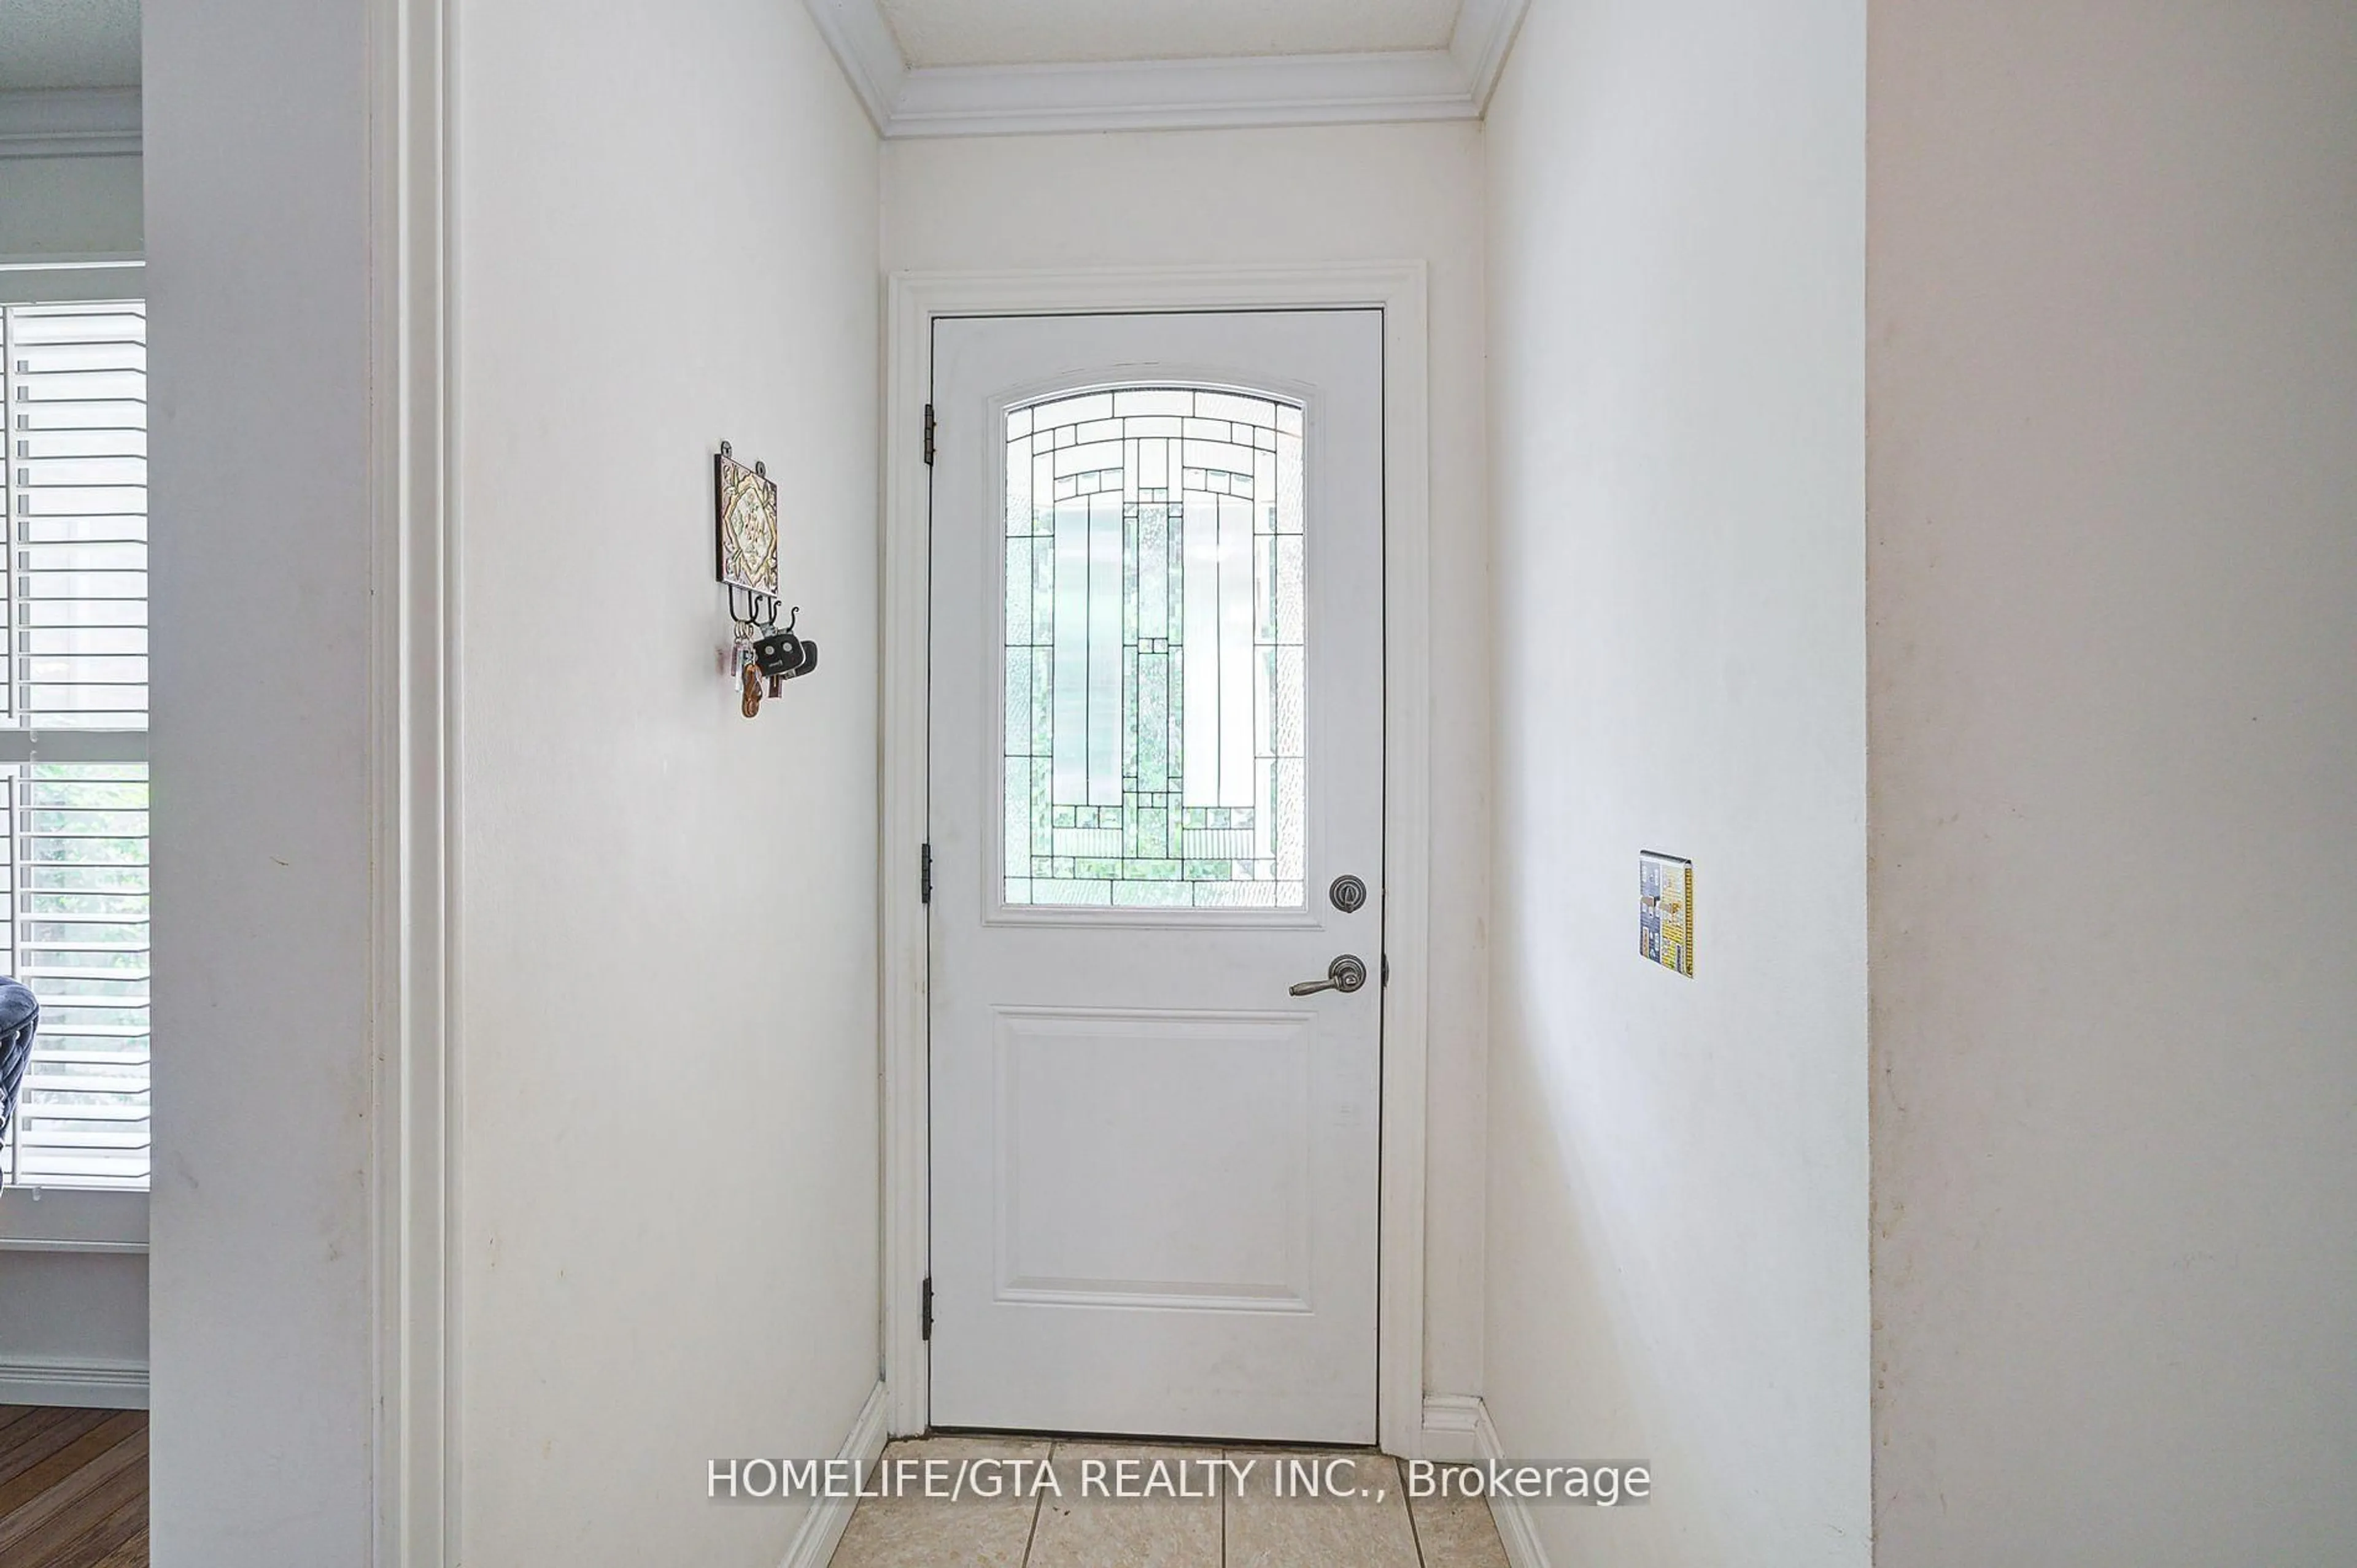
Welcome to this beautifully cared-for 3+1 bedroom detached home in one of West Rouges most desirable pockets! Set on a private, pie-shaped lot backing onto a serene park with tennis courts, this home offers the perfect balance of comfort and community. Enjoy a bright eat-in kitchen with a walk-out to a large deck perfect for outdoor dining and entertaining. Elegant French doors, hardwood floors, and a spacious finished basement with a rec room and extra bedroom add to its appeal. Just a short stroll to the beach, conservation area, excellent schools, TTC, and GO Station. A true family gem in a peaceful, friendly neighbourhood!
Upcoming Open Houses
Property Details
Interior
Features
Main Floor
Living
4.9 x 3.35Hardwood Floor
Dining
3.35 x 3.2Hardwood Floor
Kitchen
3.9 x 3.6Eat-In Kitchen
Exterior
Features
Parking
Garage spaces 1
Garage type Attached
Other parking spaces 3
Total parking spaces 4
Property History
 50
50