Unknown for 251 Queen St, Shannonville Ontario K0K 3A0
88 days on Market

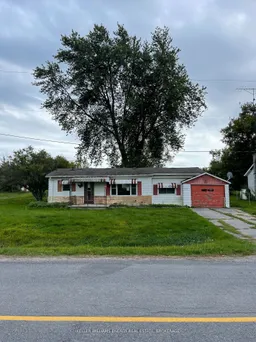
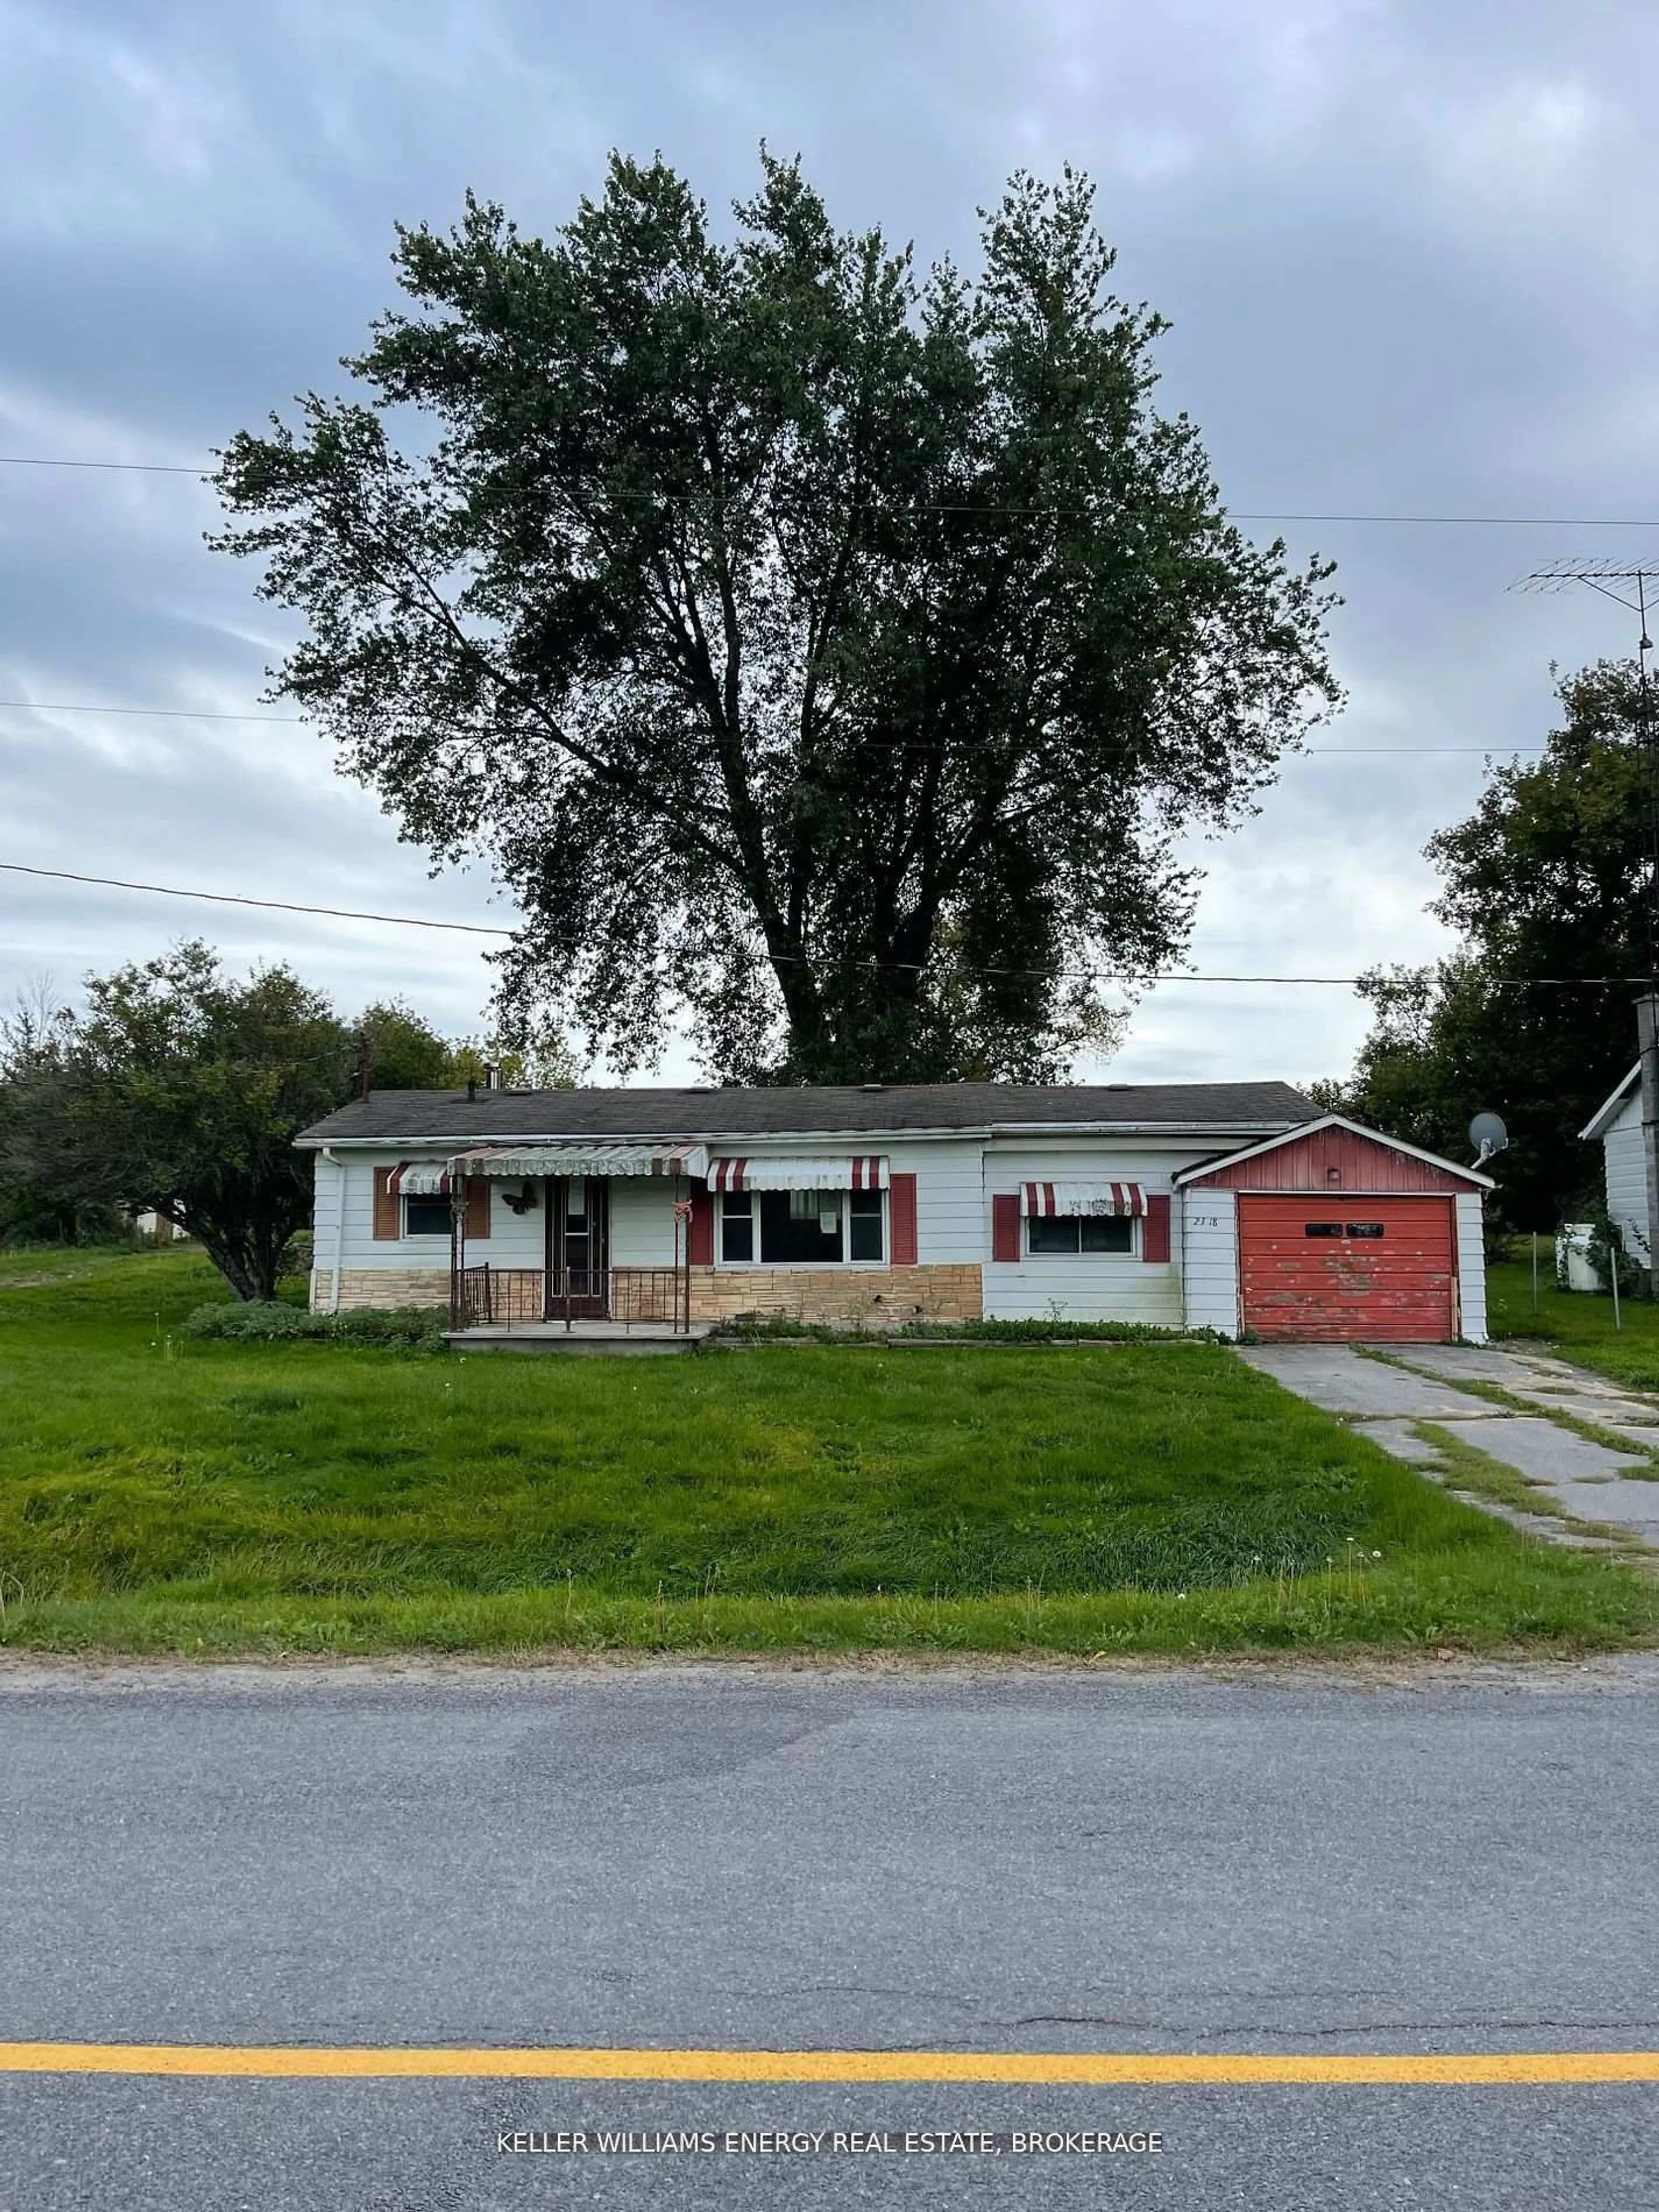
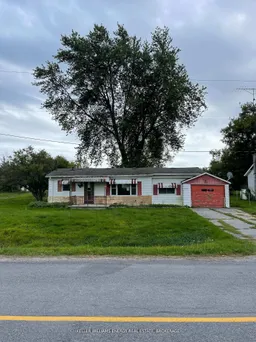
251 Queen St, Shannonville, Ontario K0K 3A0

Detached
2
1
~1100-1500 sqft

Sold conditionally $175,000

Escape clause

Detached
2
1
~1100-1500 sqft

Contact us about this property

Call

Highlights

Property Estimate

Days on market88 days

Estimated valueNot available

Price/Sqft$138/sqft

Monthly cost

Open Calculator

Description

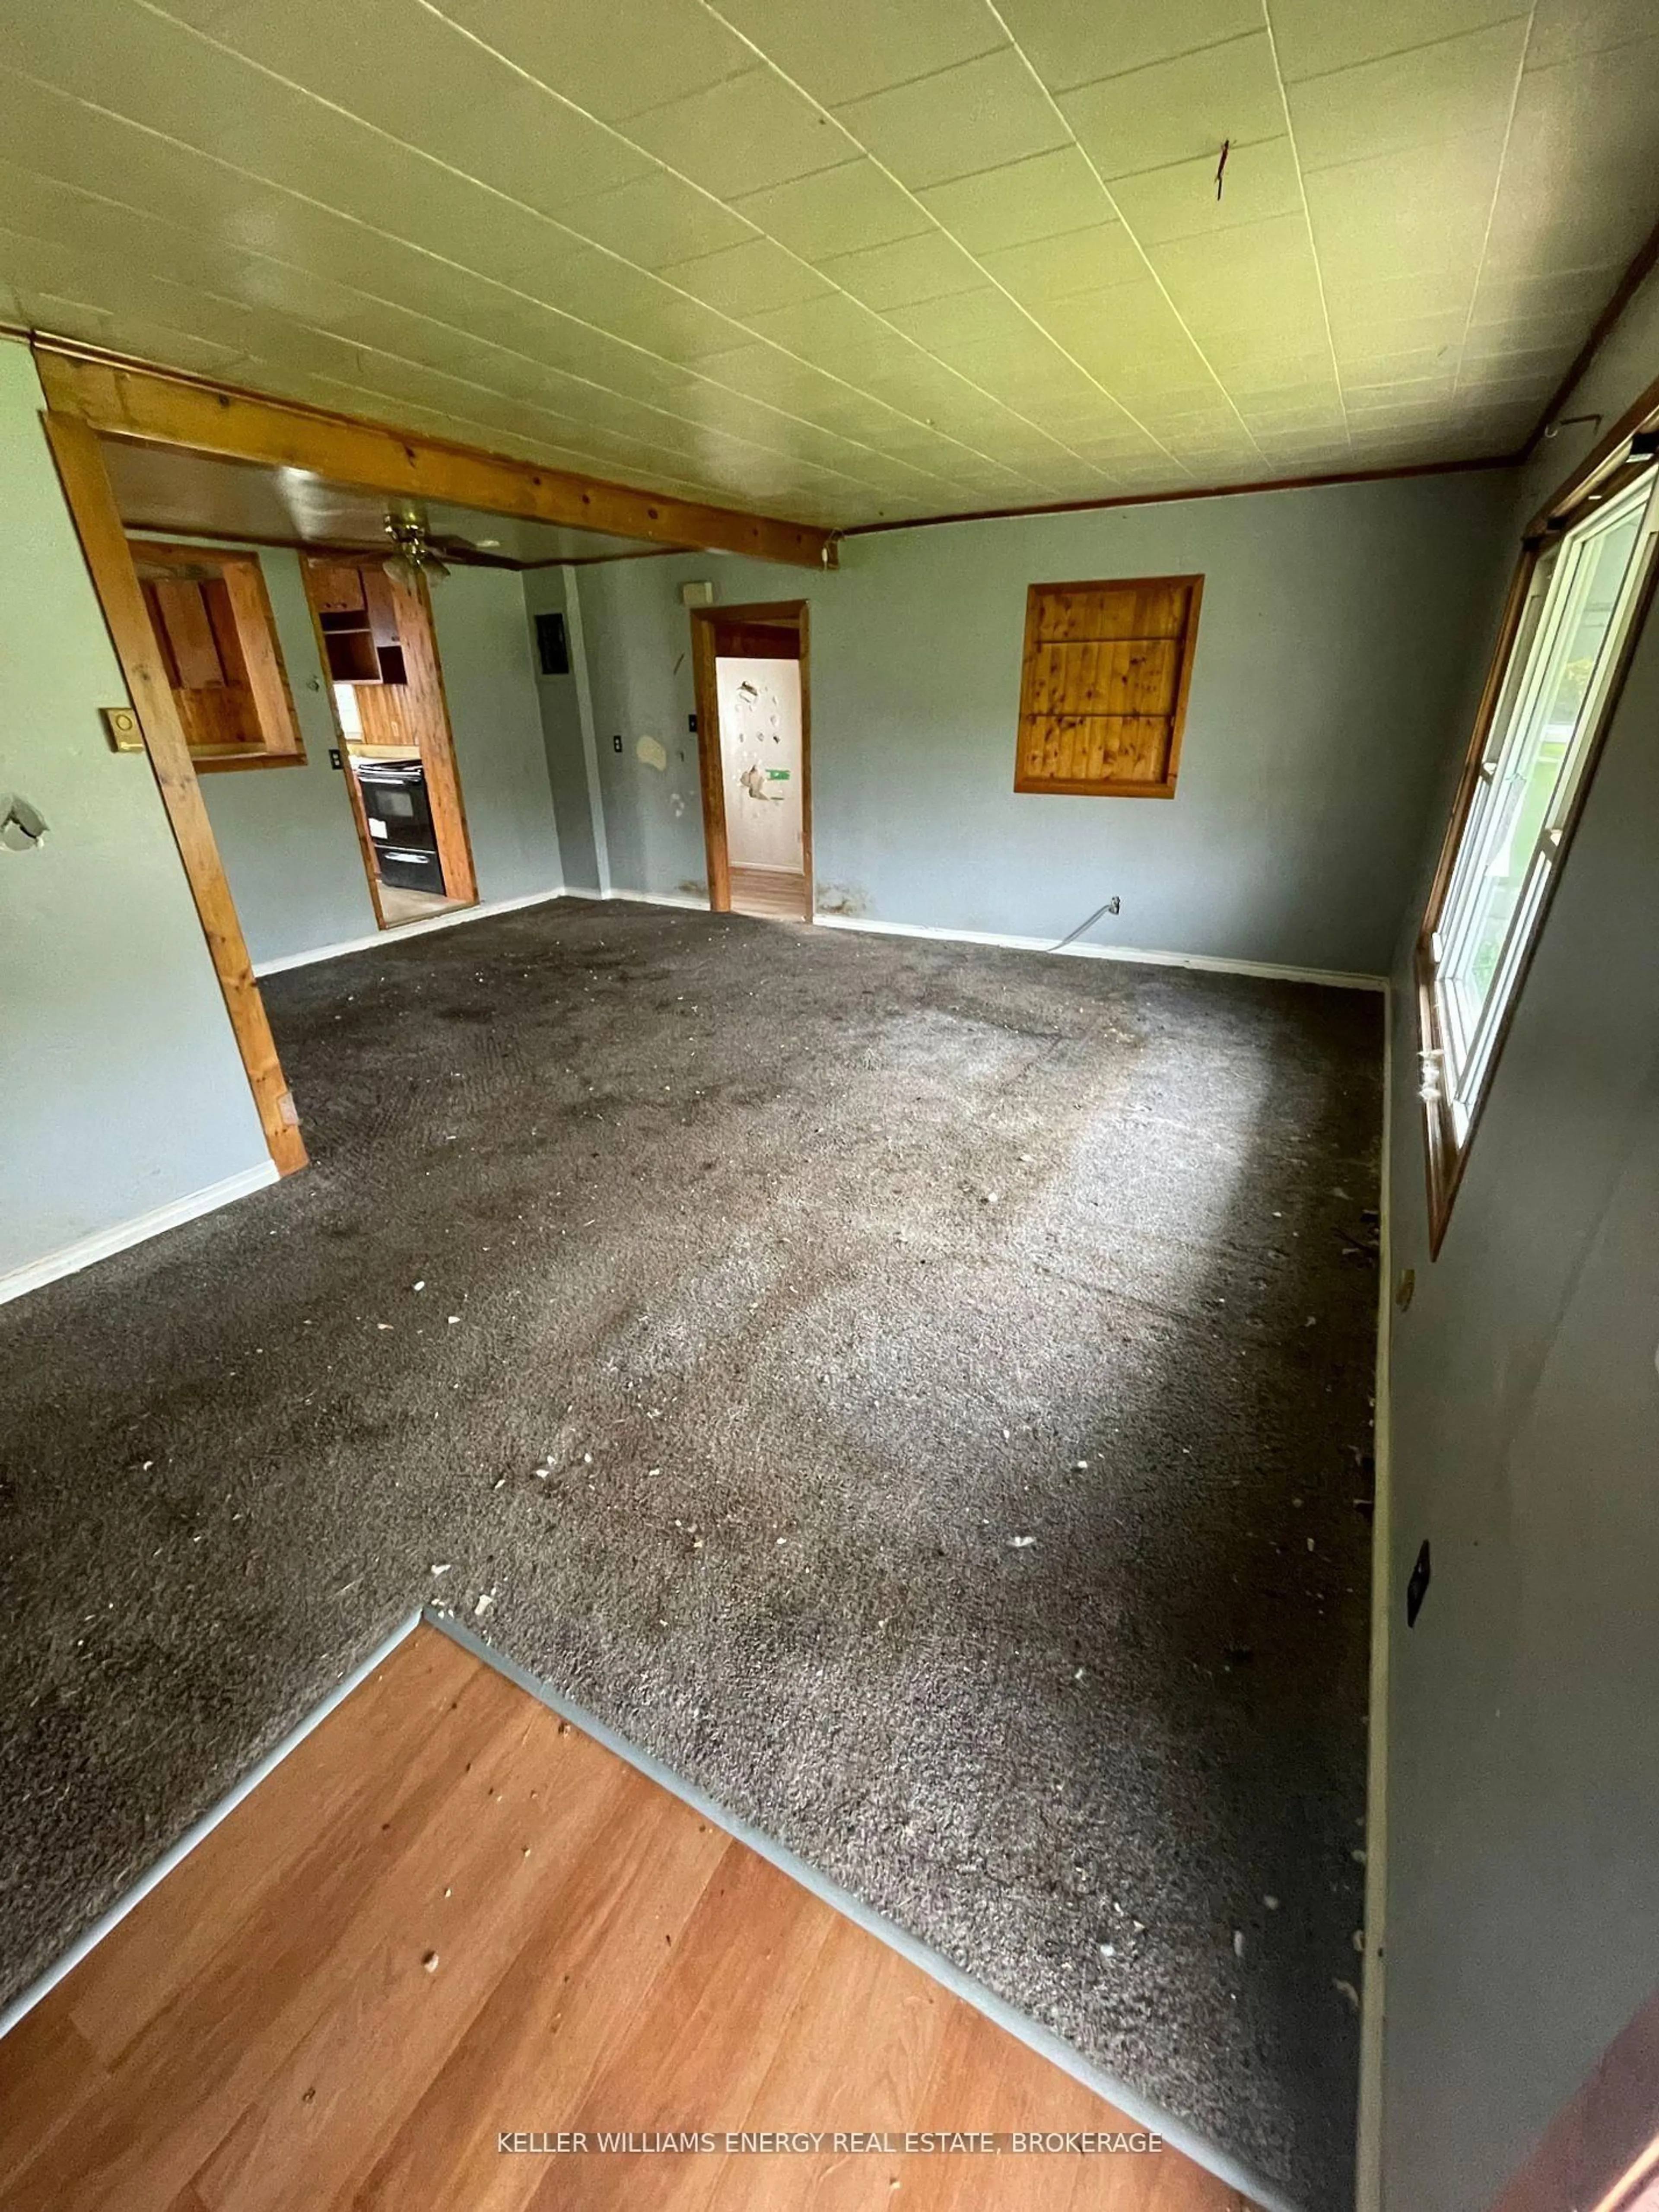
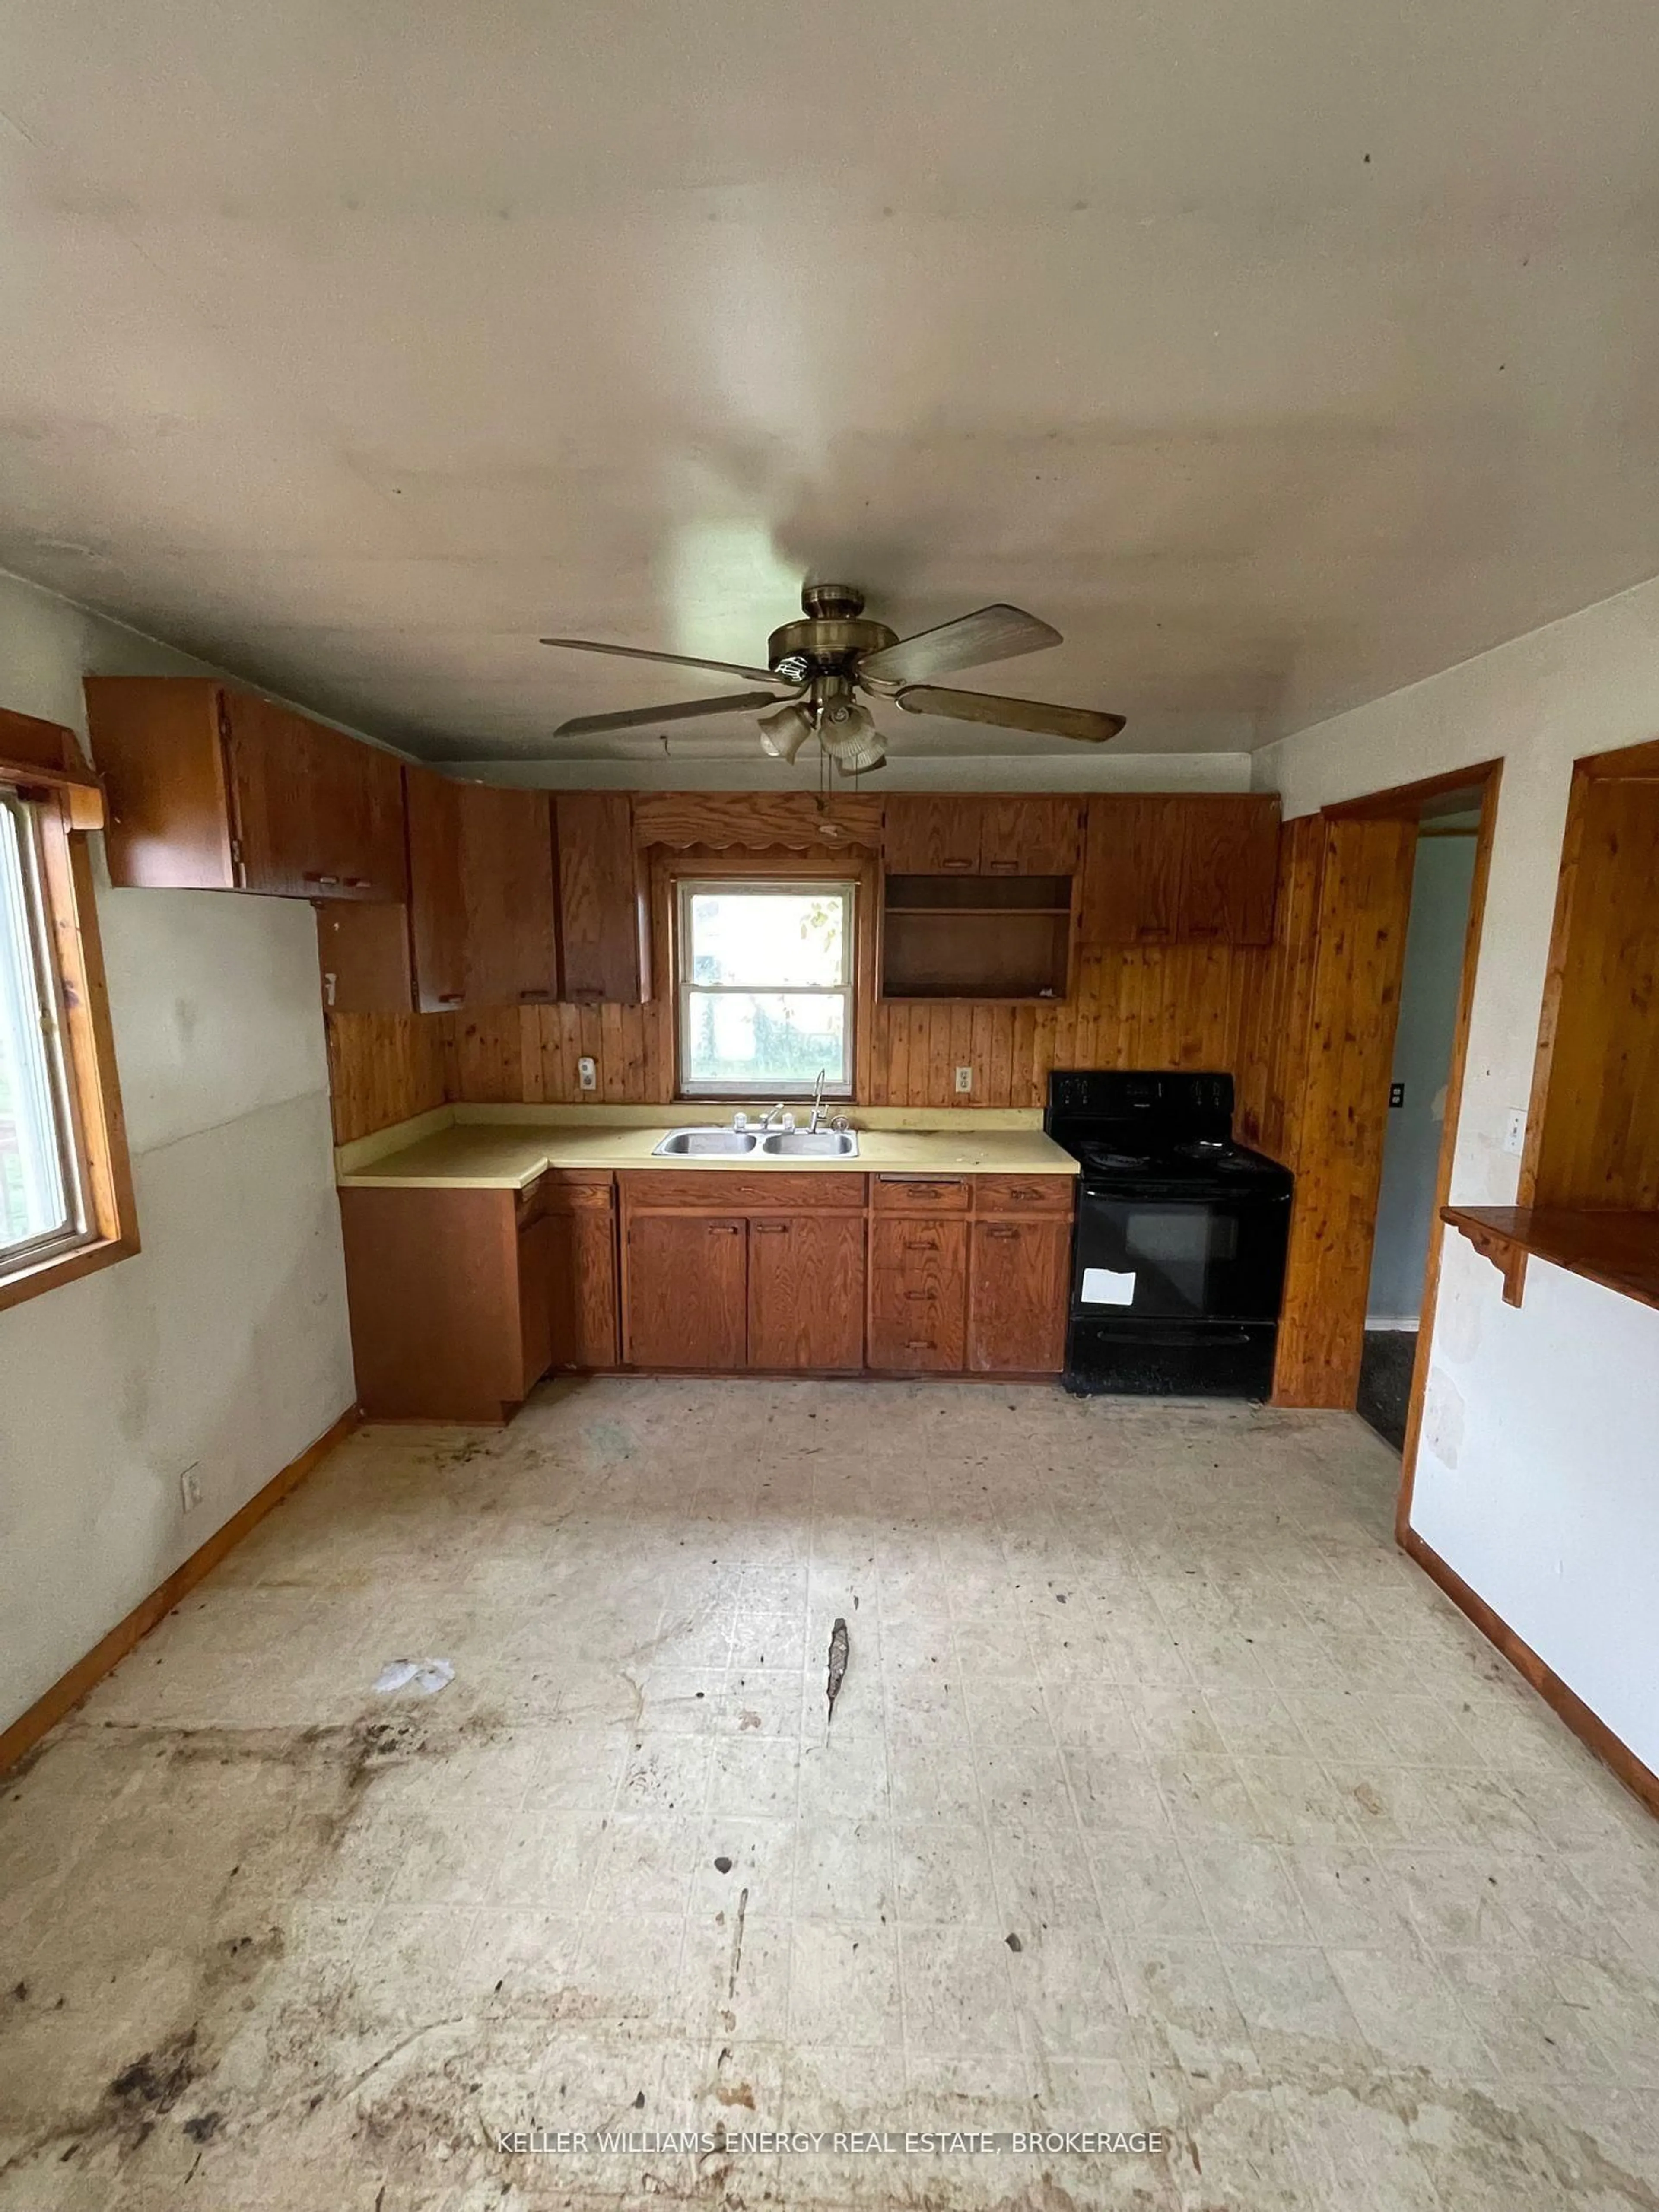
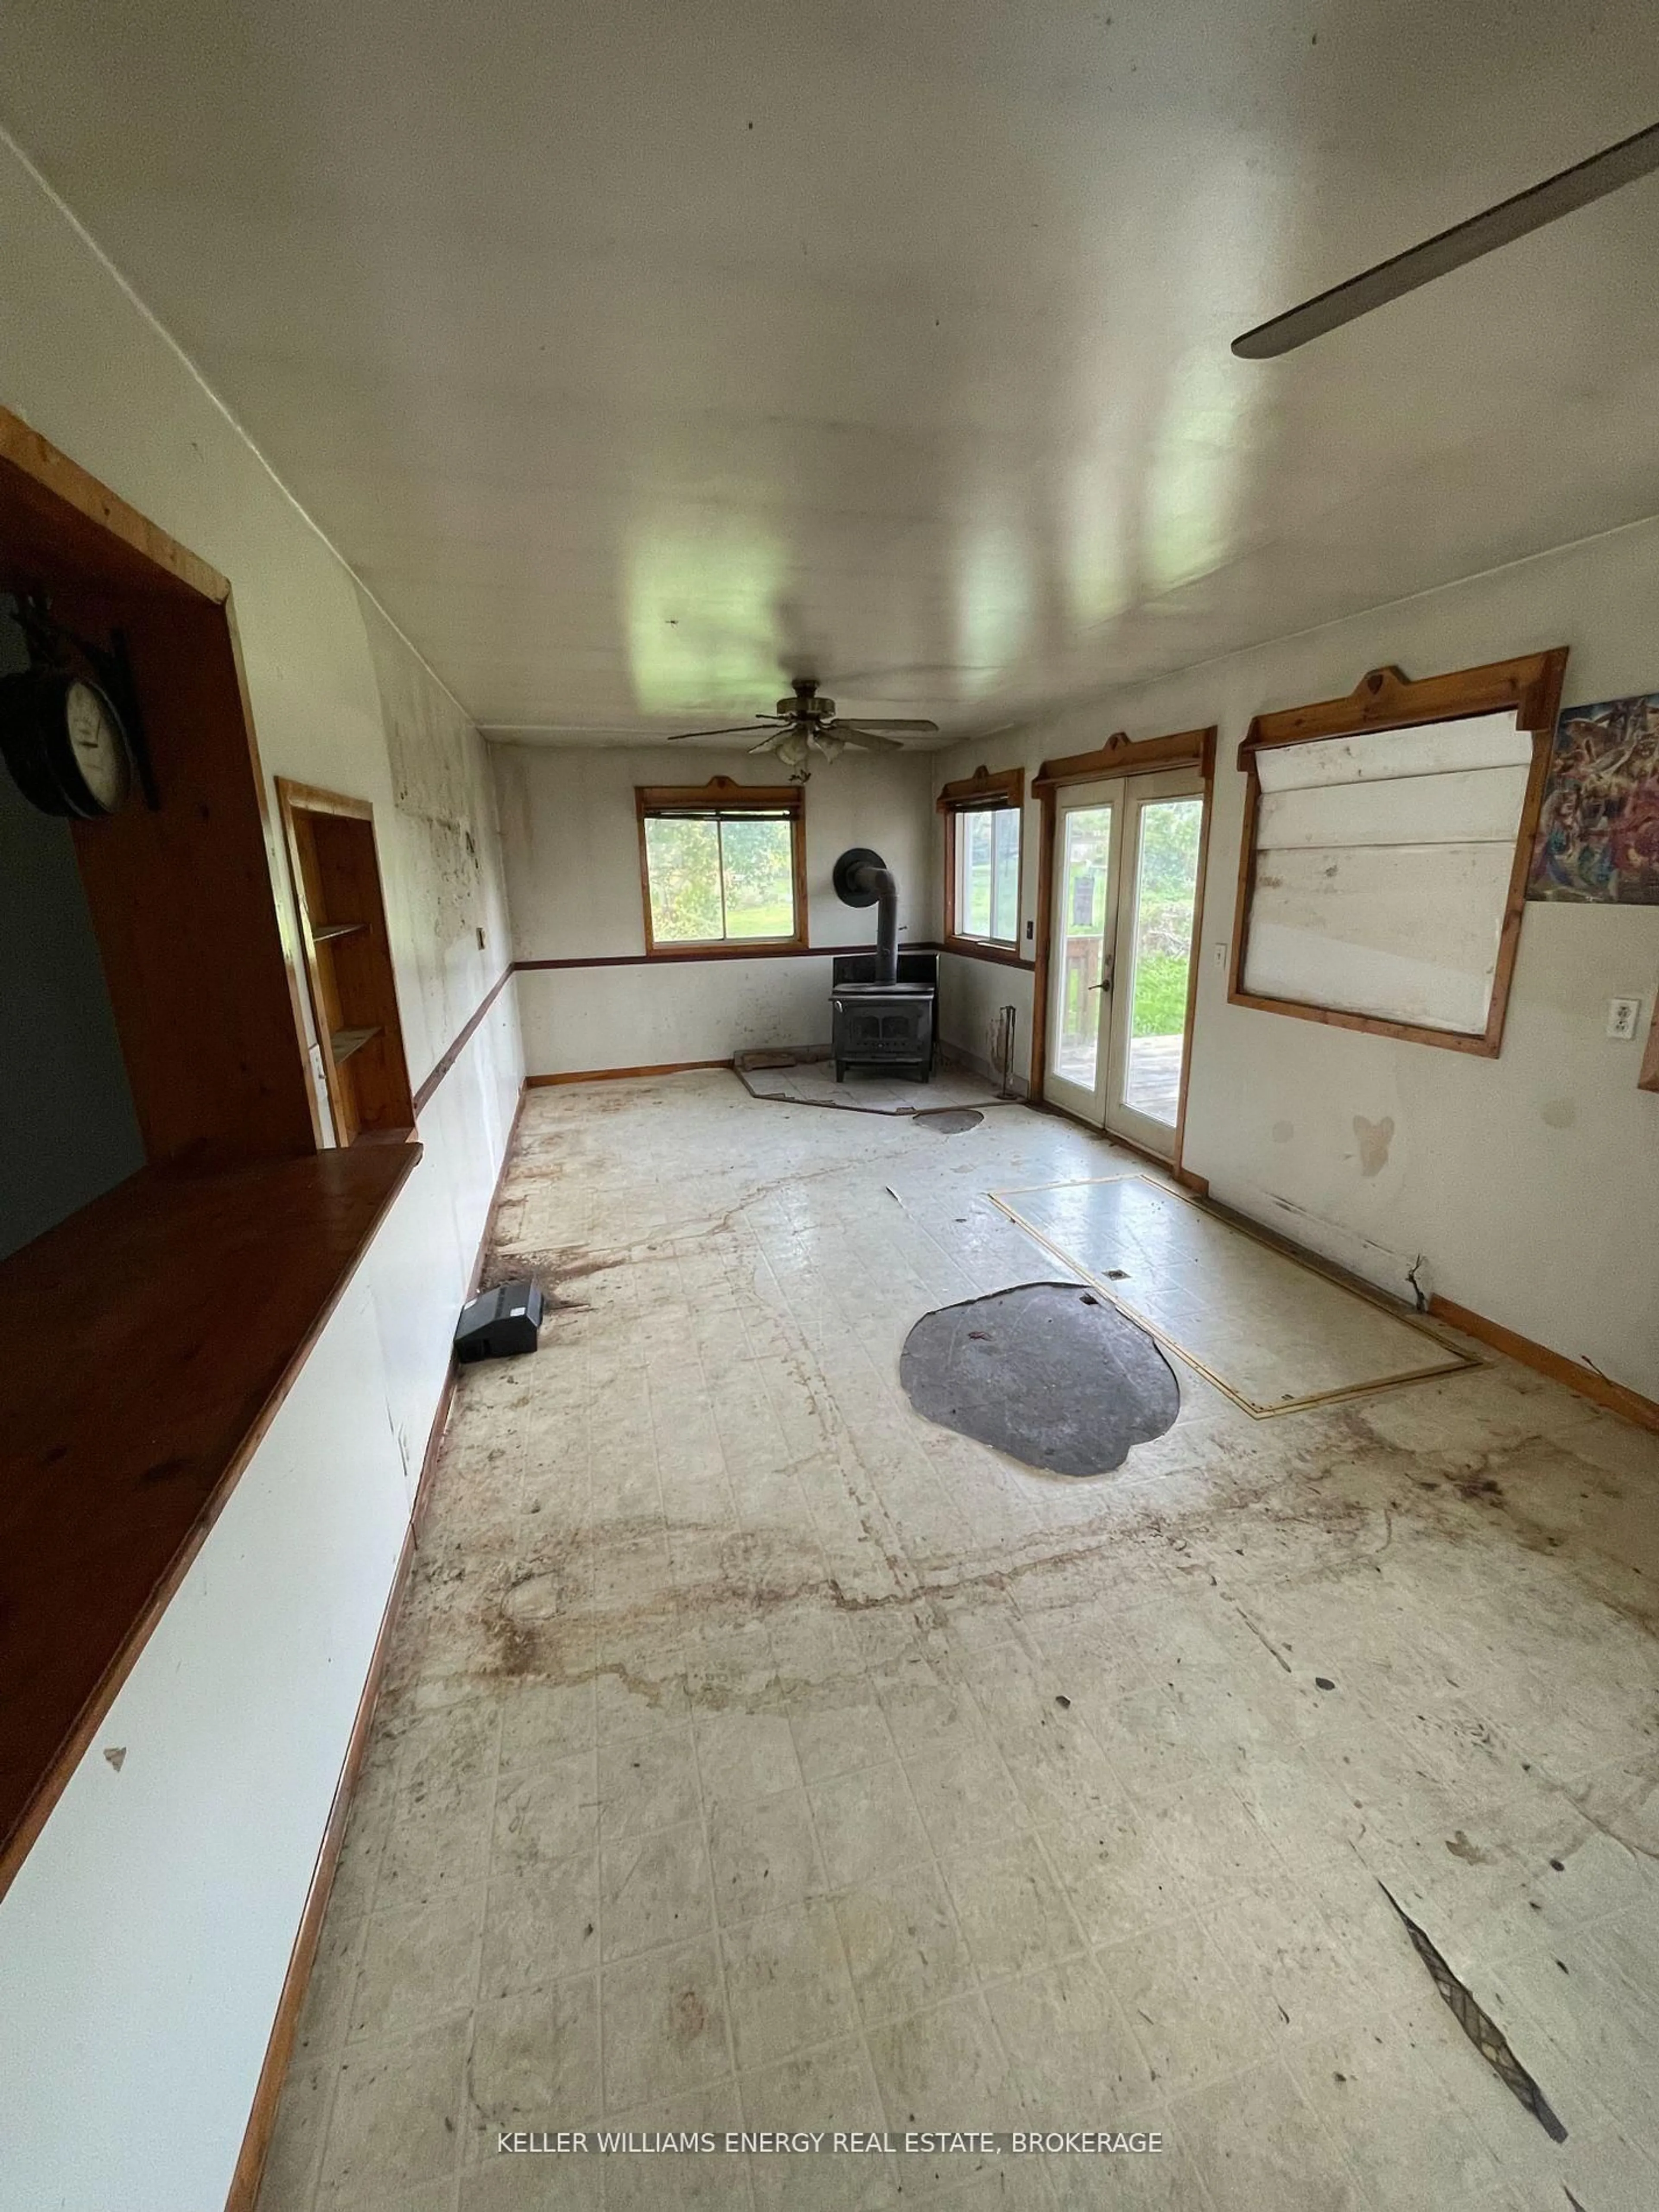
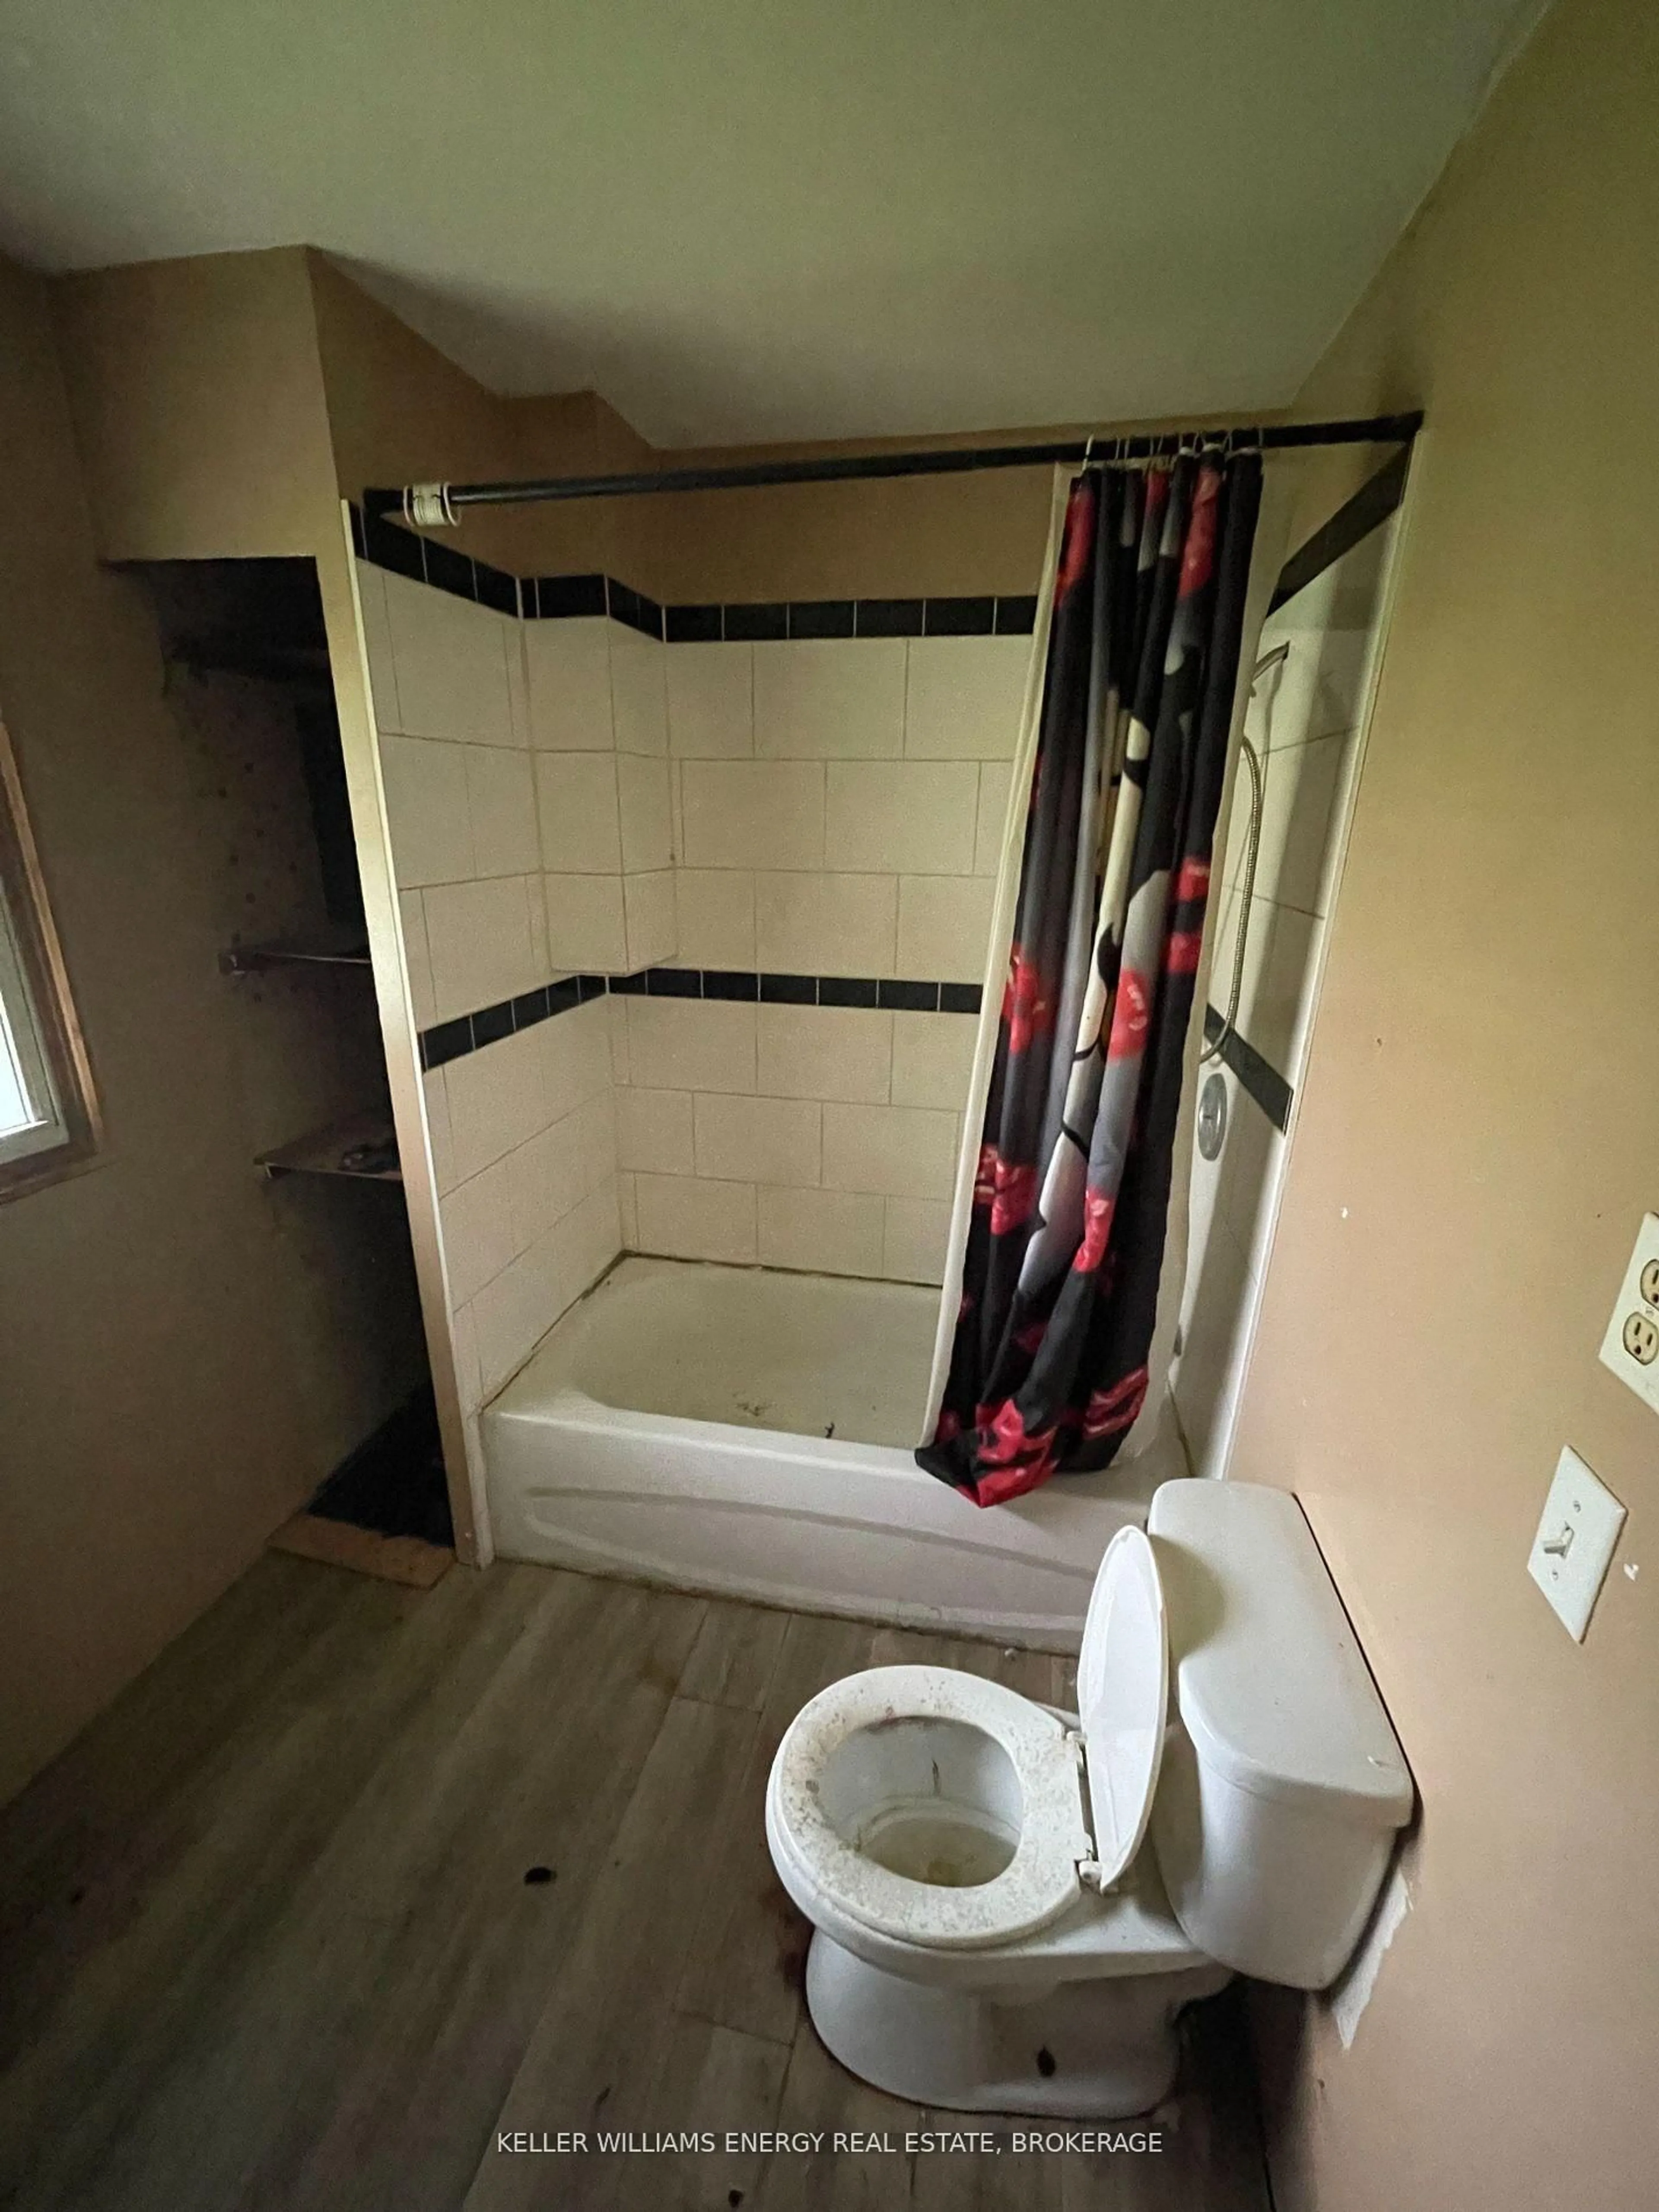
Bungalow On Over Half Acre Lot Across From Salmon River. Interior Features A Living/ Dining Space, Kitchen W/ Wood Stove As Well As 2 Bedrooms. Large Deck Off Back Of Home & Separate Garage At Back Of Property. Ideal Opportunity To Renovate, Property Has Tons Of Potential. This Property Is Not A Land Lease


Property Details

StyleBungalow
View-
Age of property-
SqFt~1100-1500 SqFt
Lot Size29,653 SqFt(278.65 x 106.42)
Parking Spaces3
MLS ®NumberX12211531
Community NameTyendinaga
Data SourceTRREB
Listing byKELLER WILLIAMS ENERGY REAL ESTATE, BROKERAGE

Features

Heating: Baseboard
Fireplace
Basement: Crawl Space

Features

Lot size: 29,653 SqFt

Parking

Garage spaces 1

Garage type Attached

Other parking spaces 2

Total parking spaces 3


Property listed by KELLER WILLIAMS ENERGY REAL ESTATE, BROKERAGE, Brokerage
Agent Banner Image
Interested in this property?Get in touch to get the inside scoop.

Market Data - Tyendinaga

Geo Zone Map ThumbnailTyendinaga

Strong Buyer's Market

View Market Data

Detached house - for the past 30 days

Buyer's market Seller's market

Avg. Days on Market

Past 30 days

33 days

Compared to

2024

62 days

2023

36 days

2022

4 days

New Listings

Past 30 days

12 listings

Compared to

2024

16 listings

2023

6 listings

2022

15 listings

Units sold

Past 30 days

3 units

Compared to

2024

9 units

2023

6 units

2022

3 units

Median Sold Price

Past 30 days

$580,000

Compared to

2024

$649,900

2023

$667,500

2022

$486,000


Population and Demographics

Overview

Total population 4729
Average household income $121,519

Age (%)

0 to 19
23%
20 to 34
17%
35 to 49
18%
50 to 64
25%
65 and plus
17%

Household composition (%)

Single family
76%
Single person
20%
Multi person
3%
Multi family
0%

Mother tongue (%)

English
97%
Others
2%

House tenancy (%)

Owners
92%
Renters
8%

What’s nearby?Essentials within 5 km

Local Logic

Transportation Scores

Estimated Budget