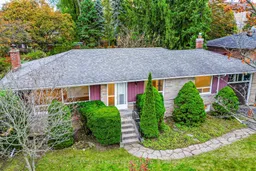
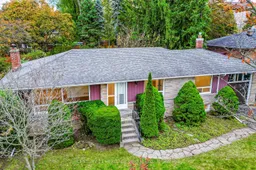
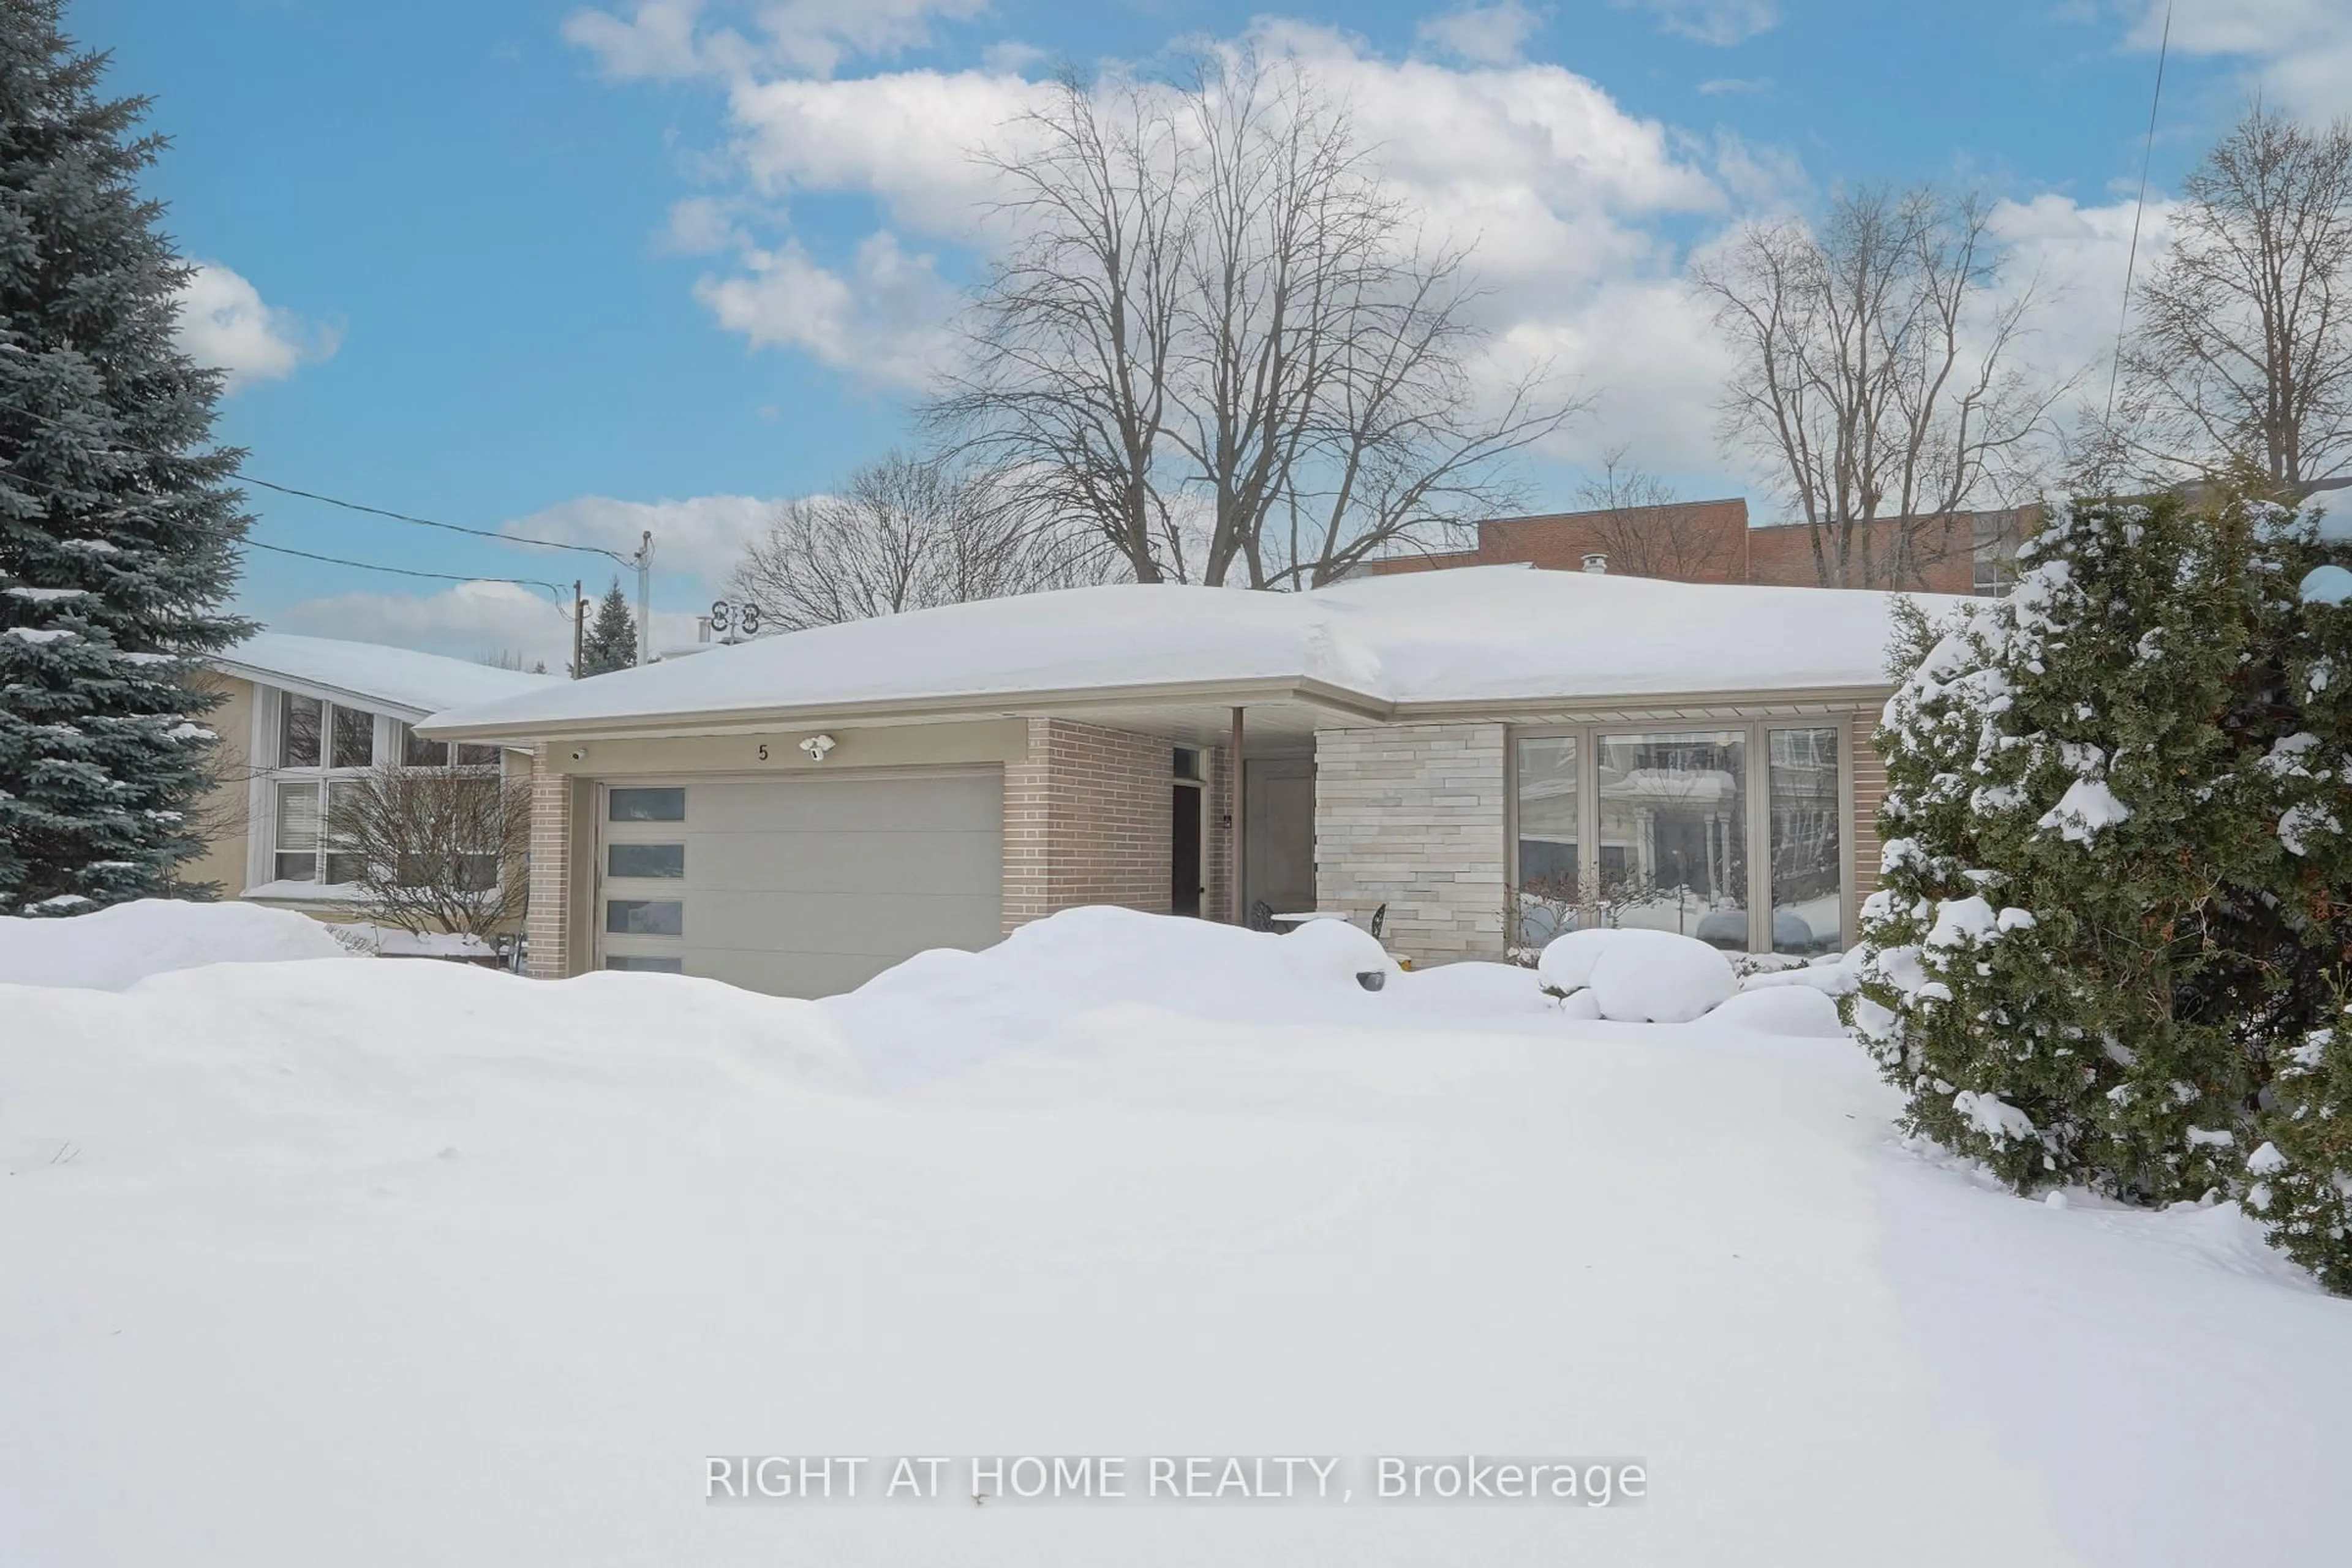
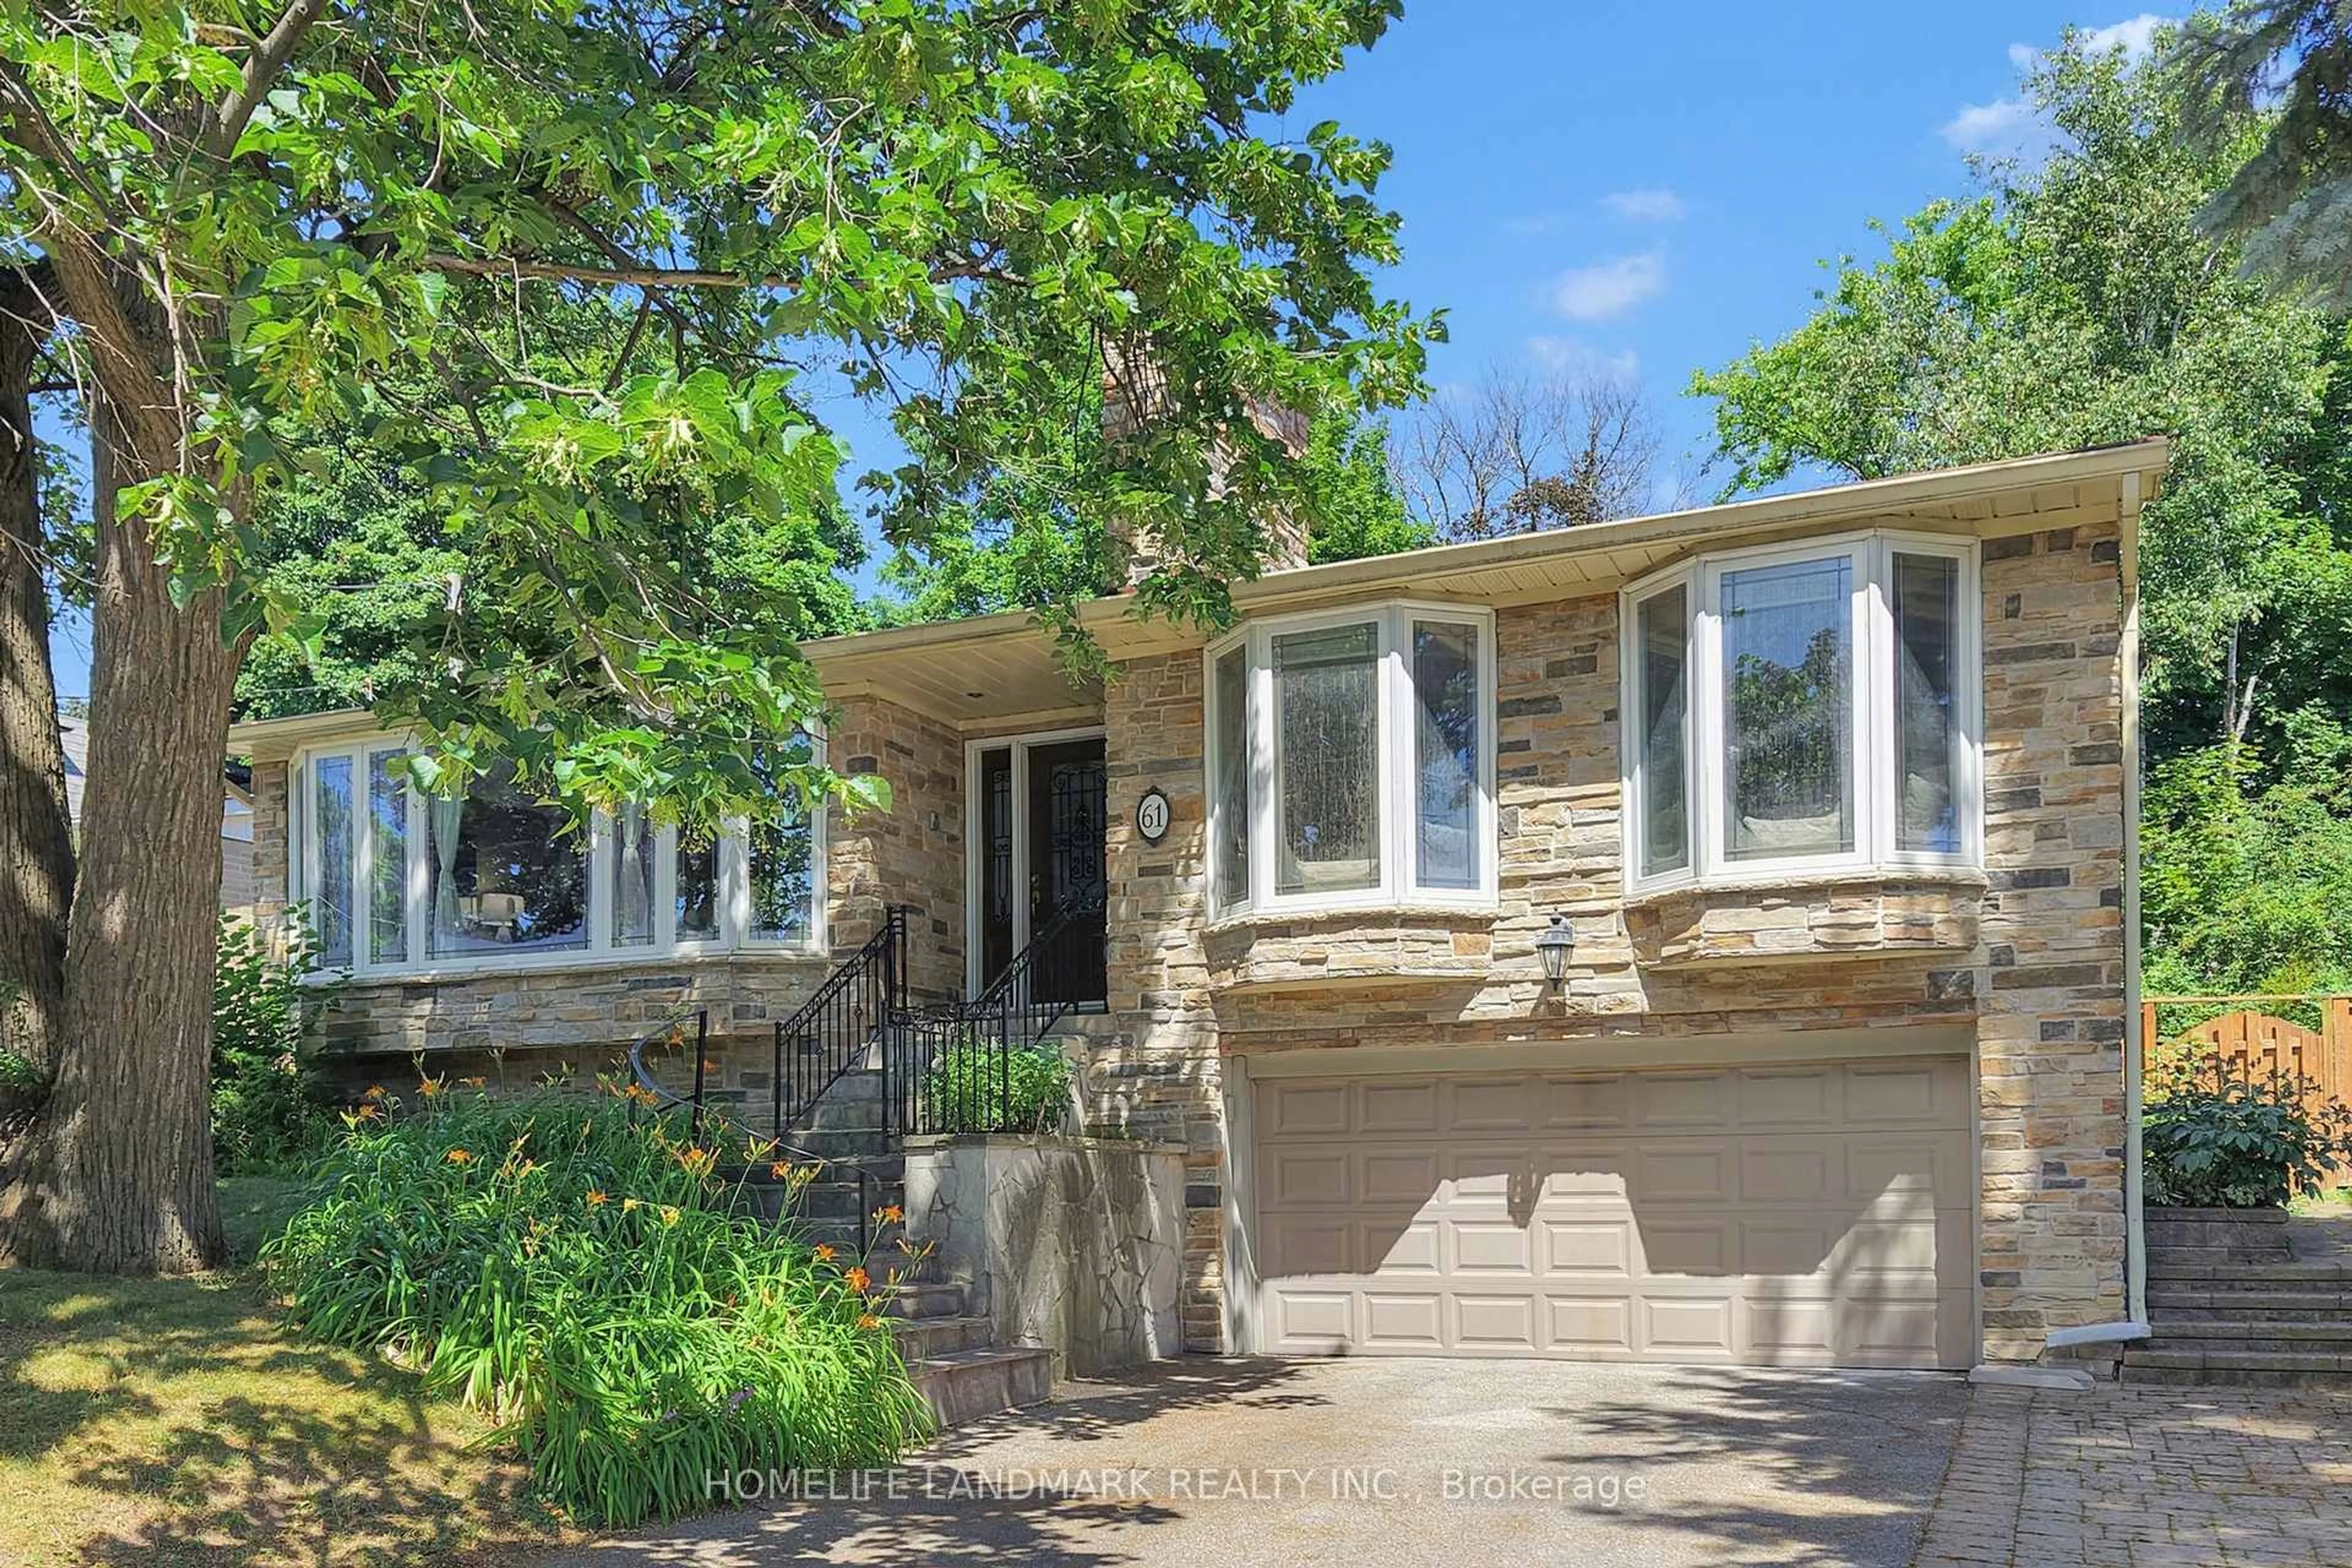
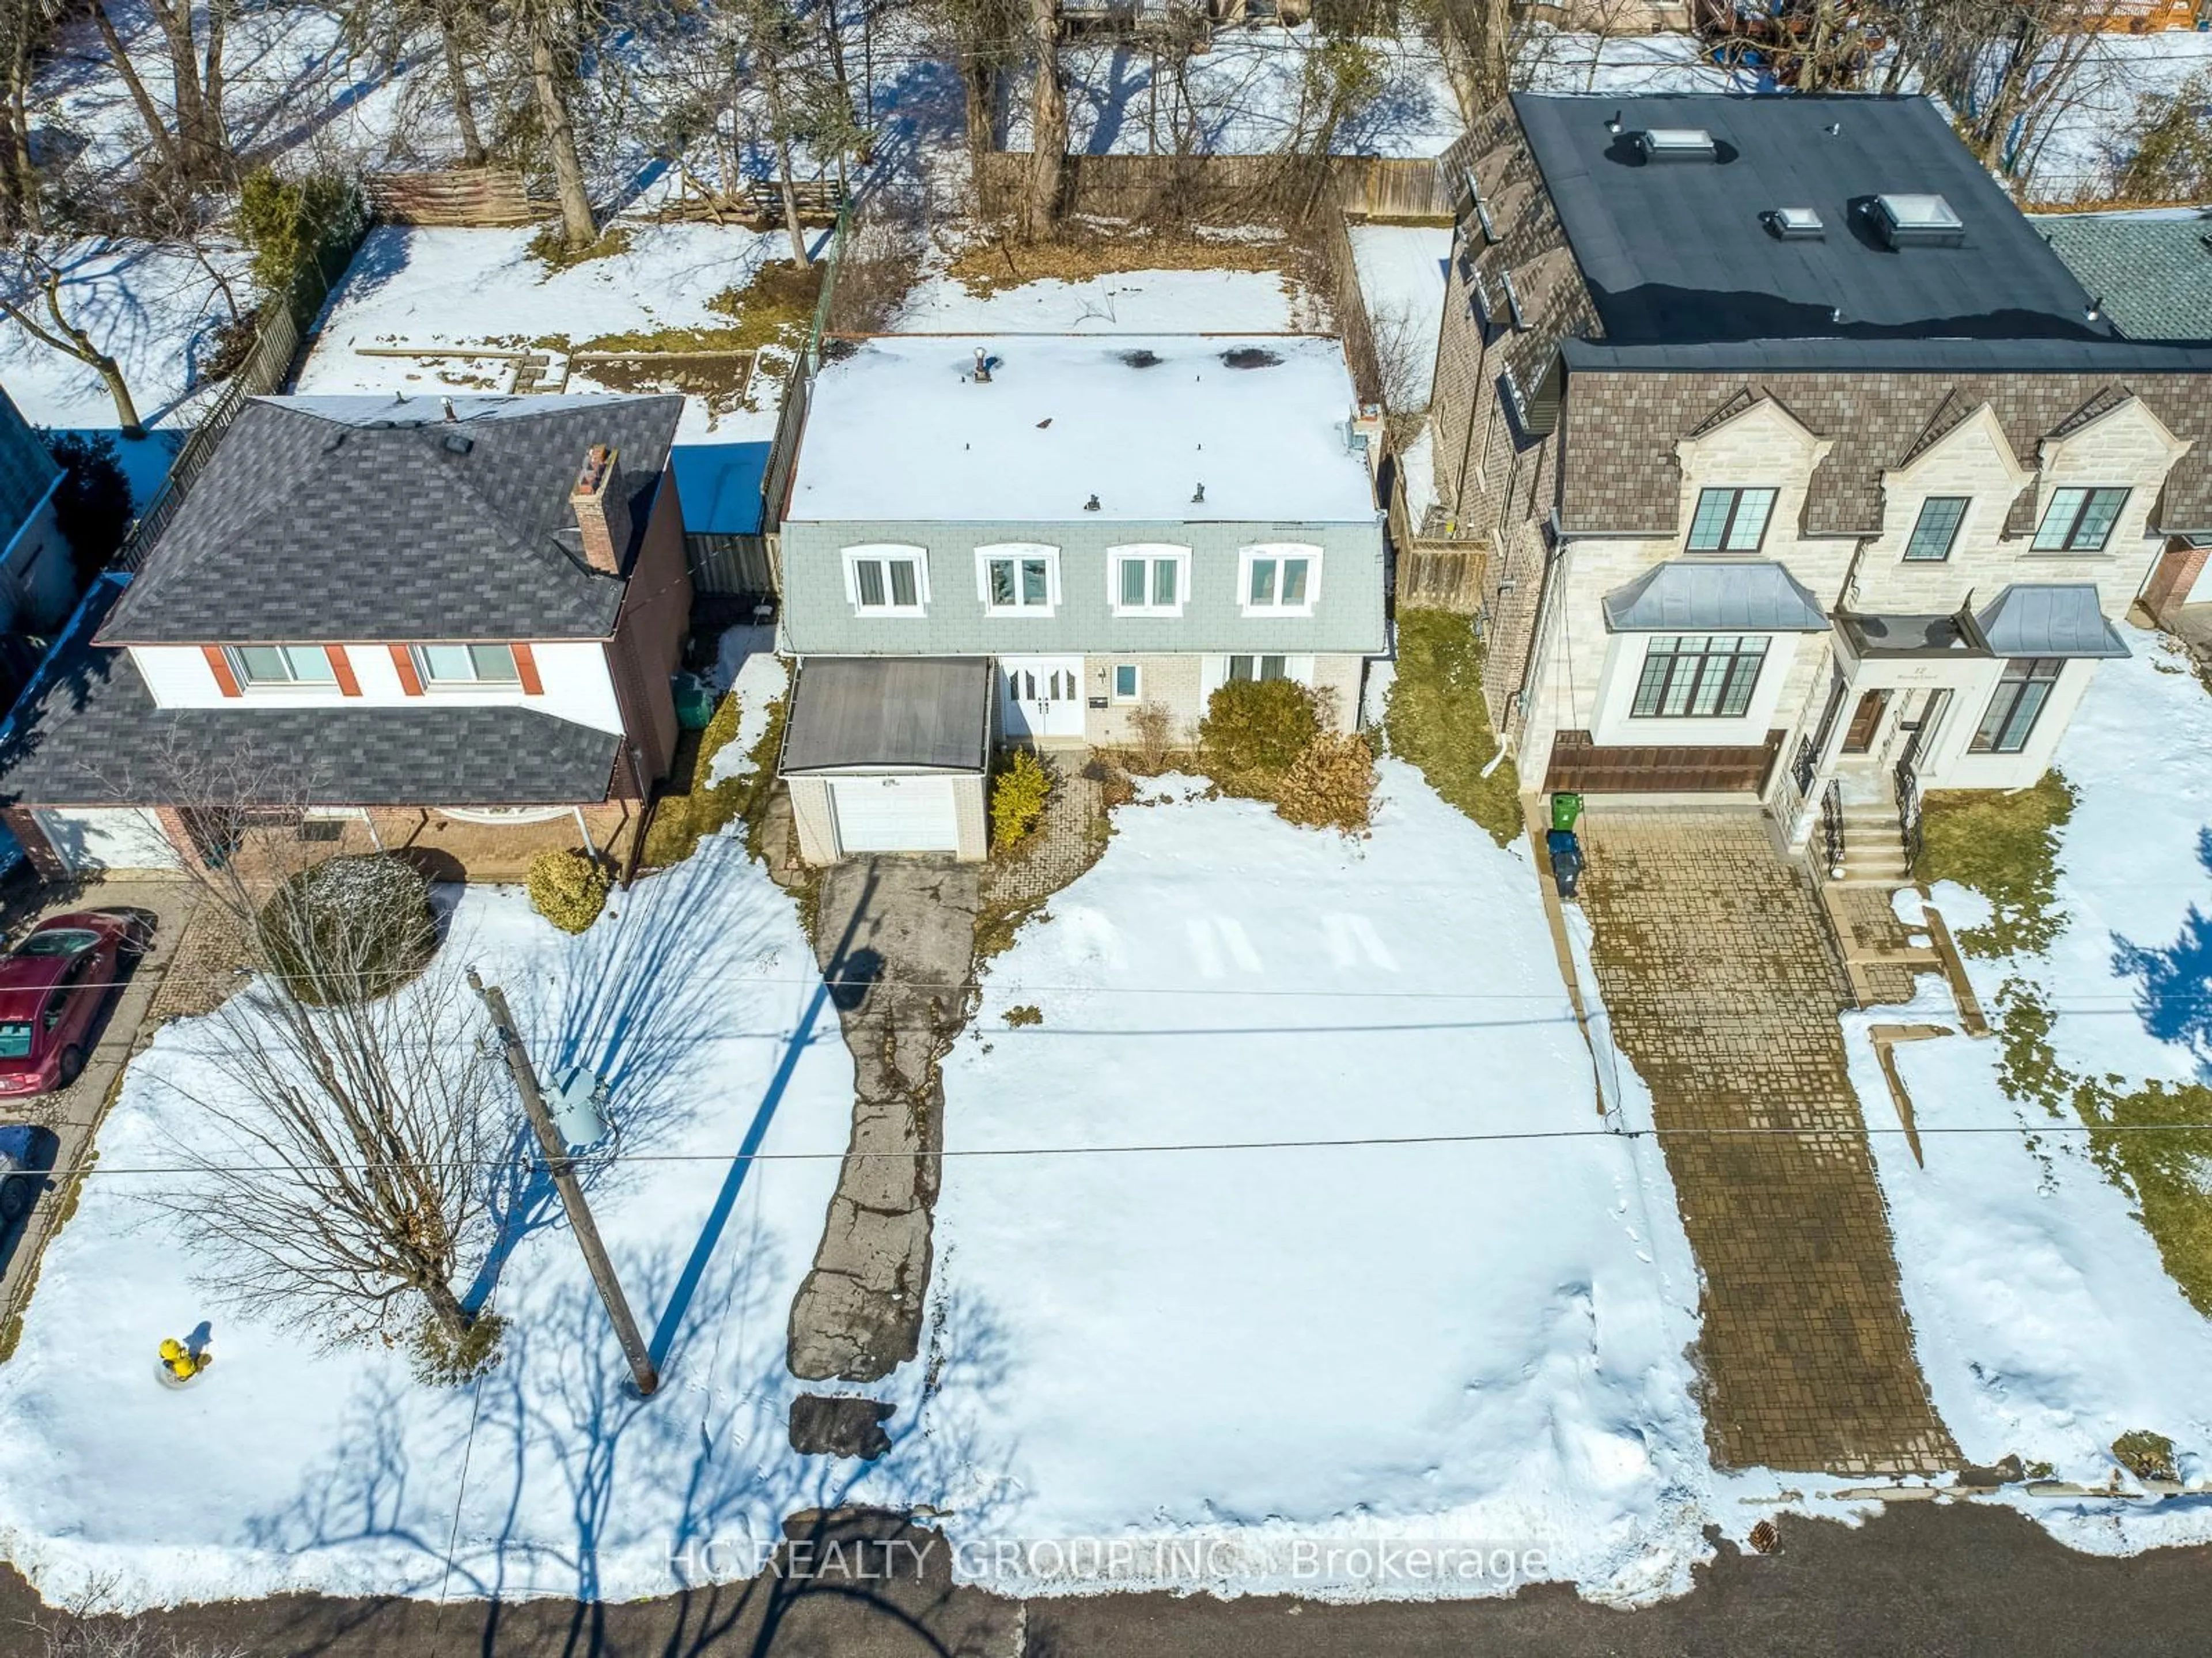
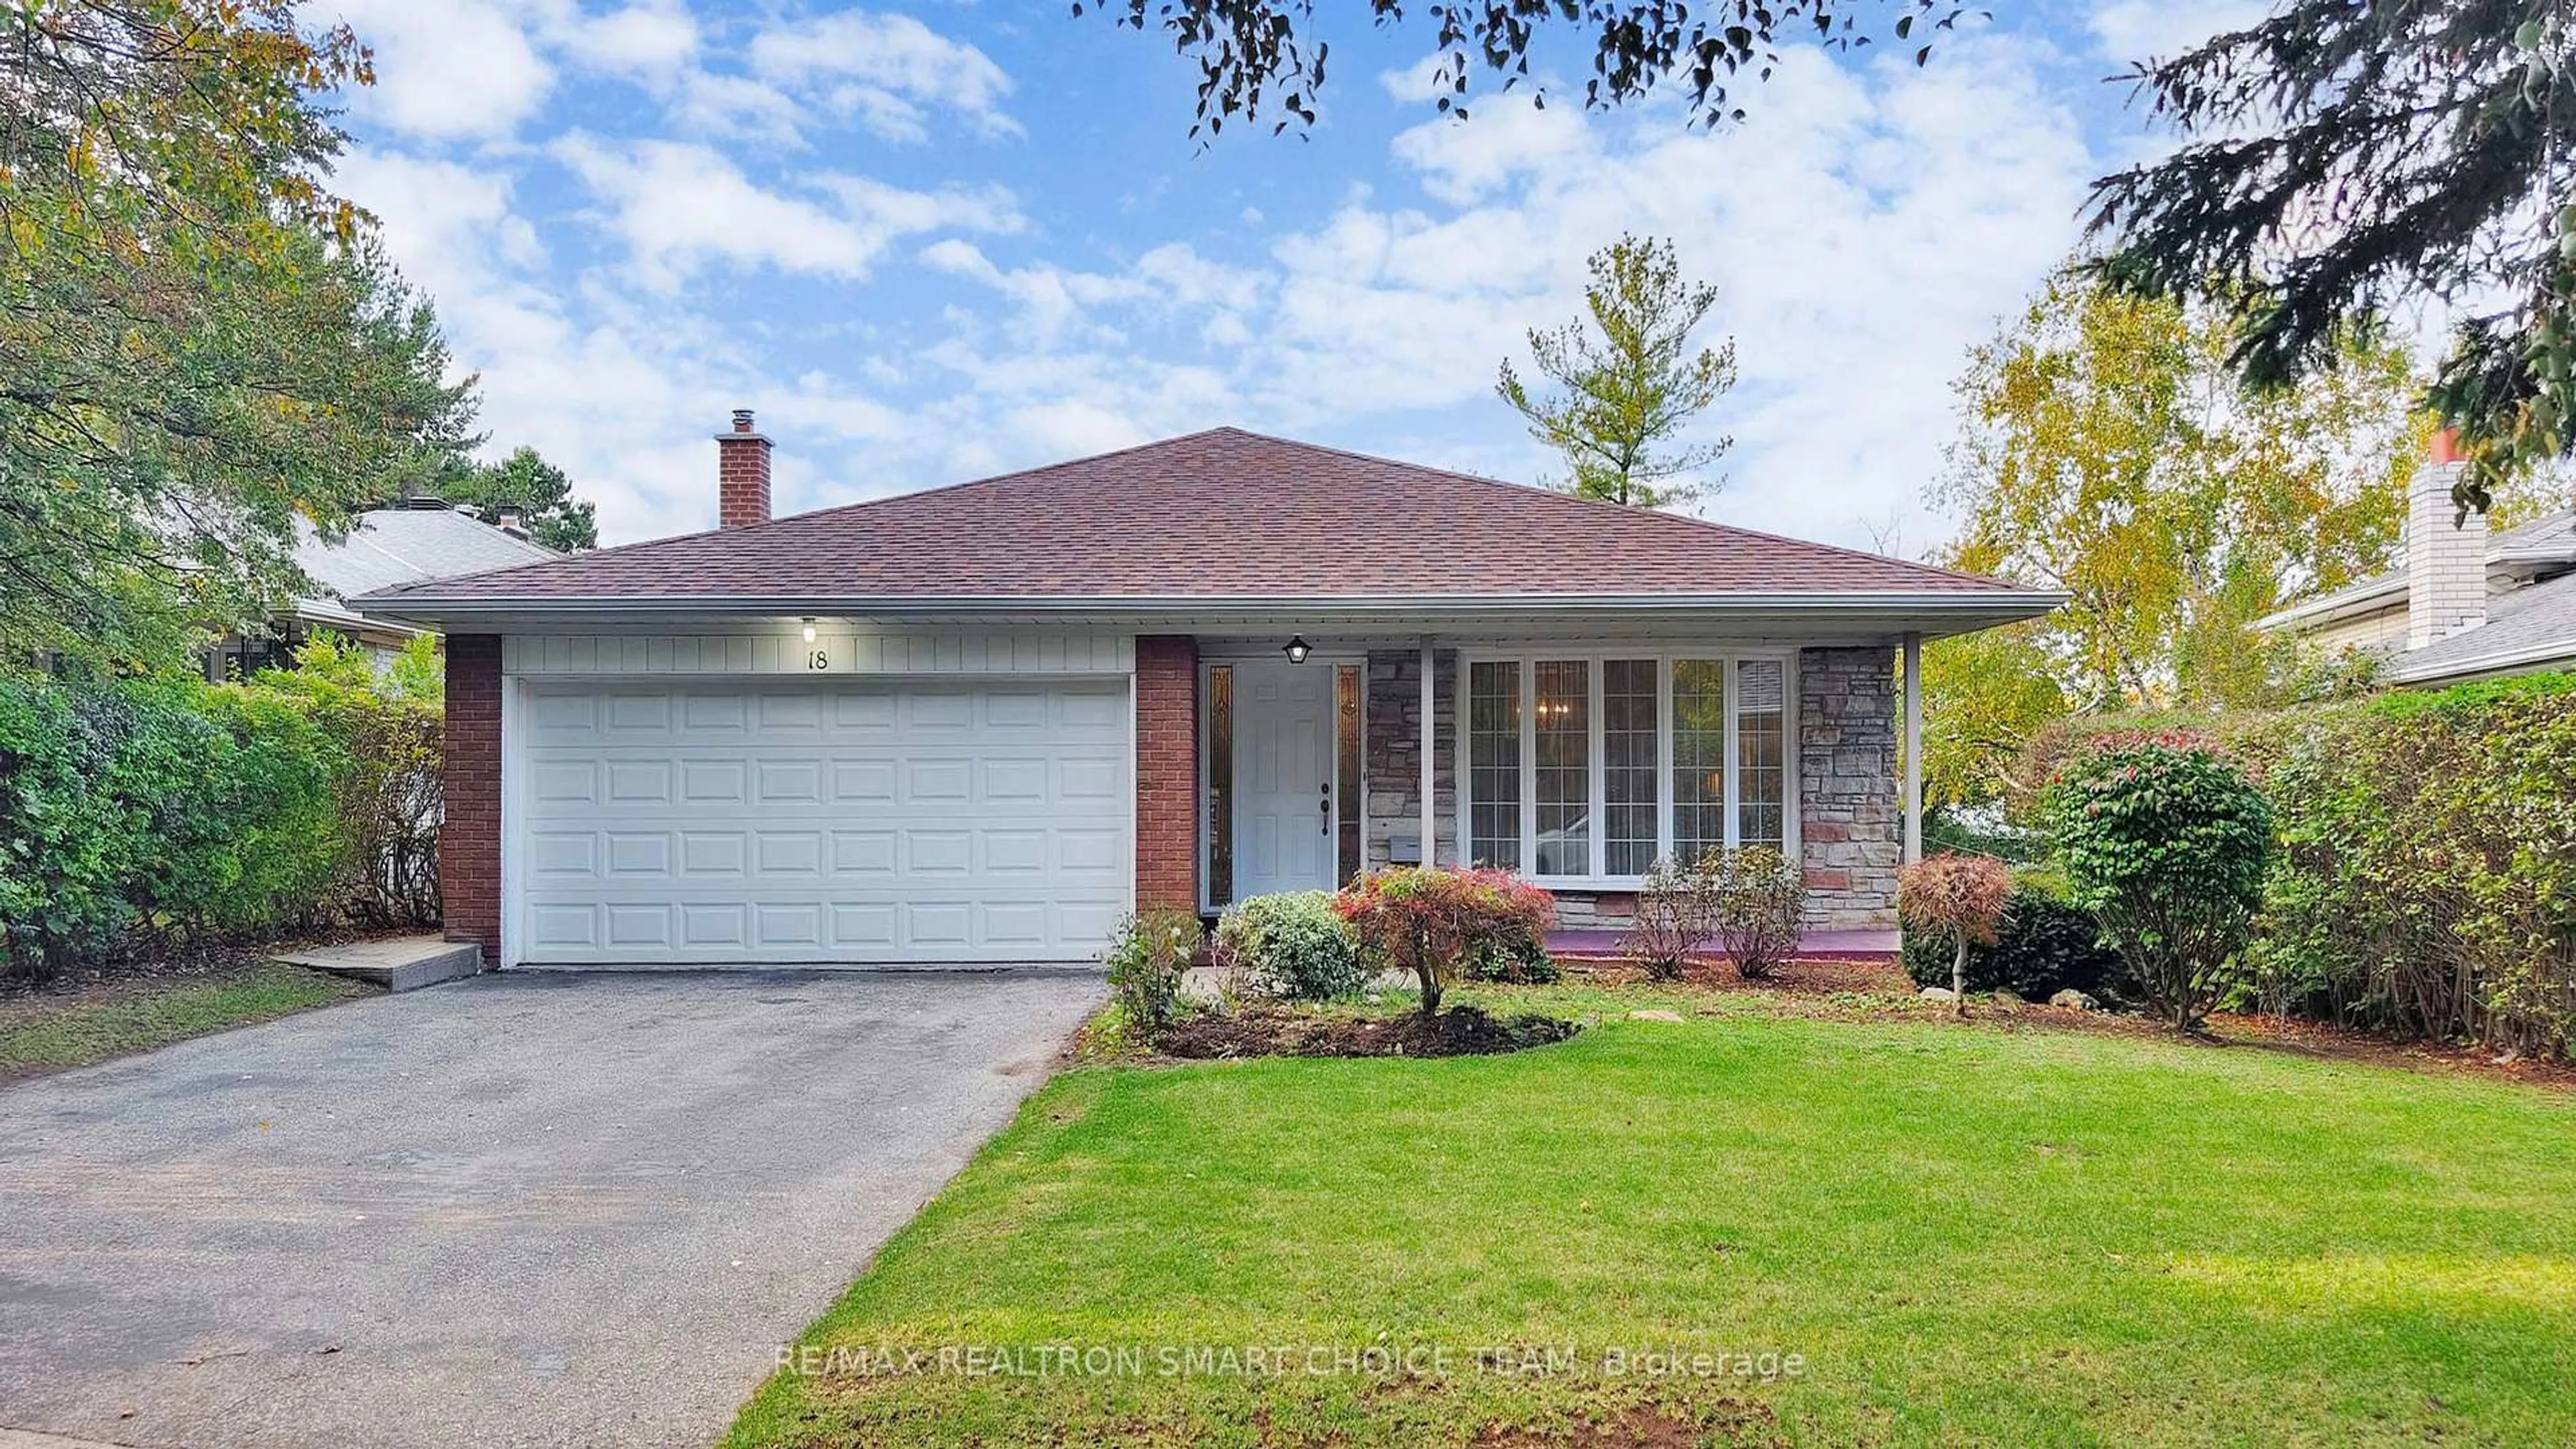
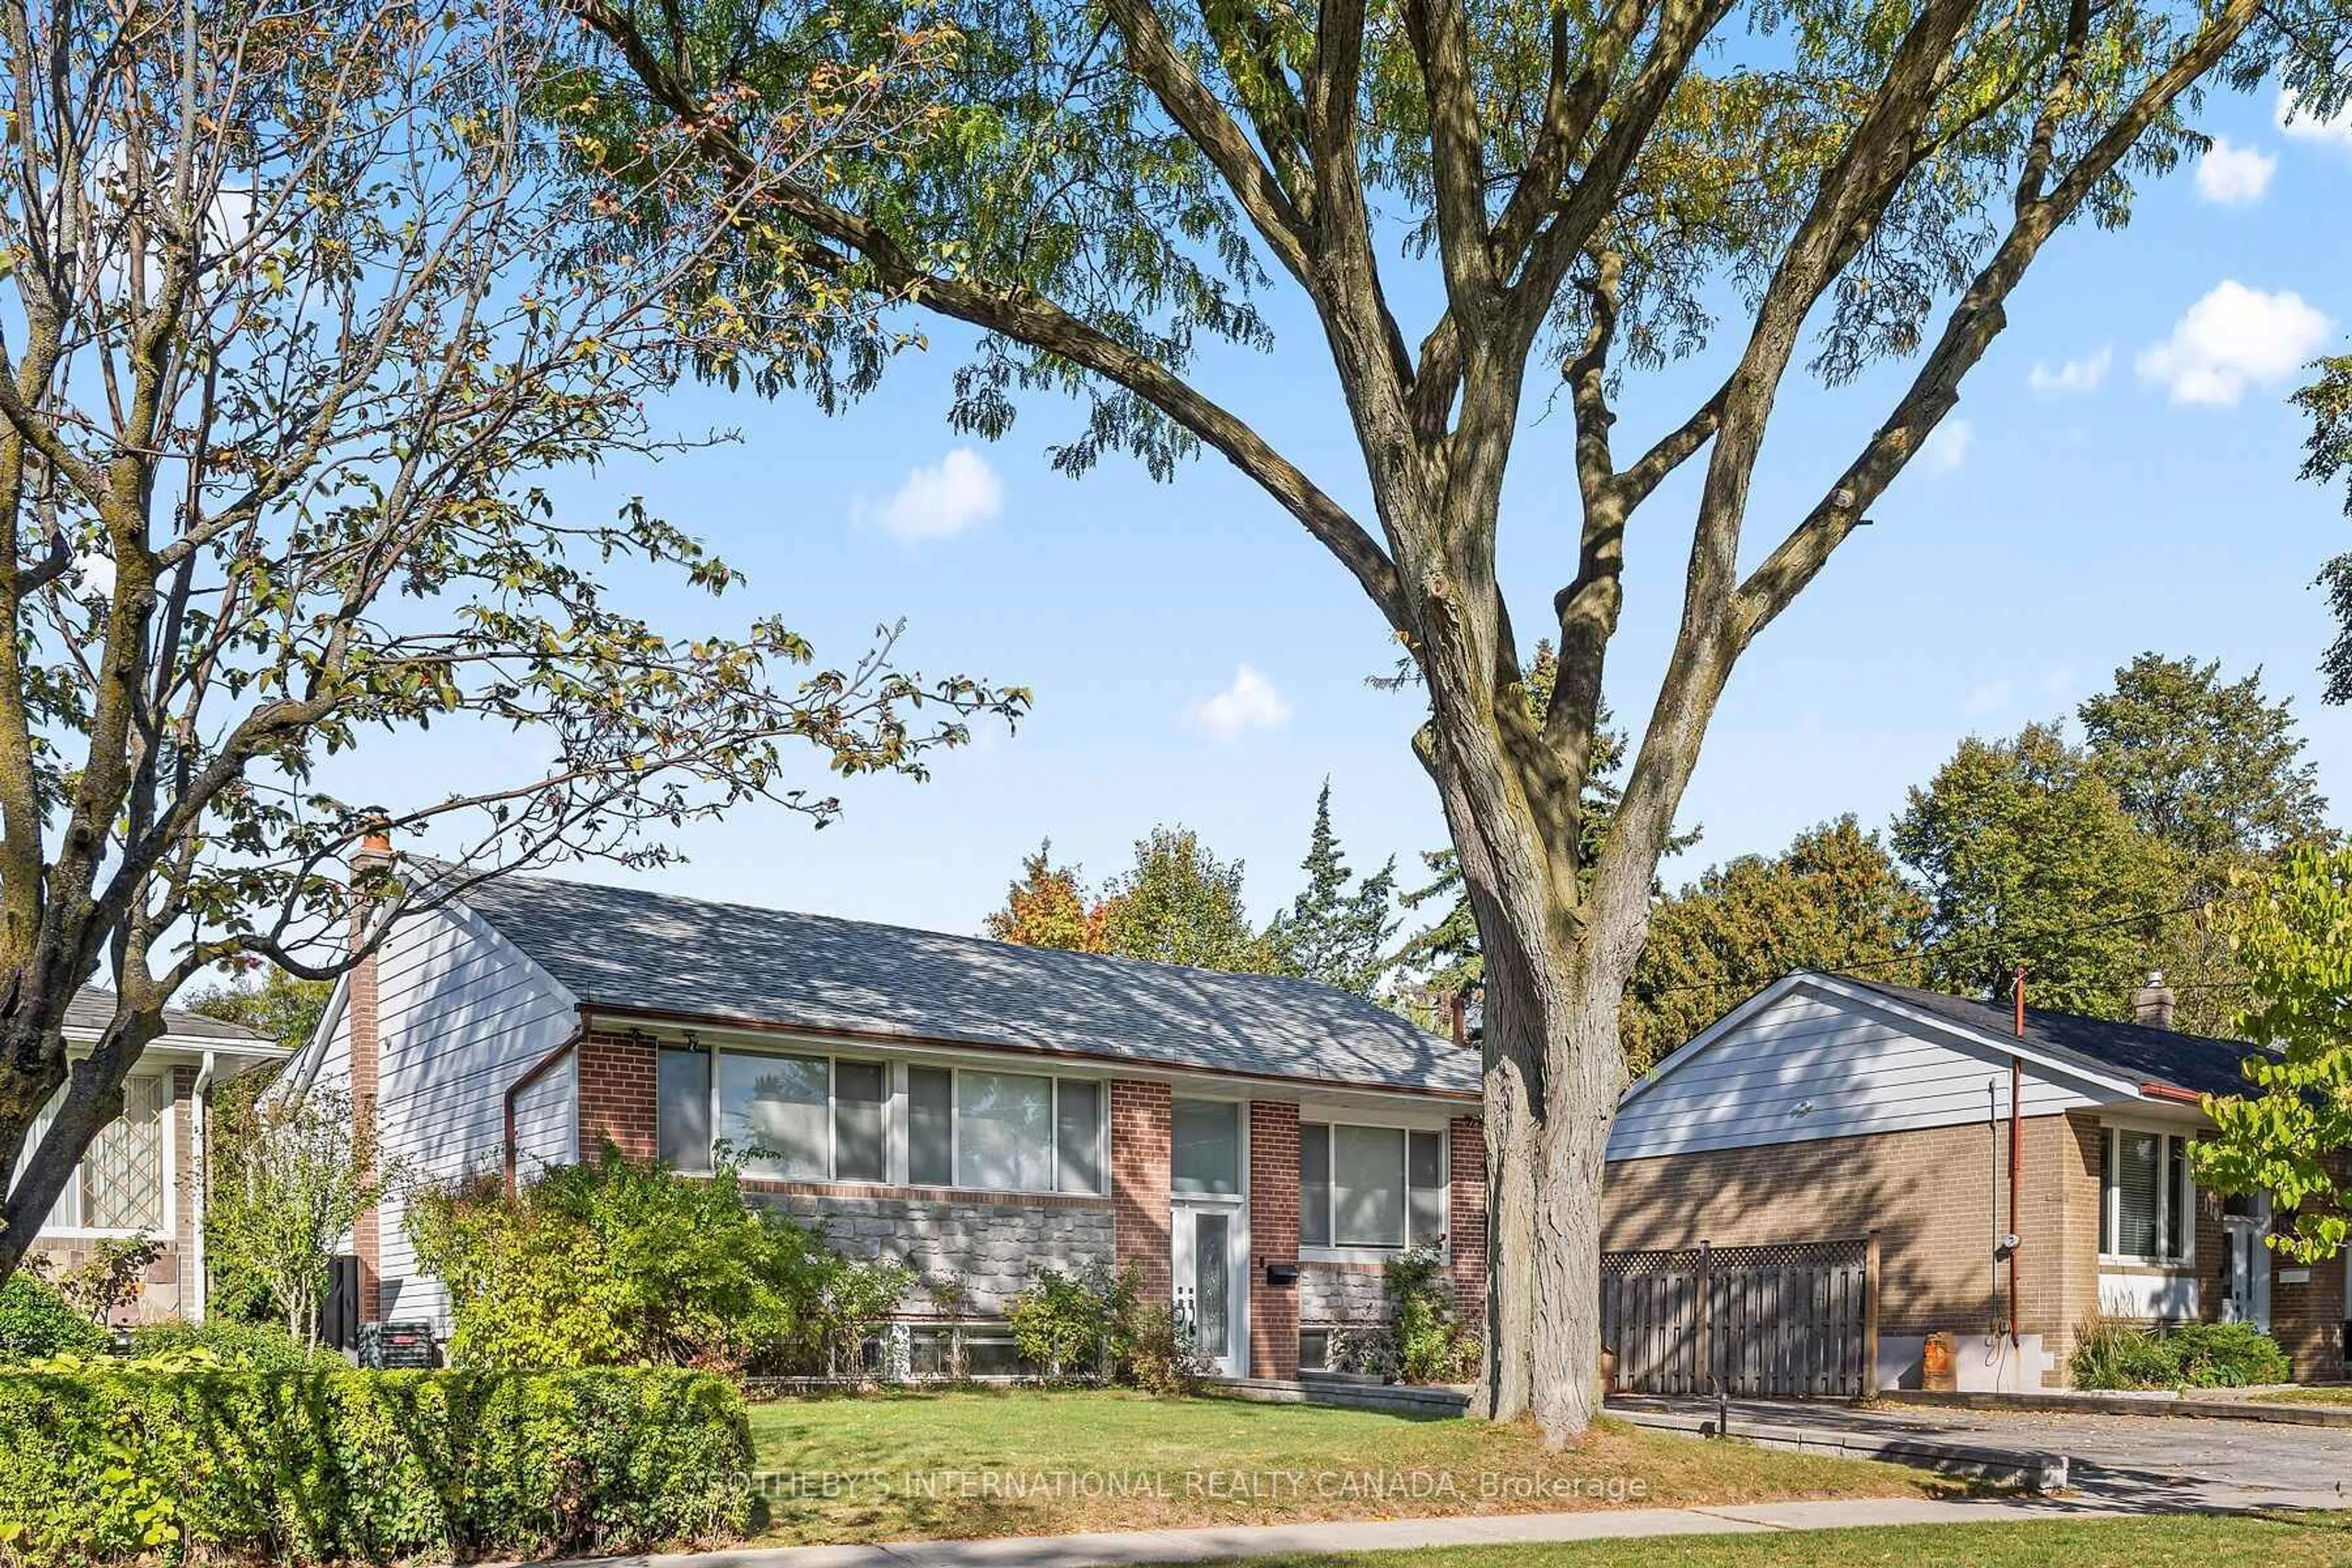
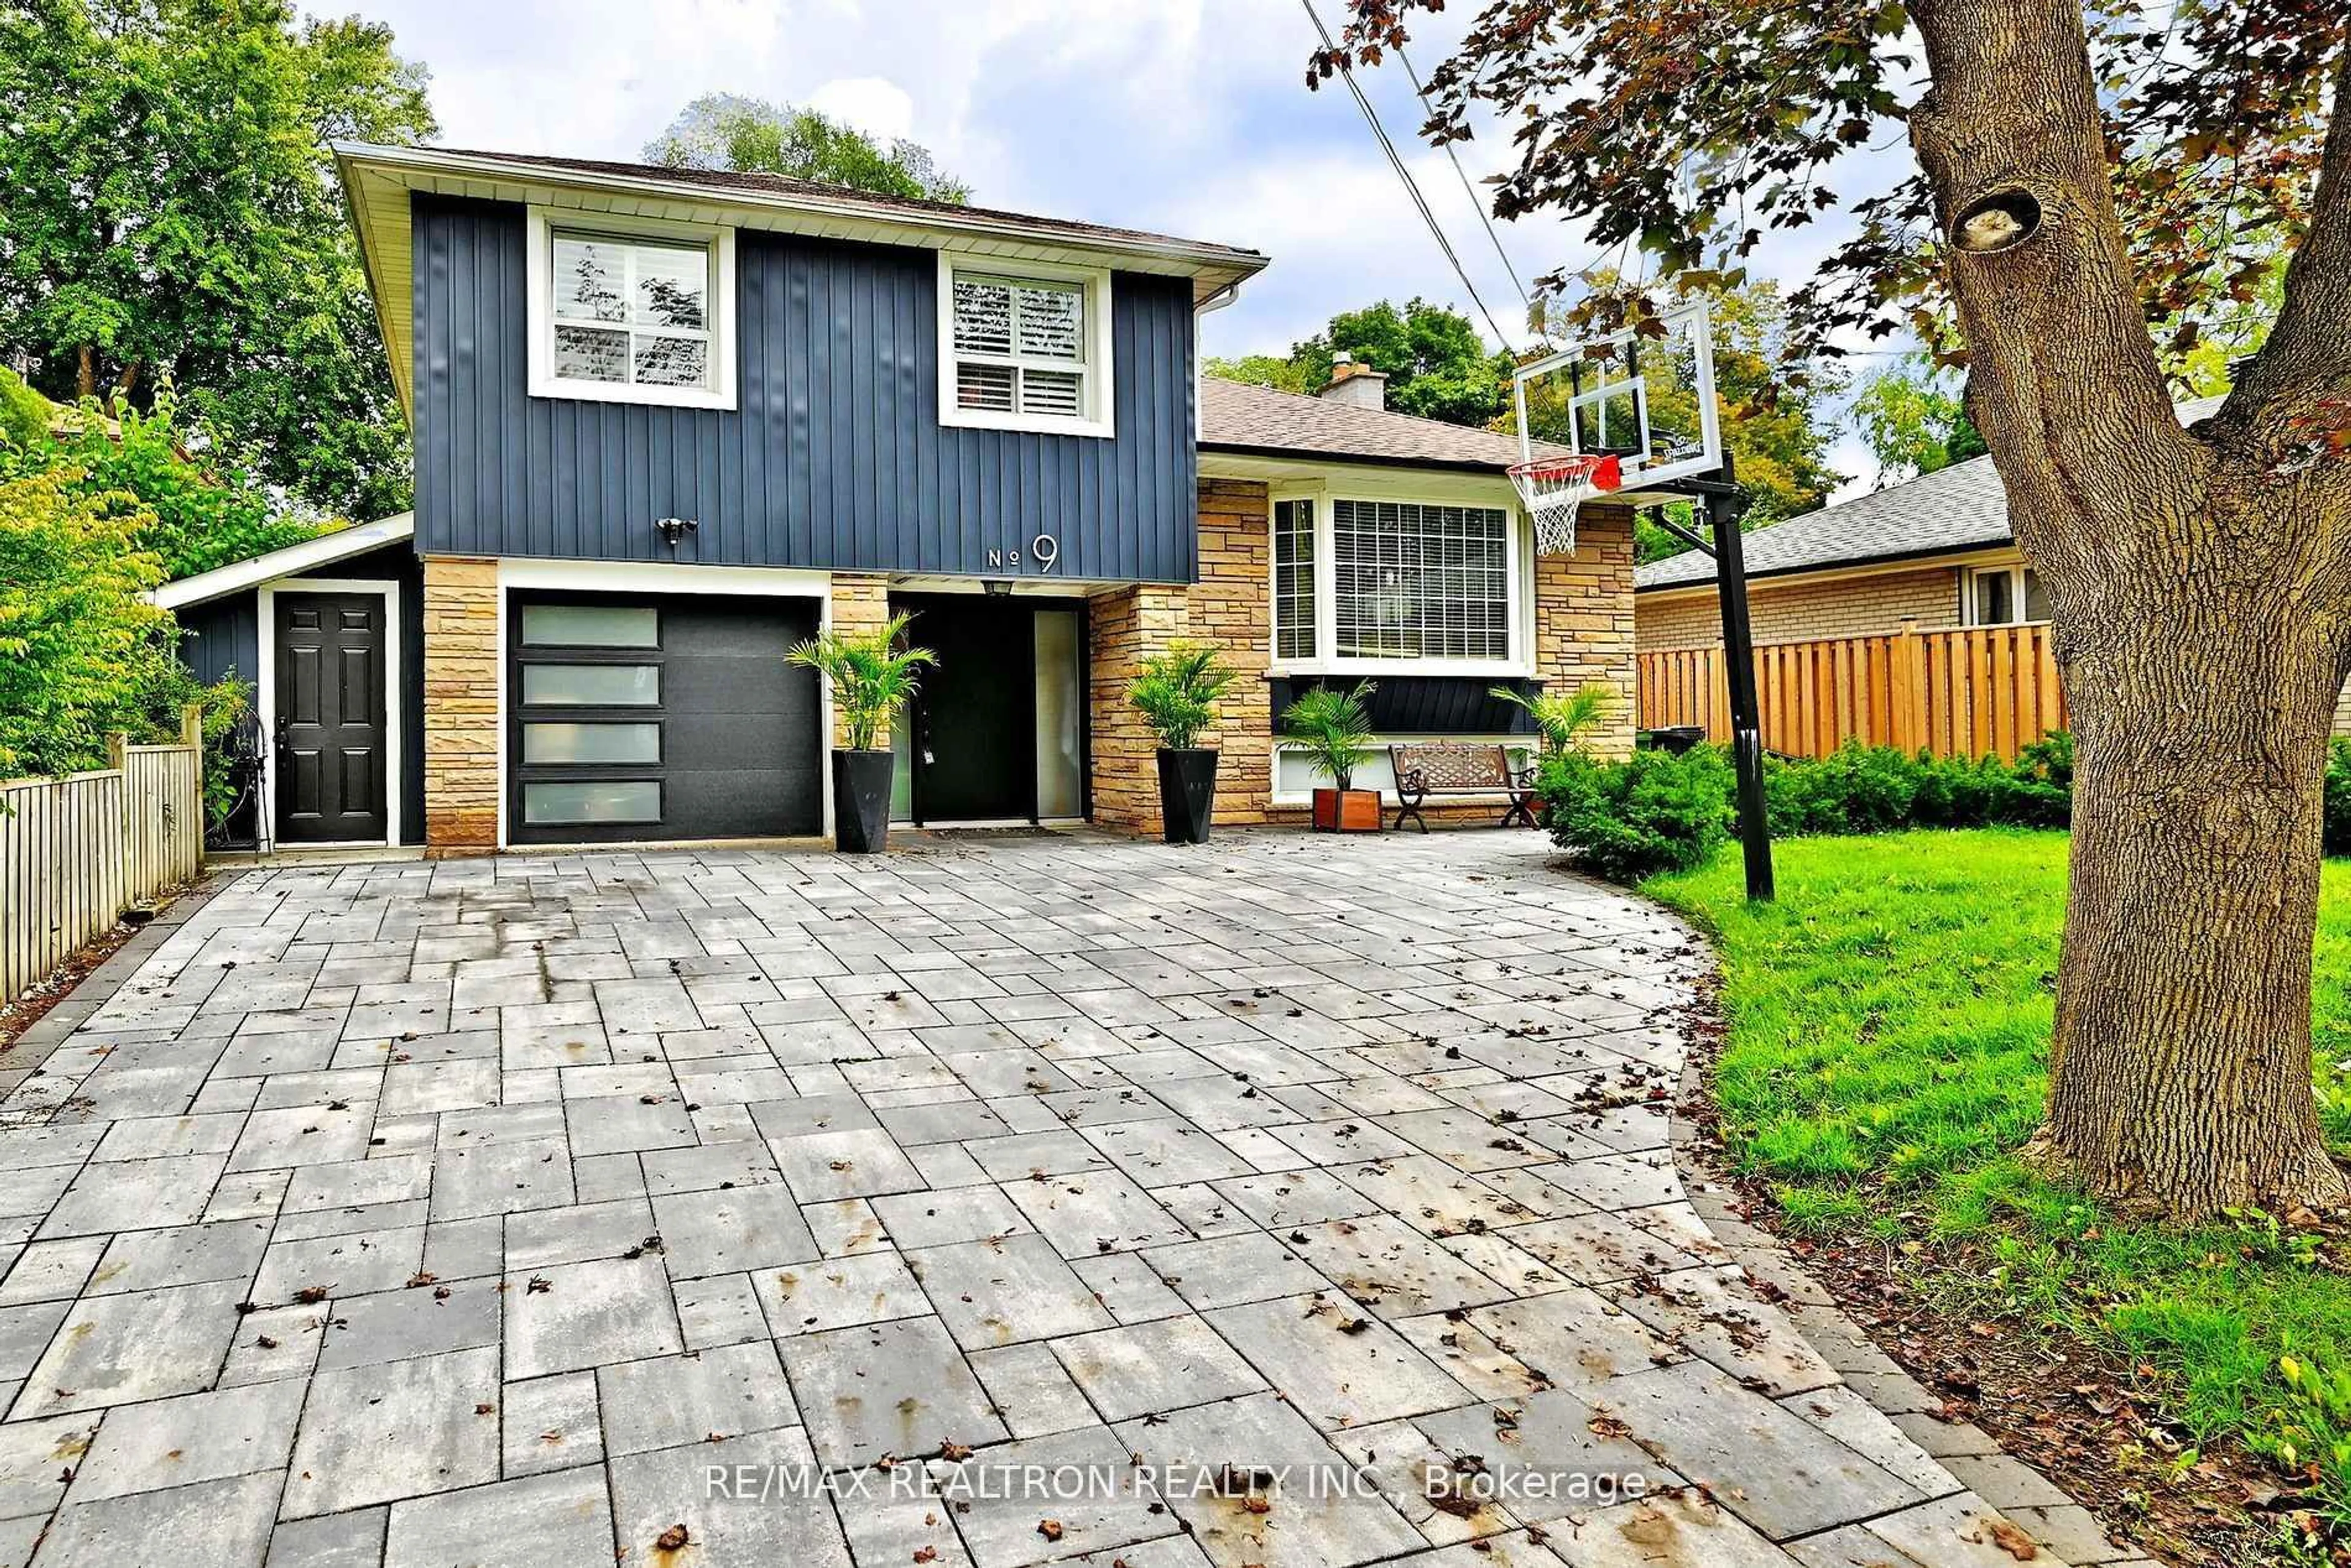
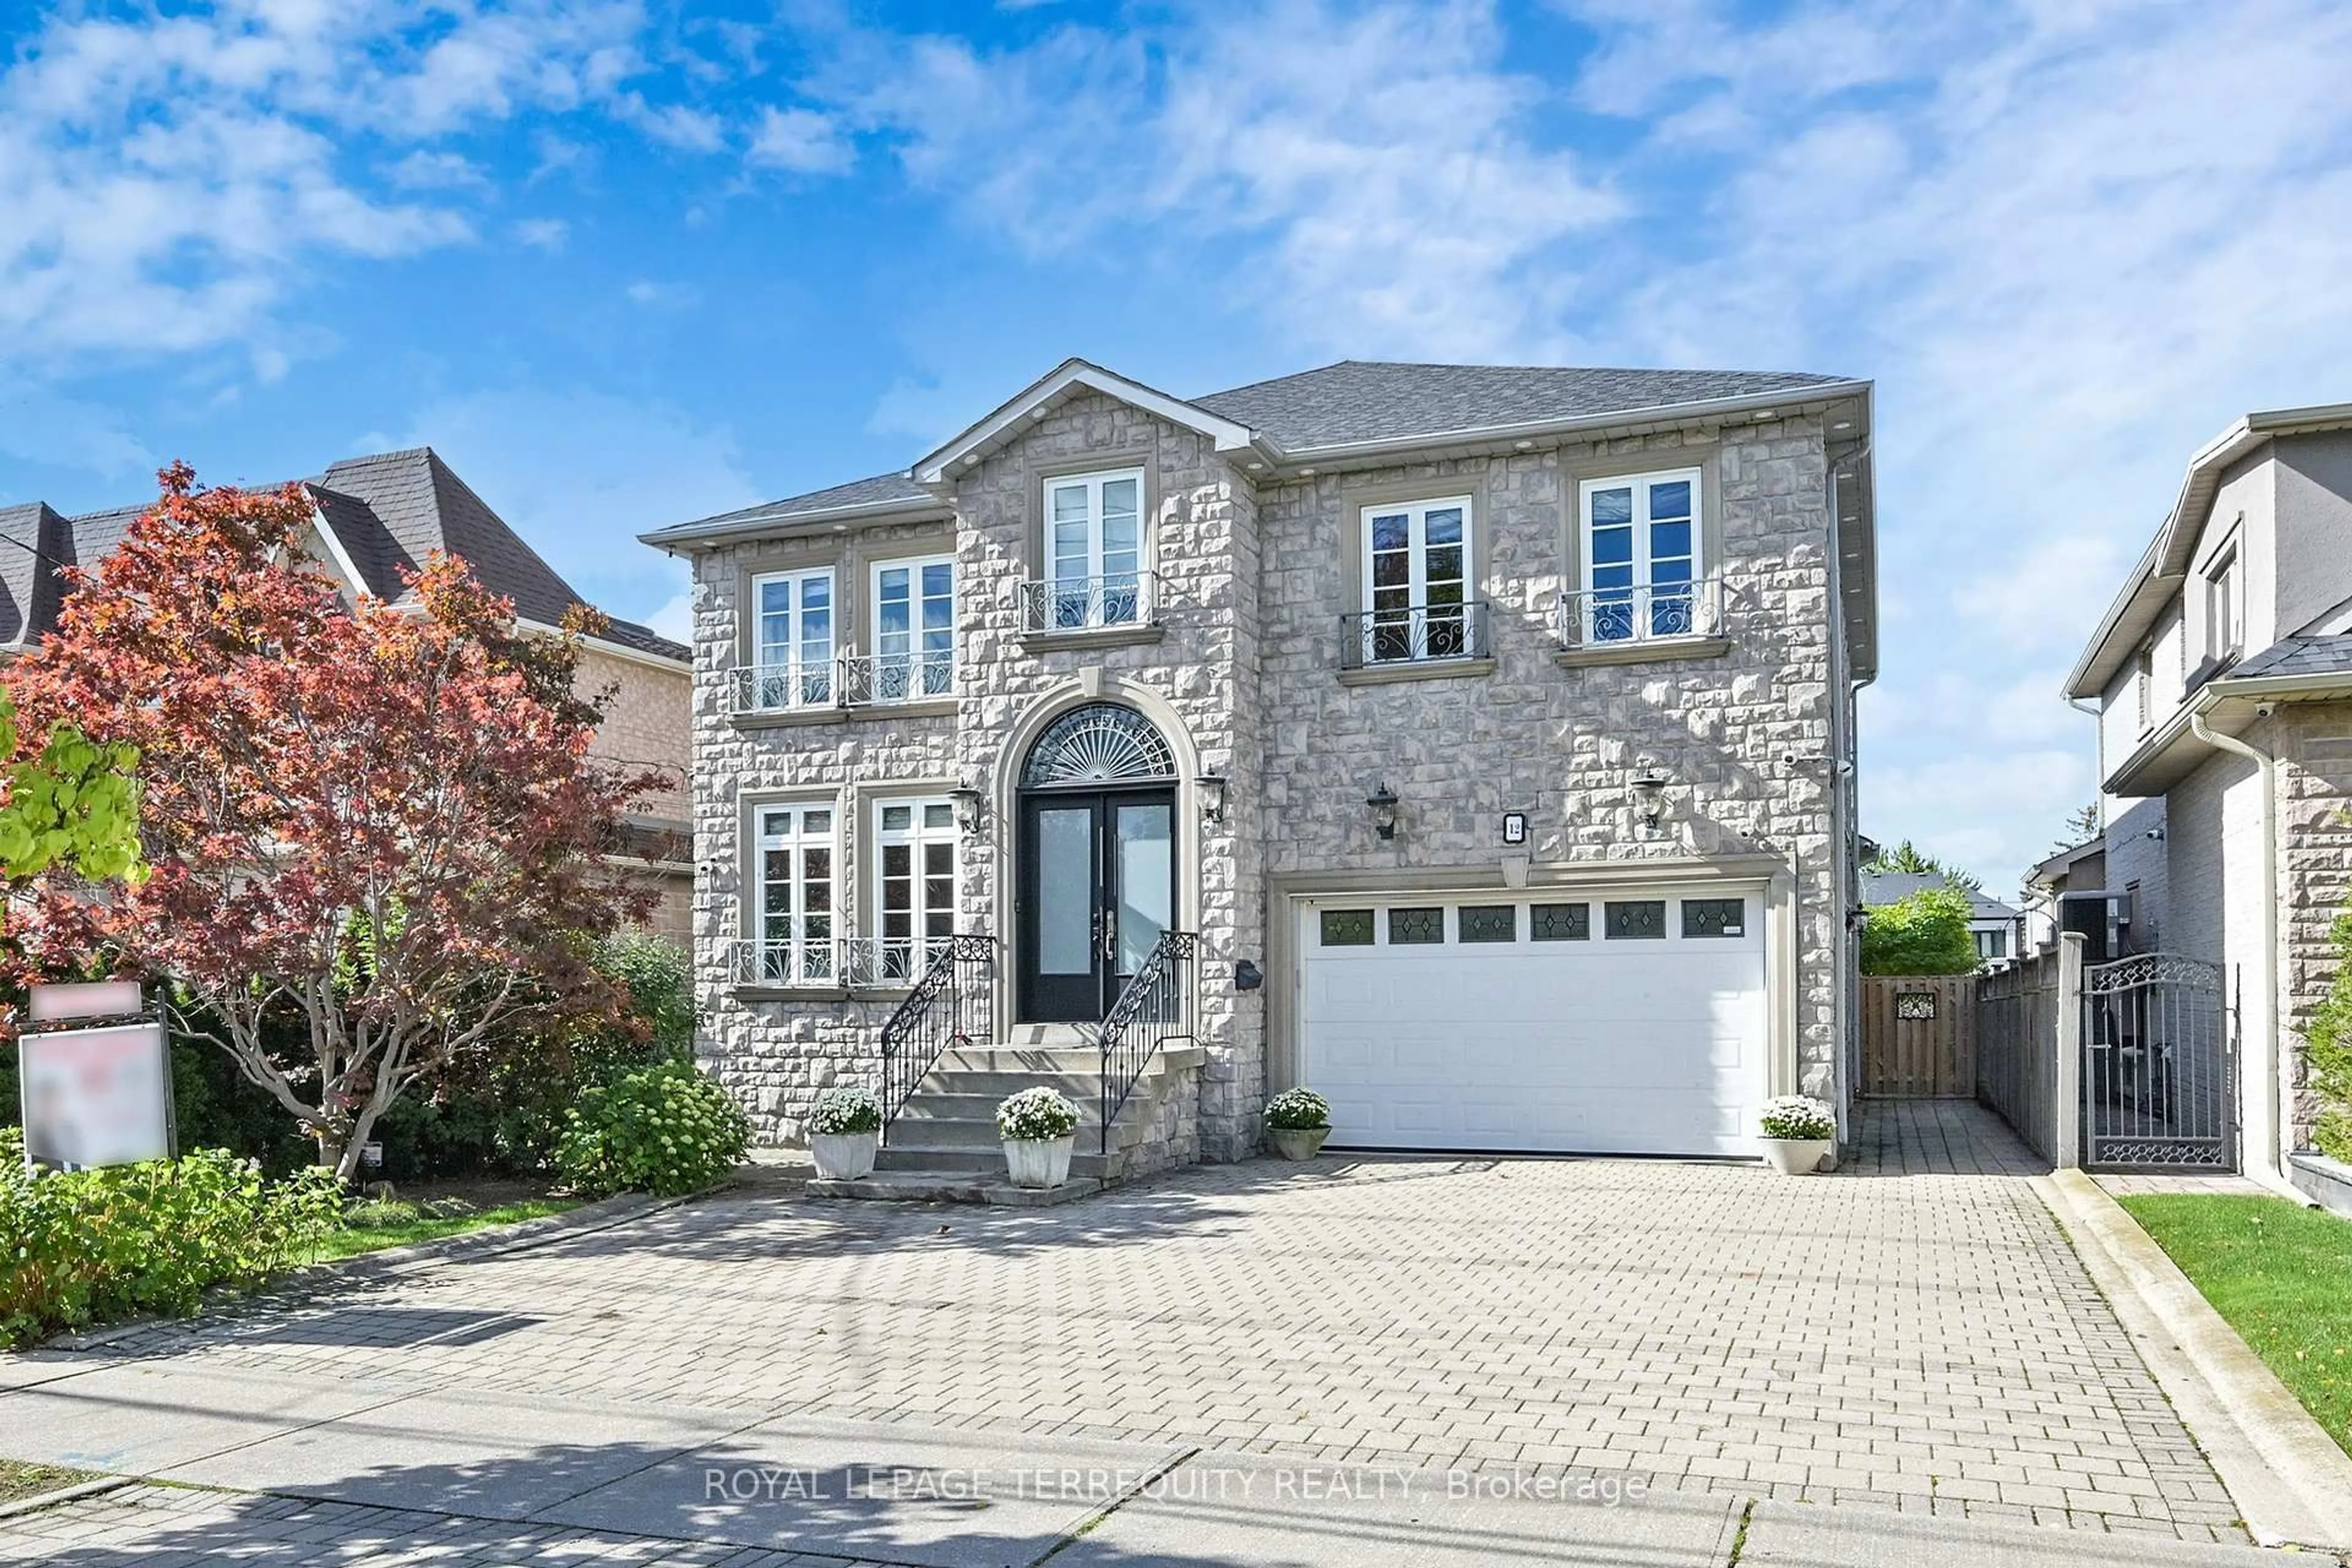
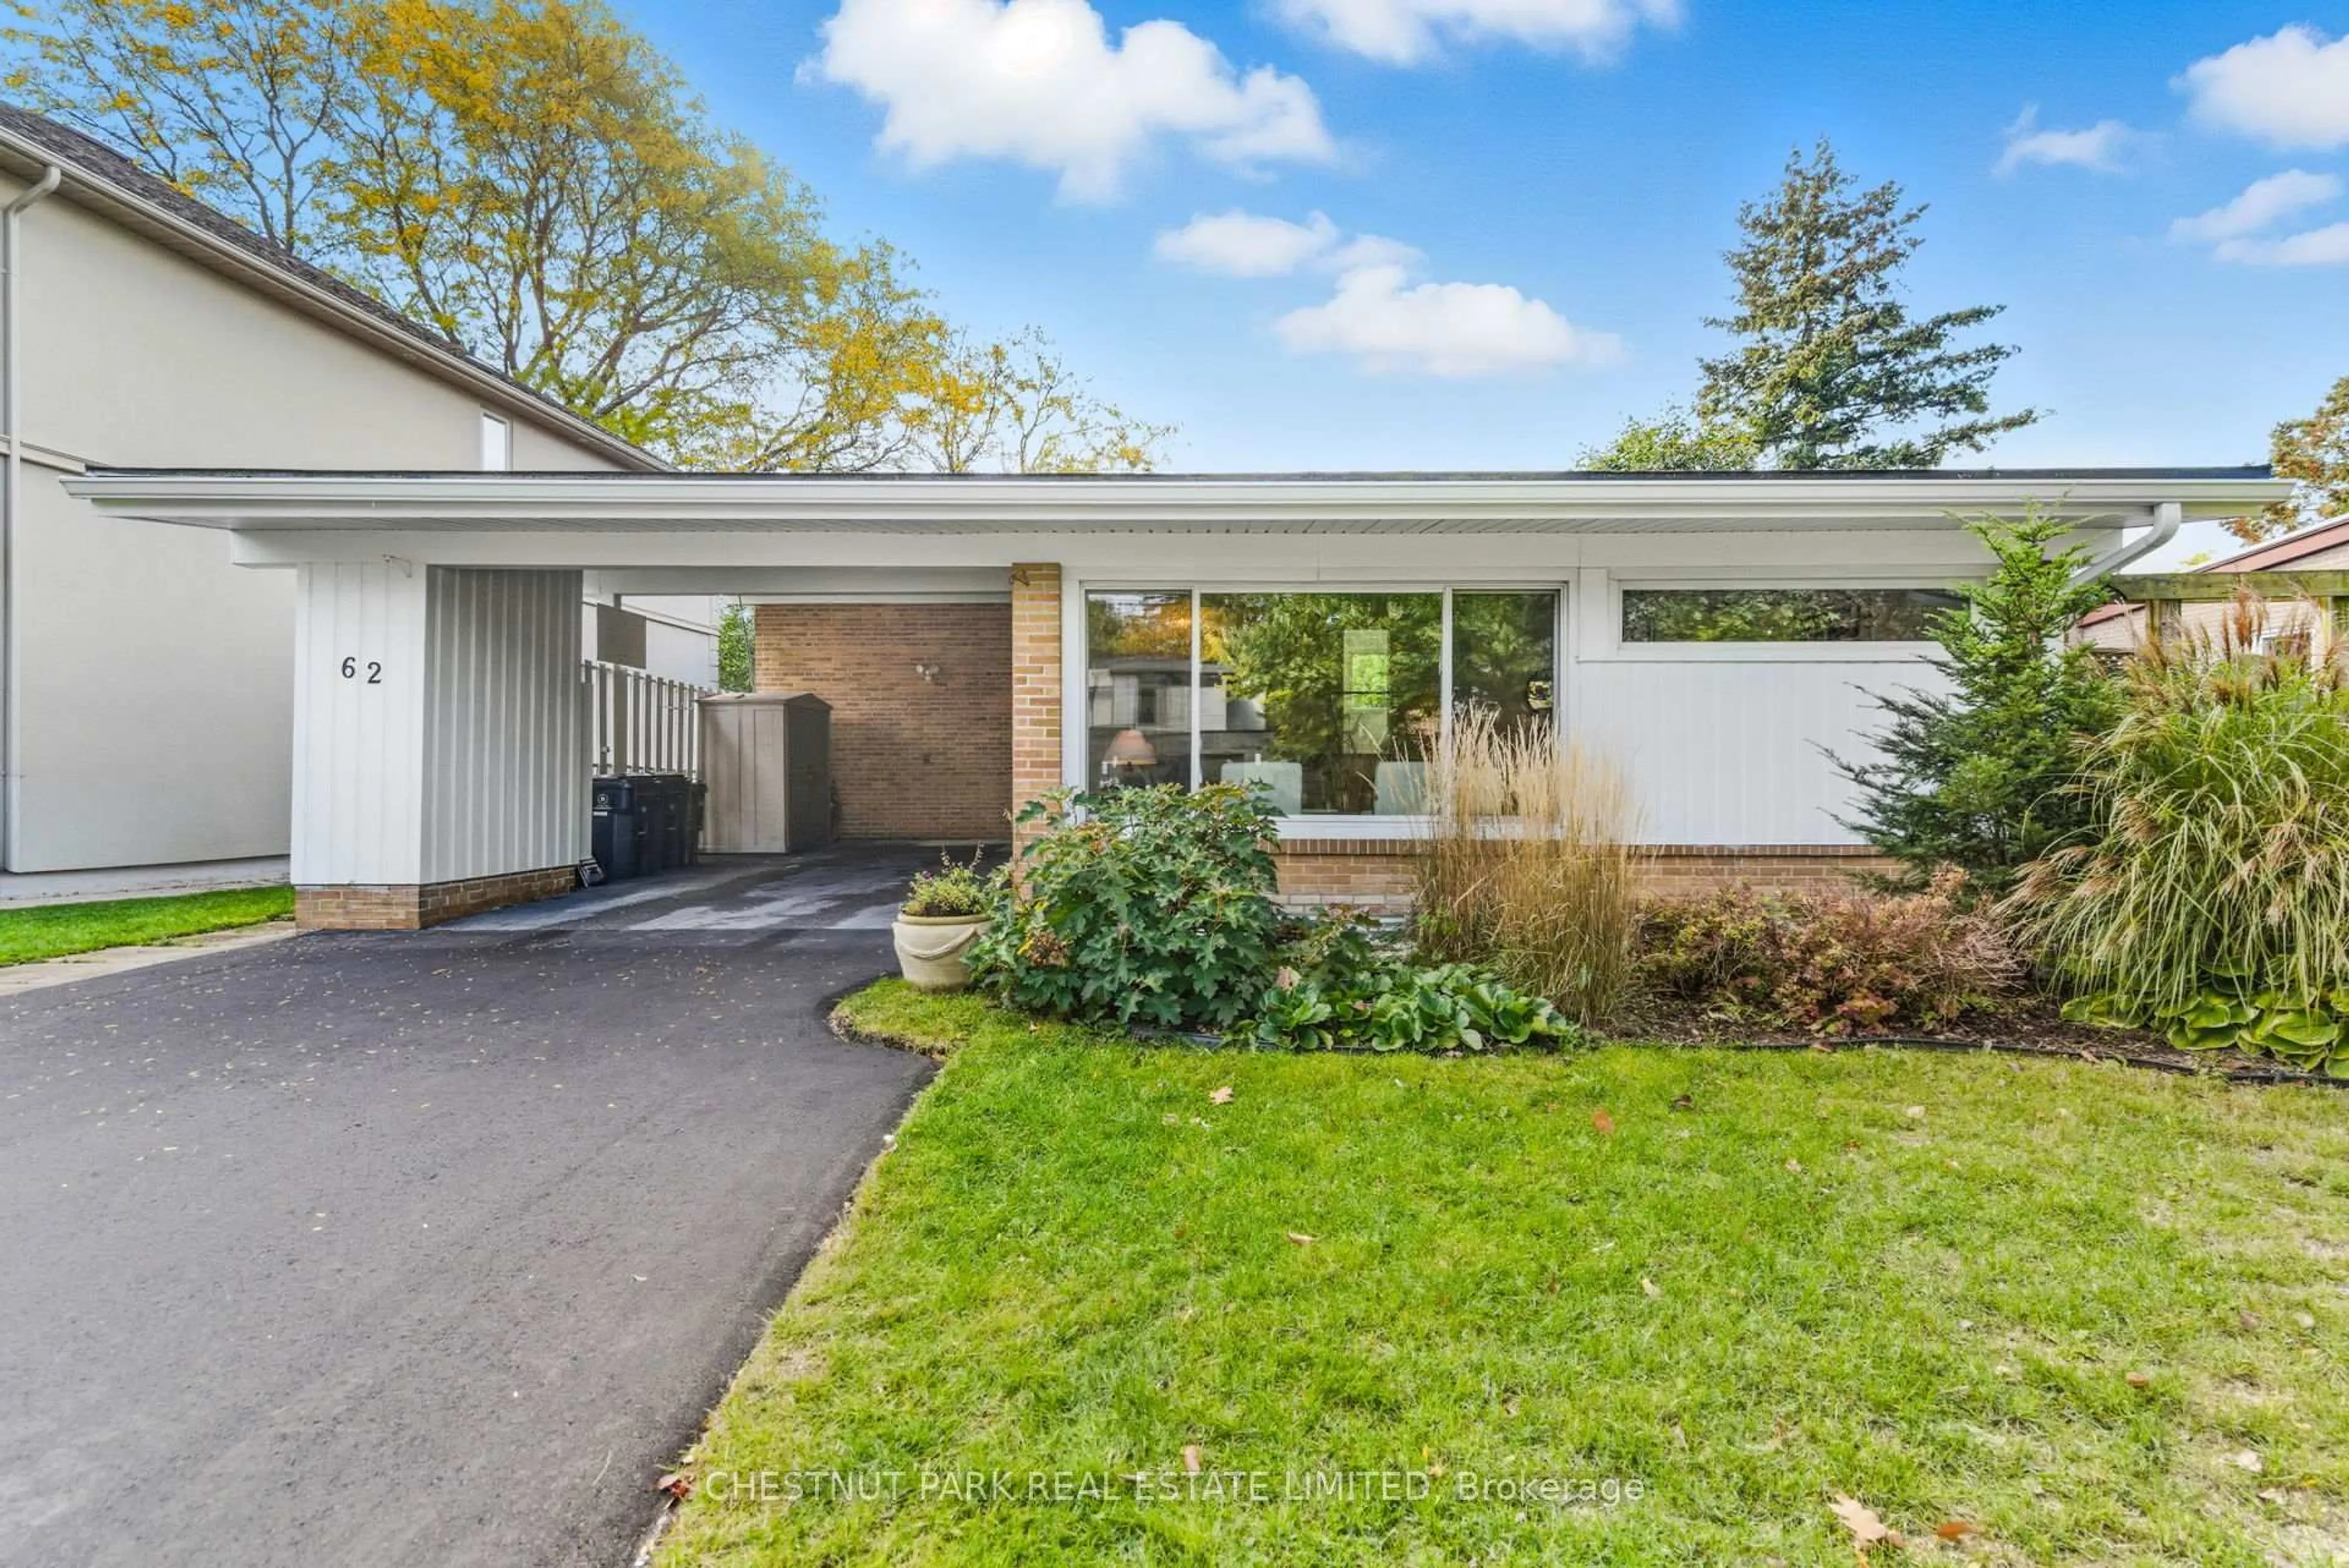
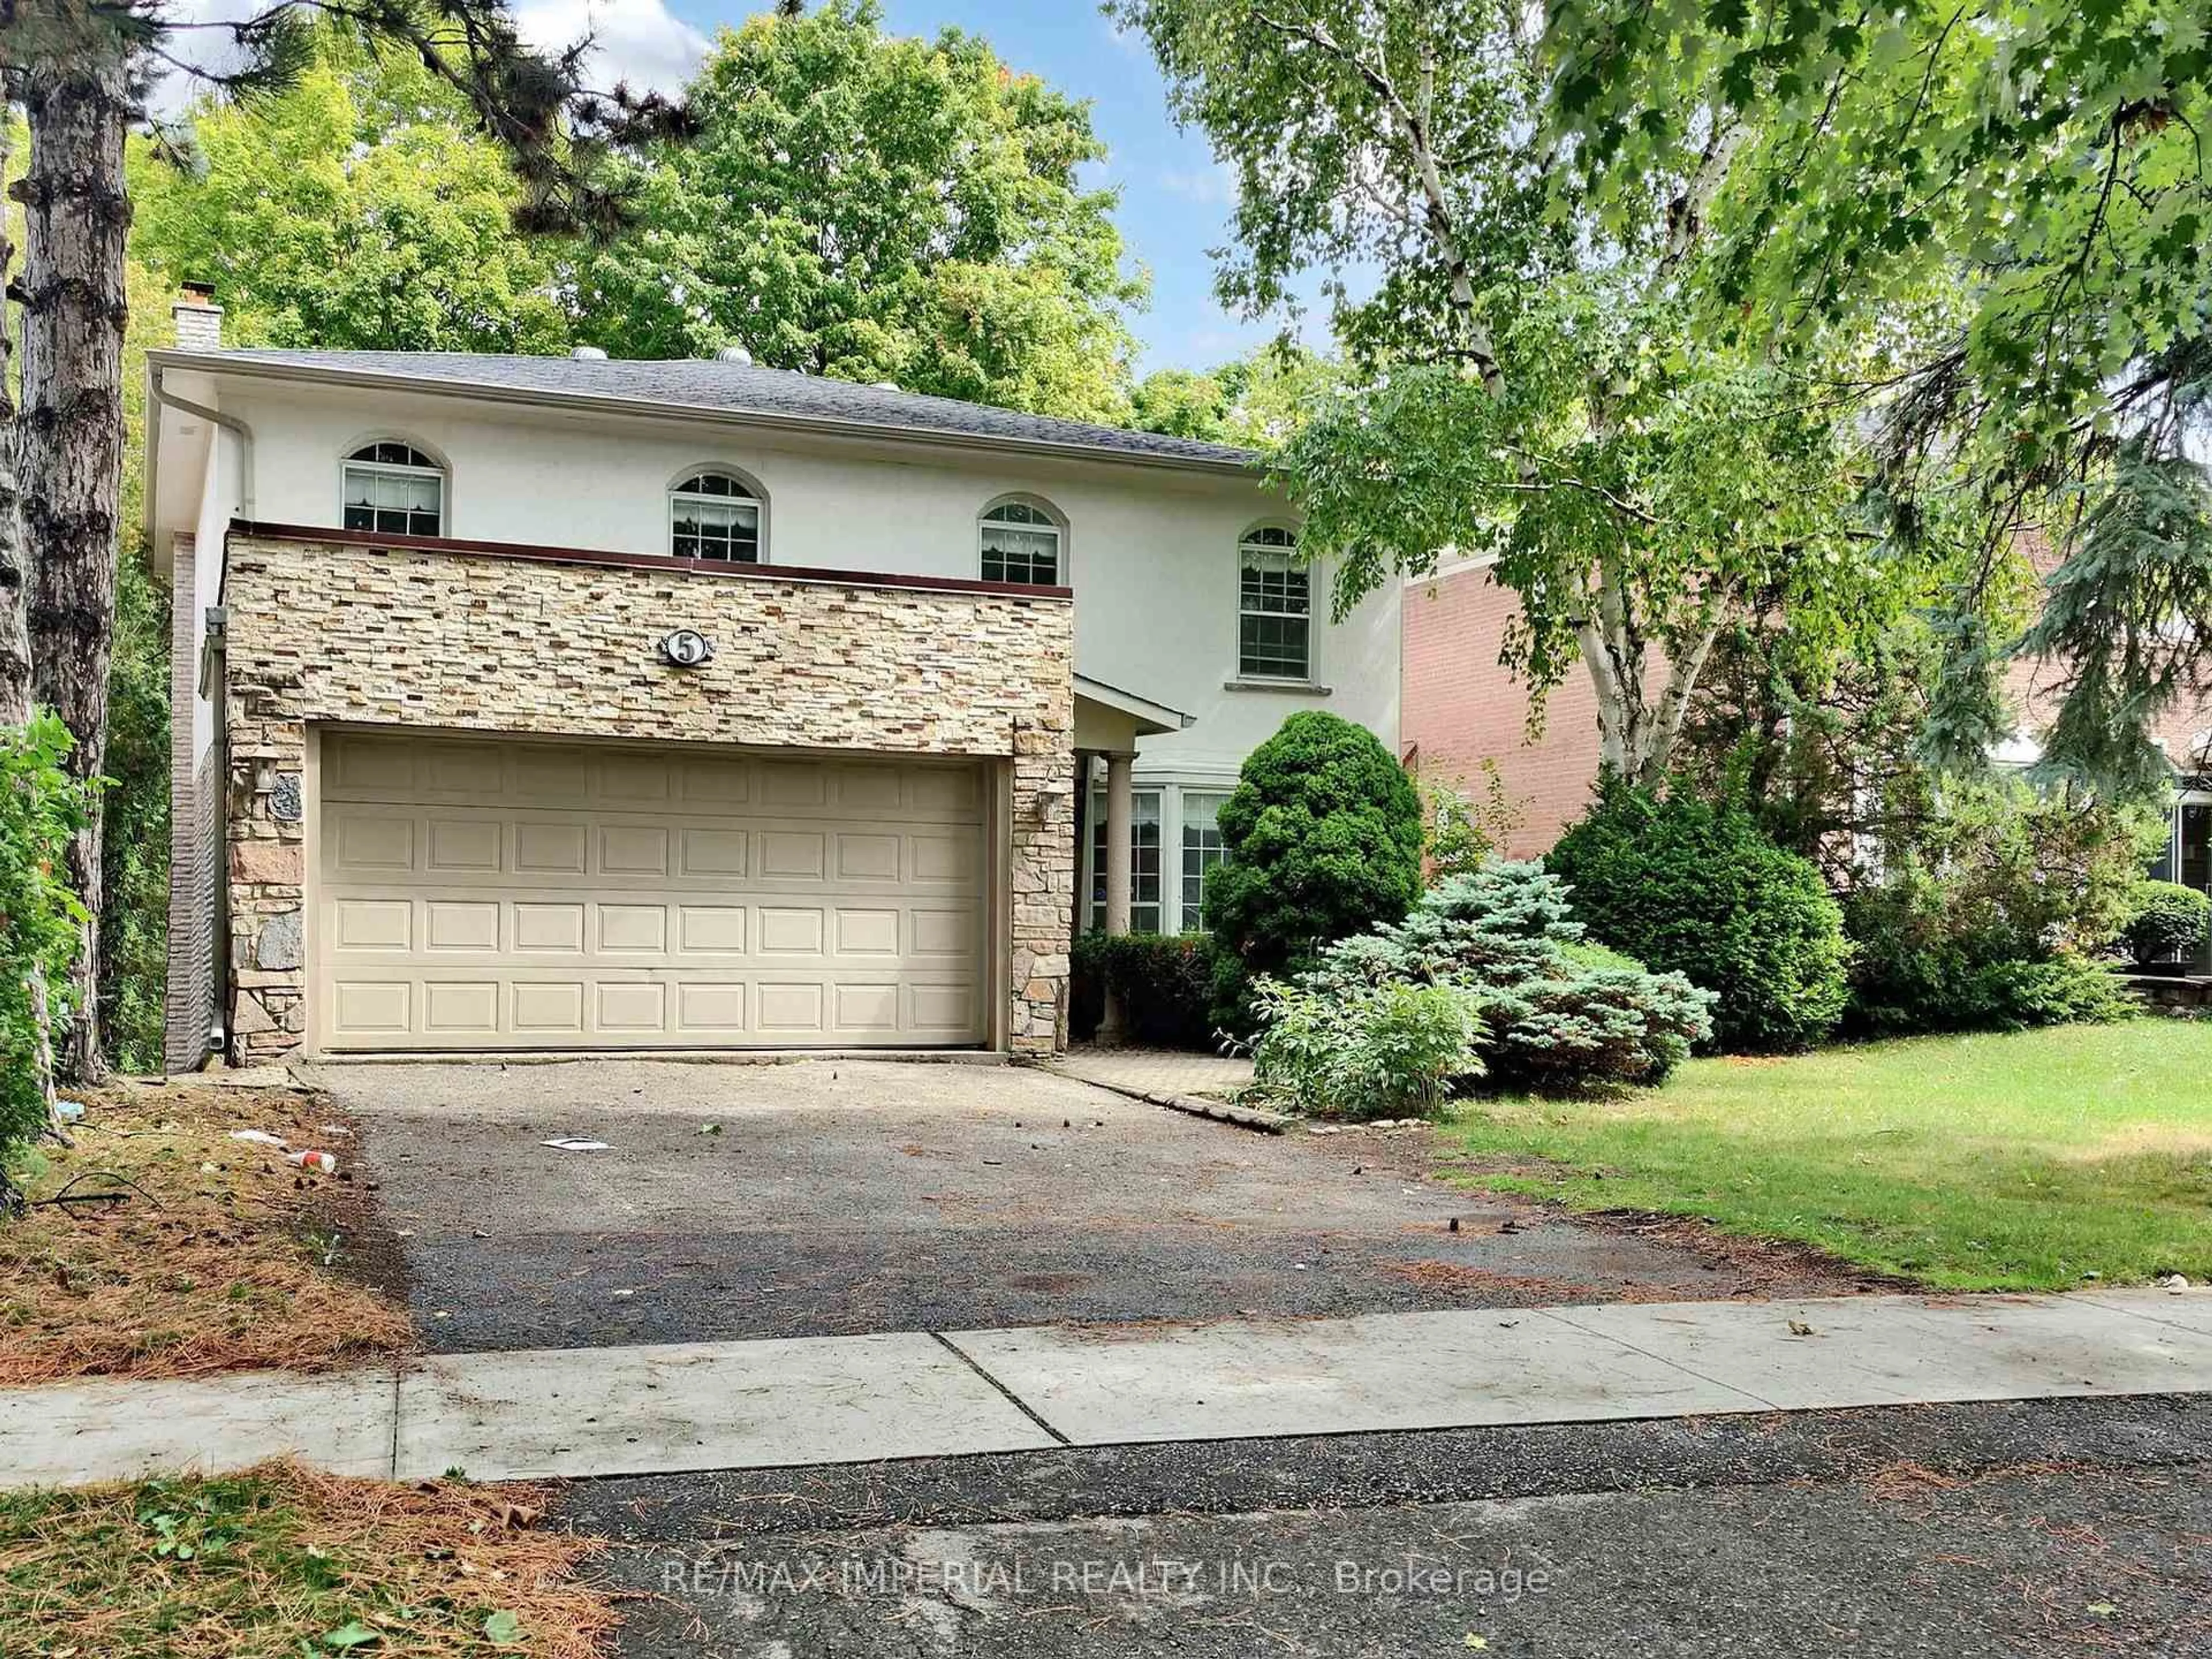
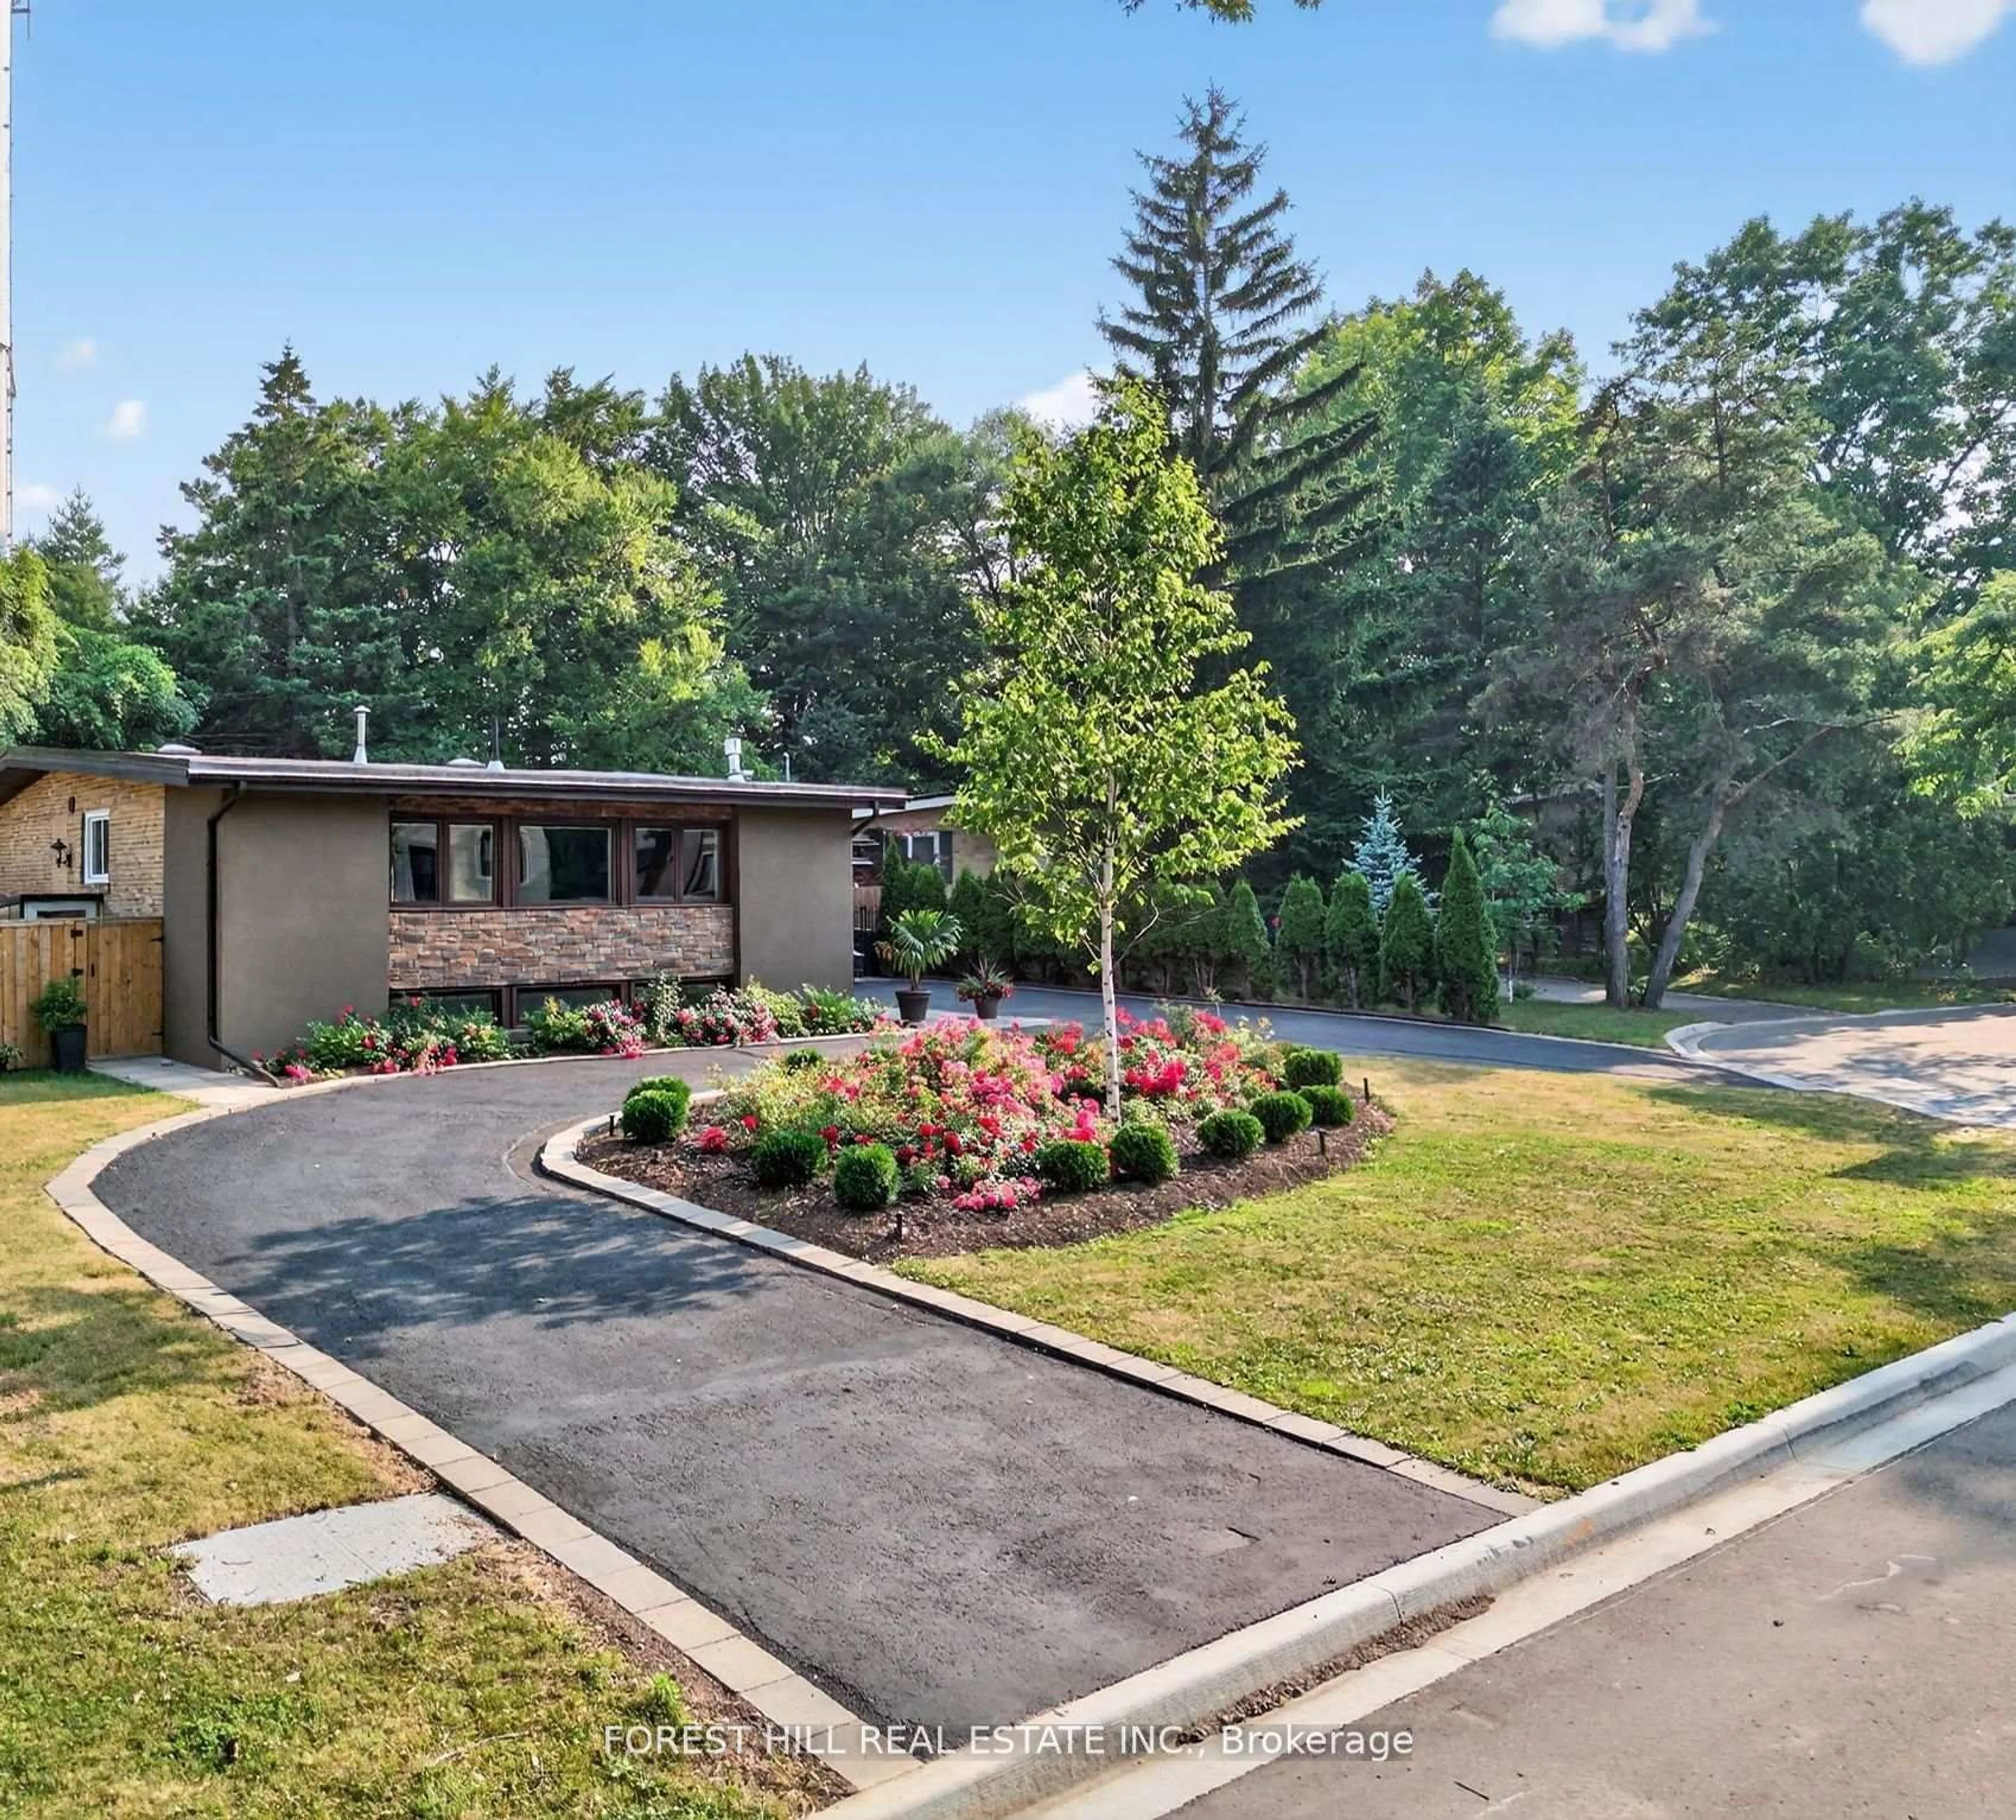
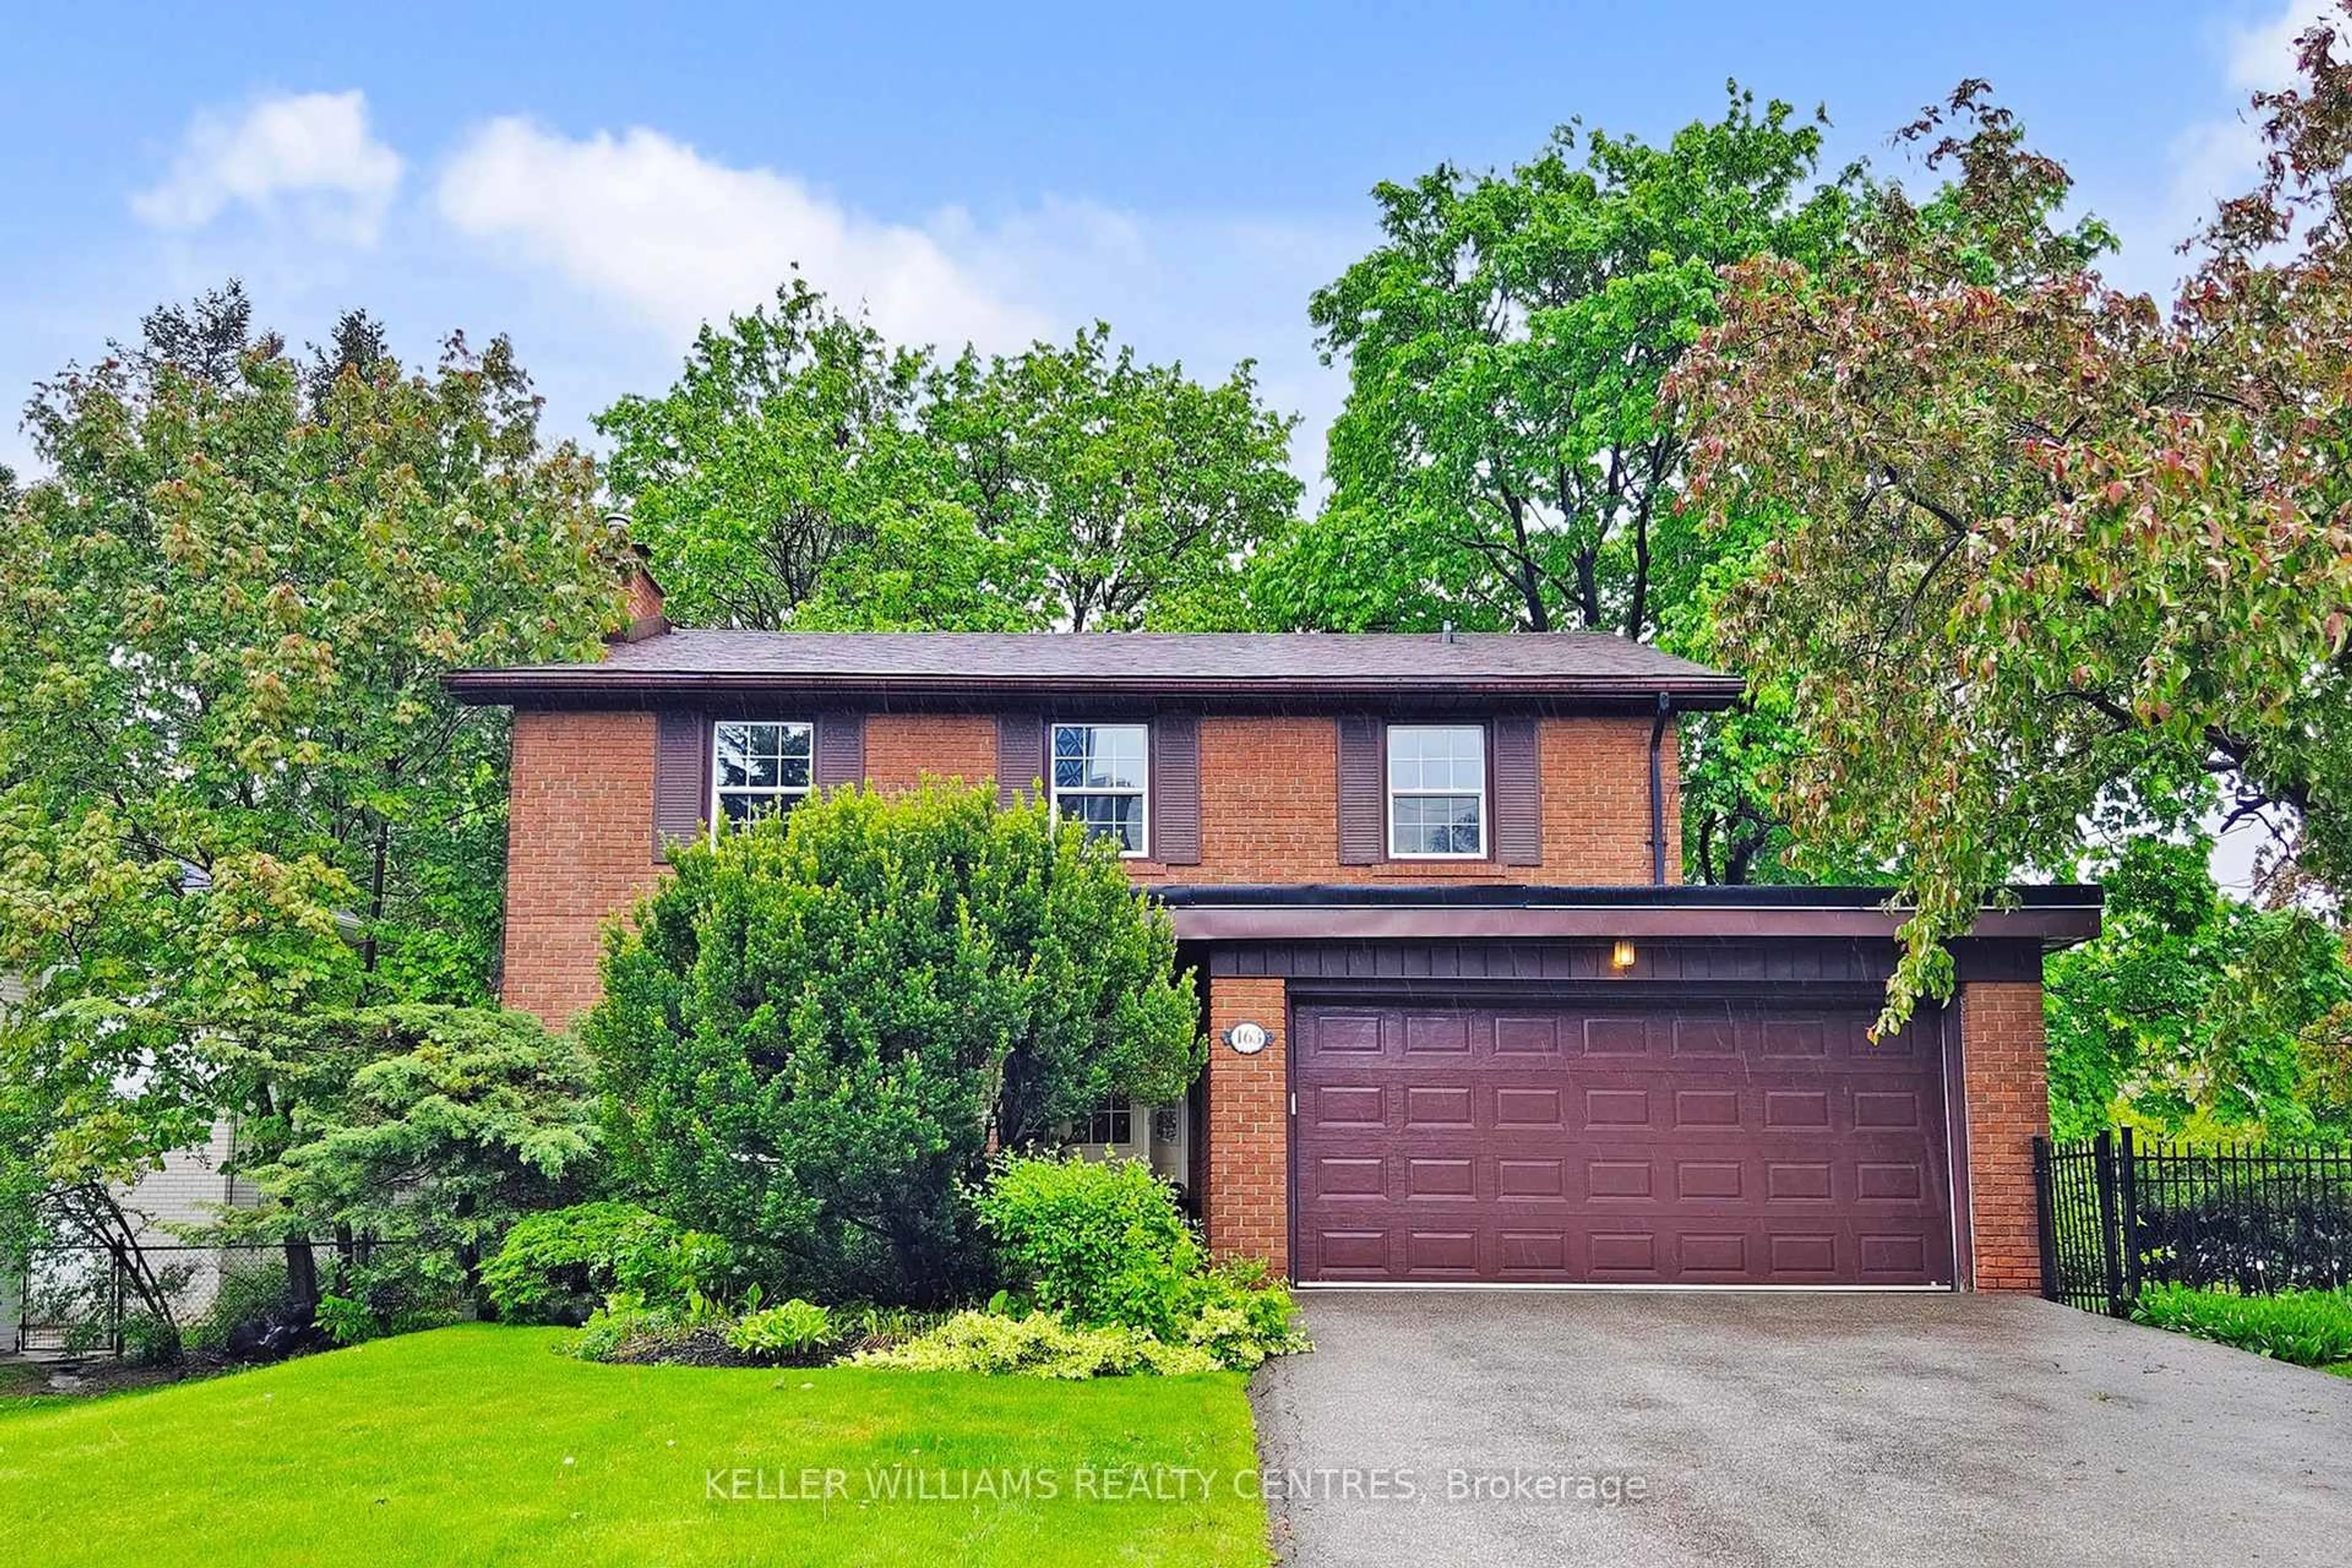
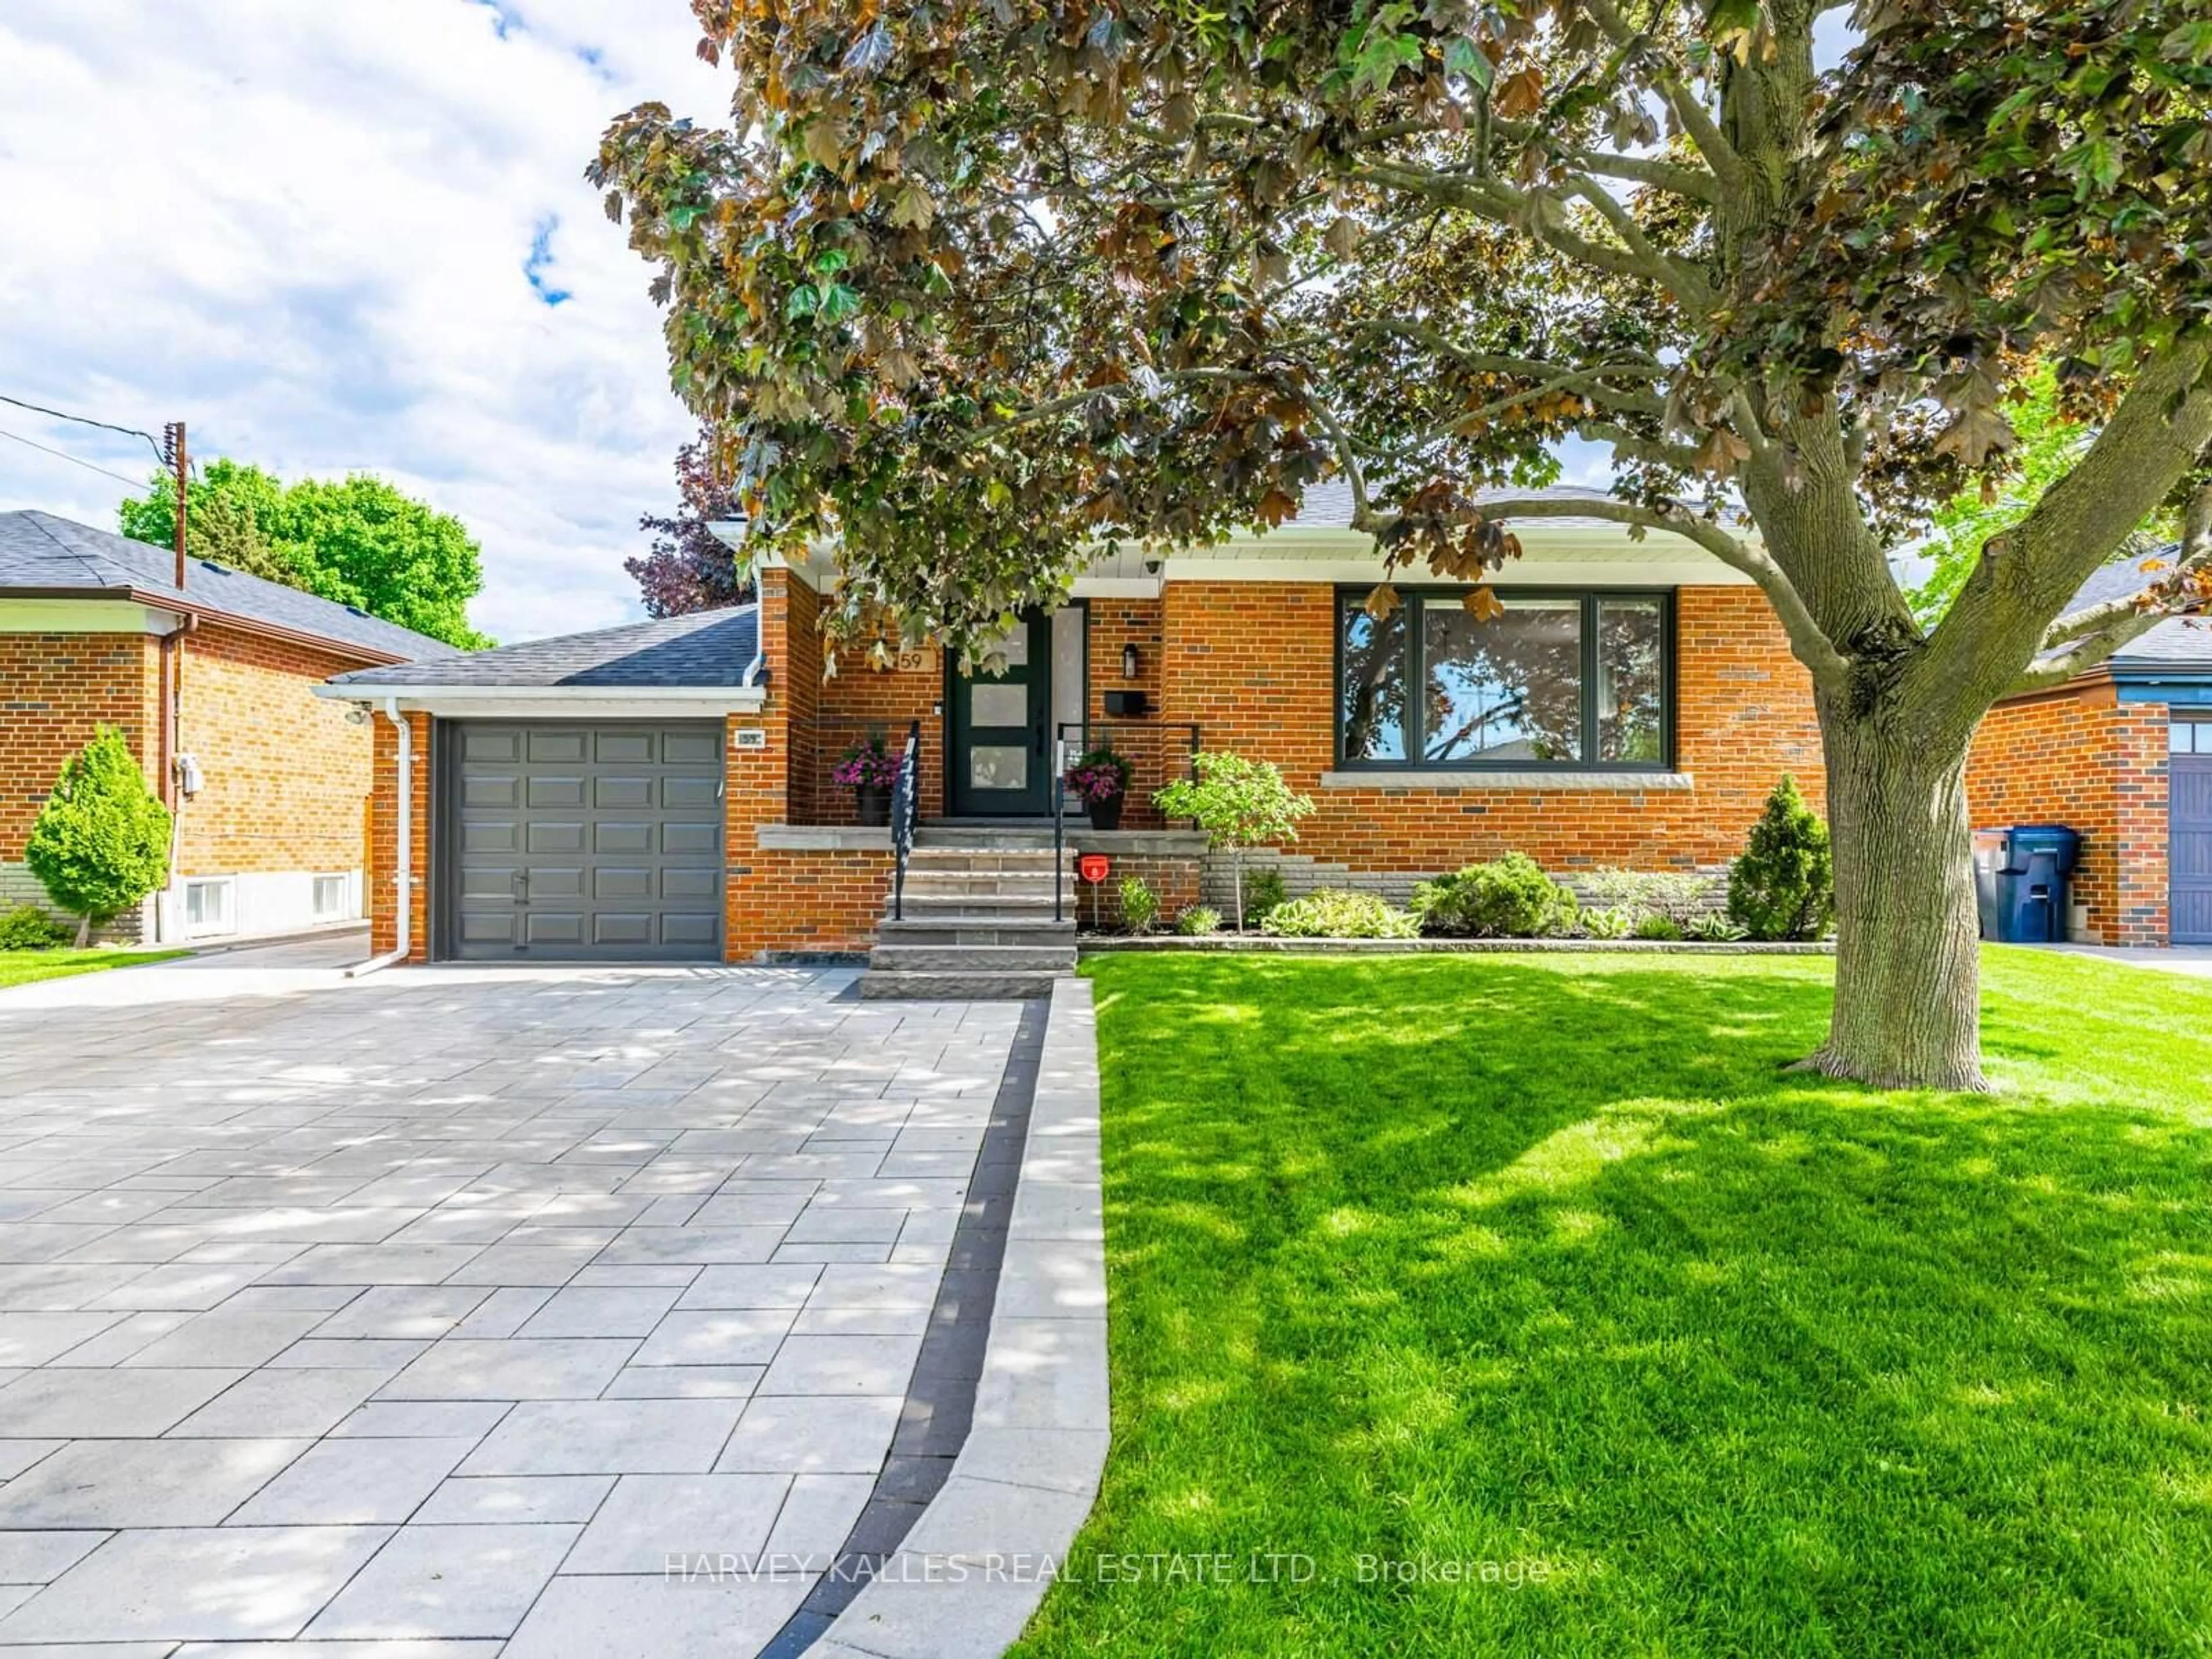
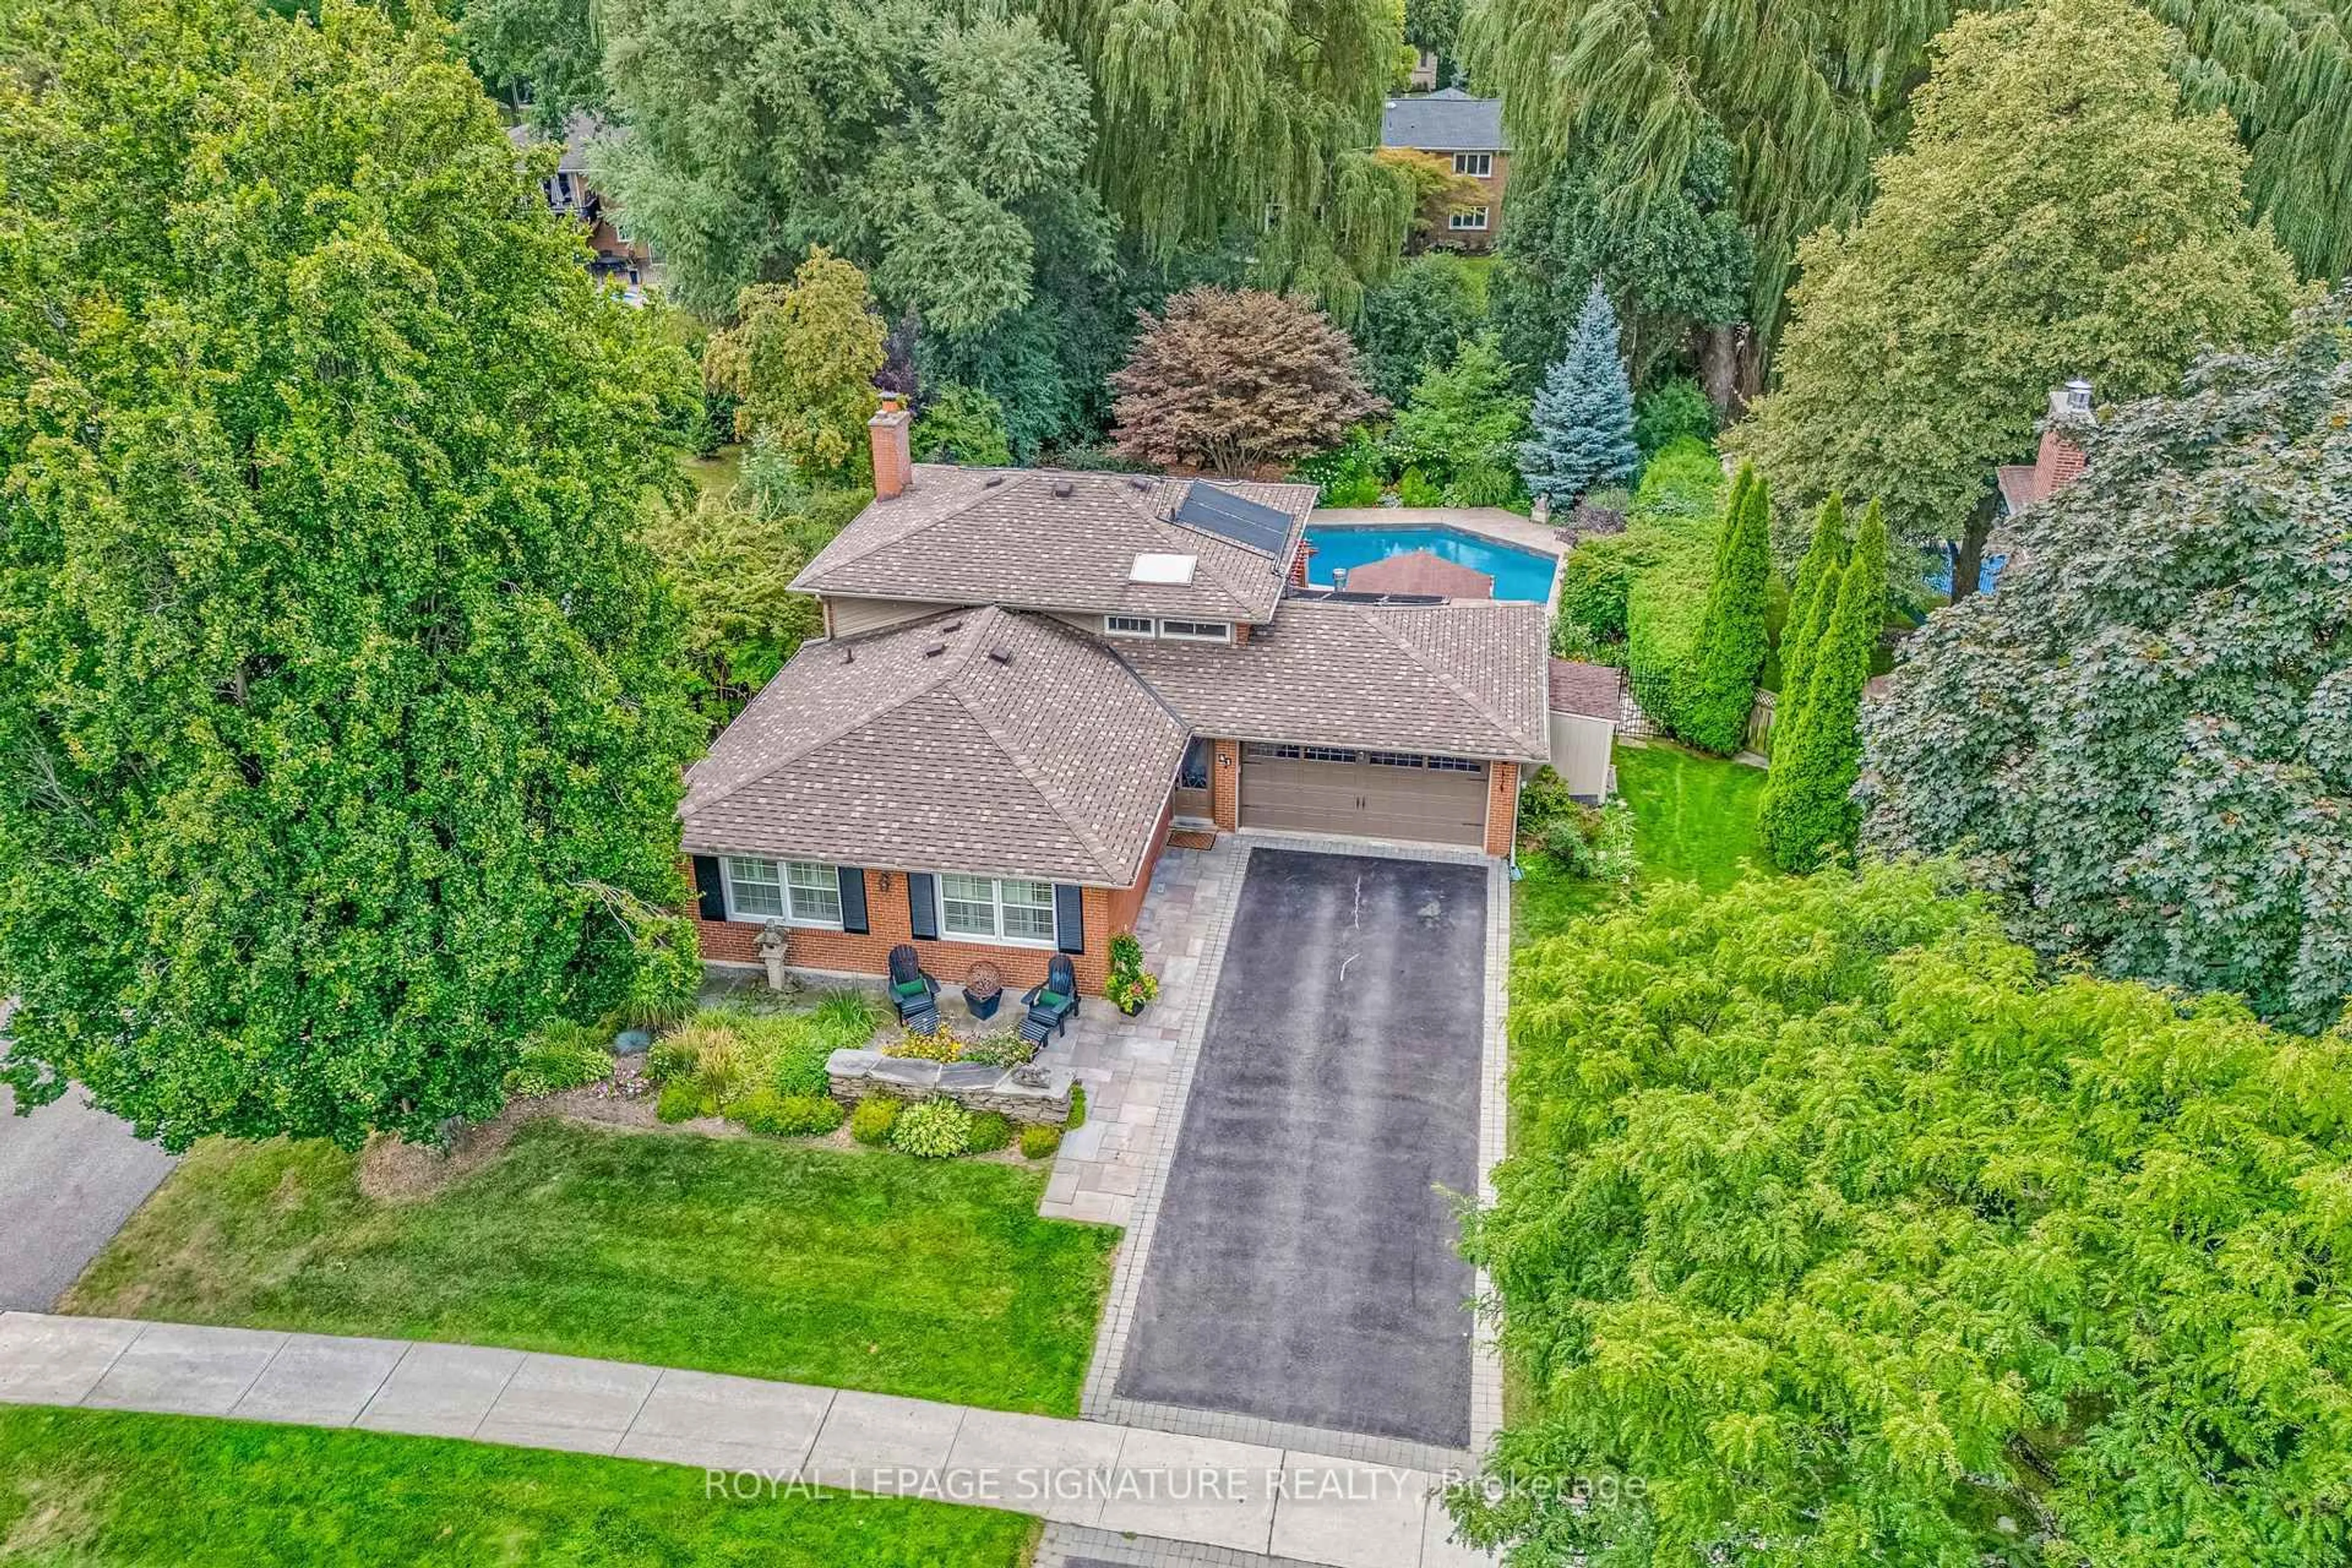
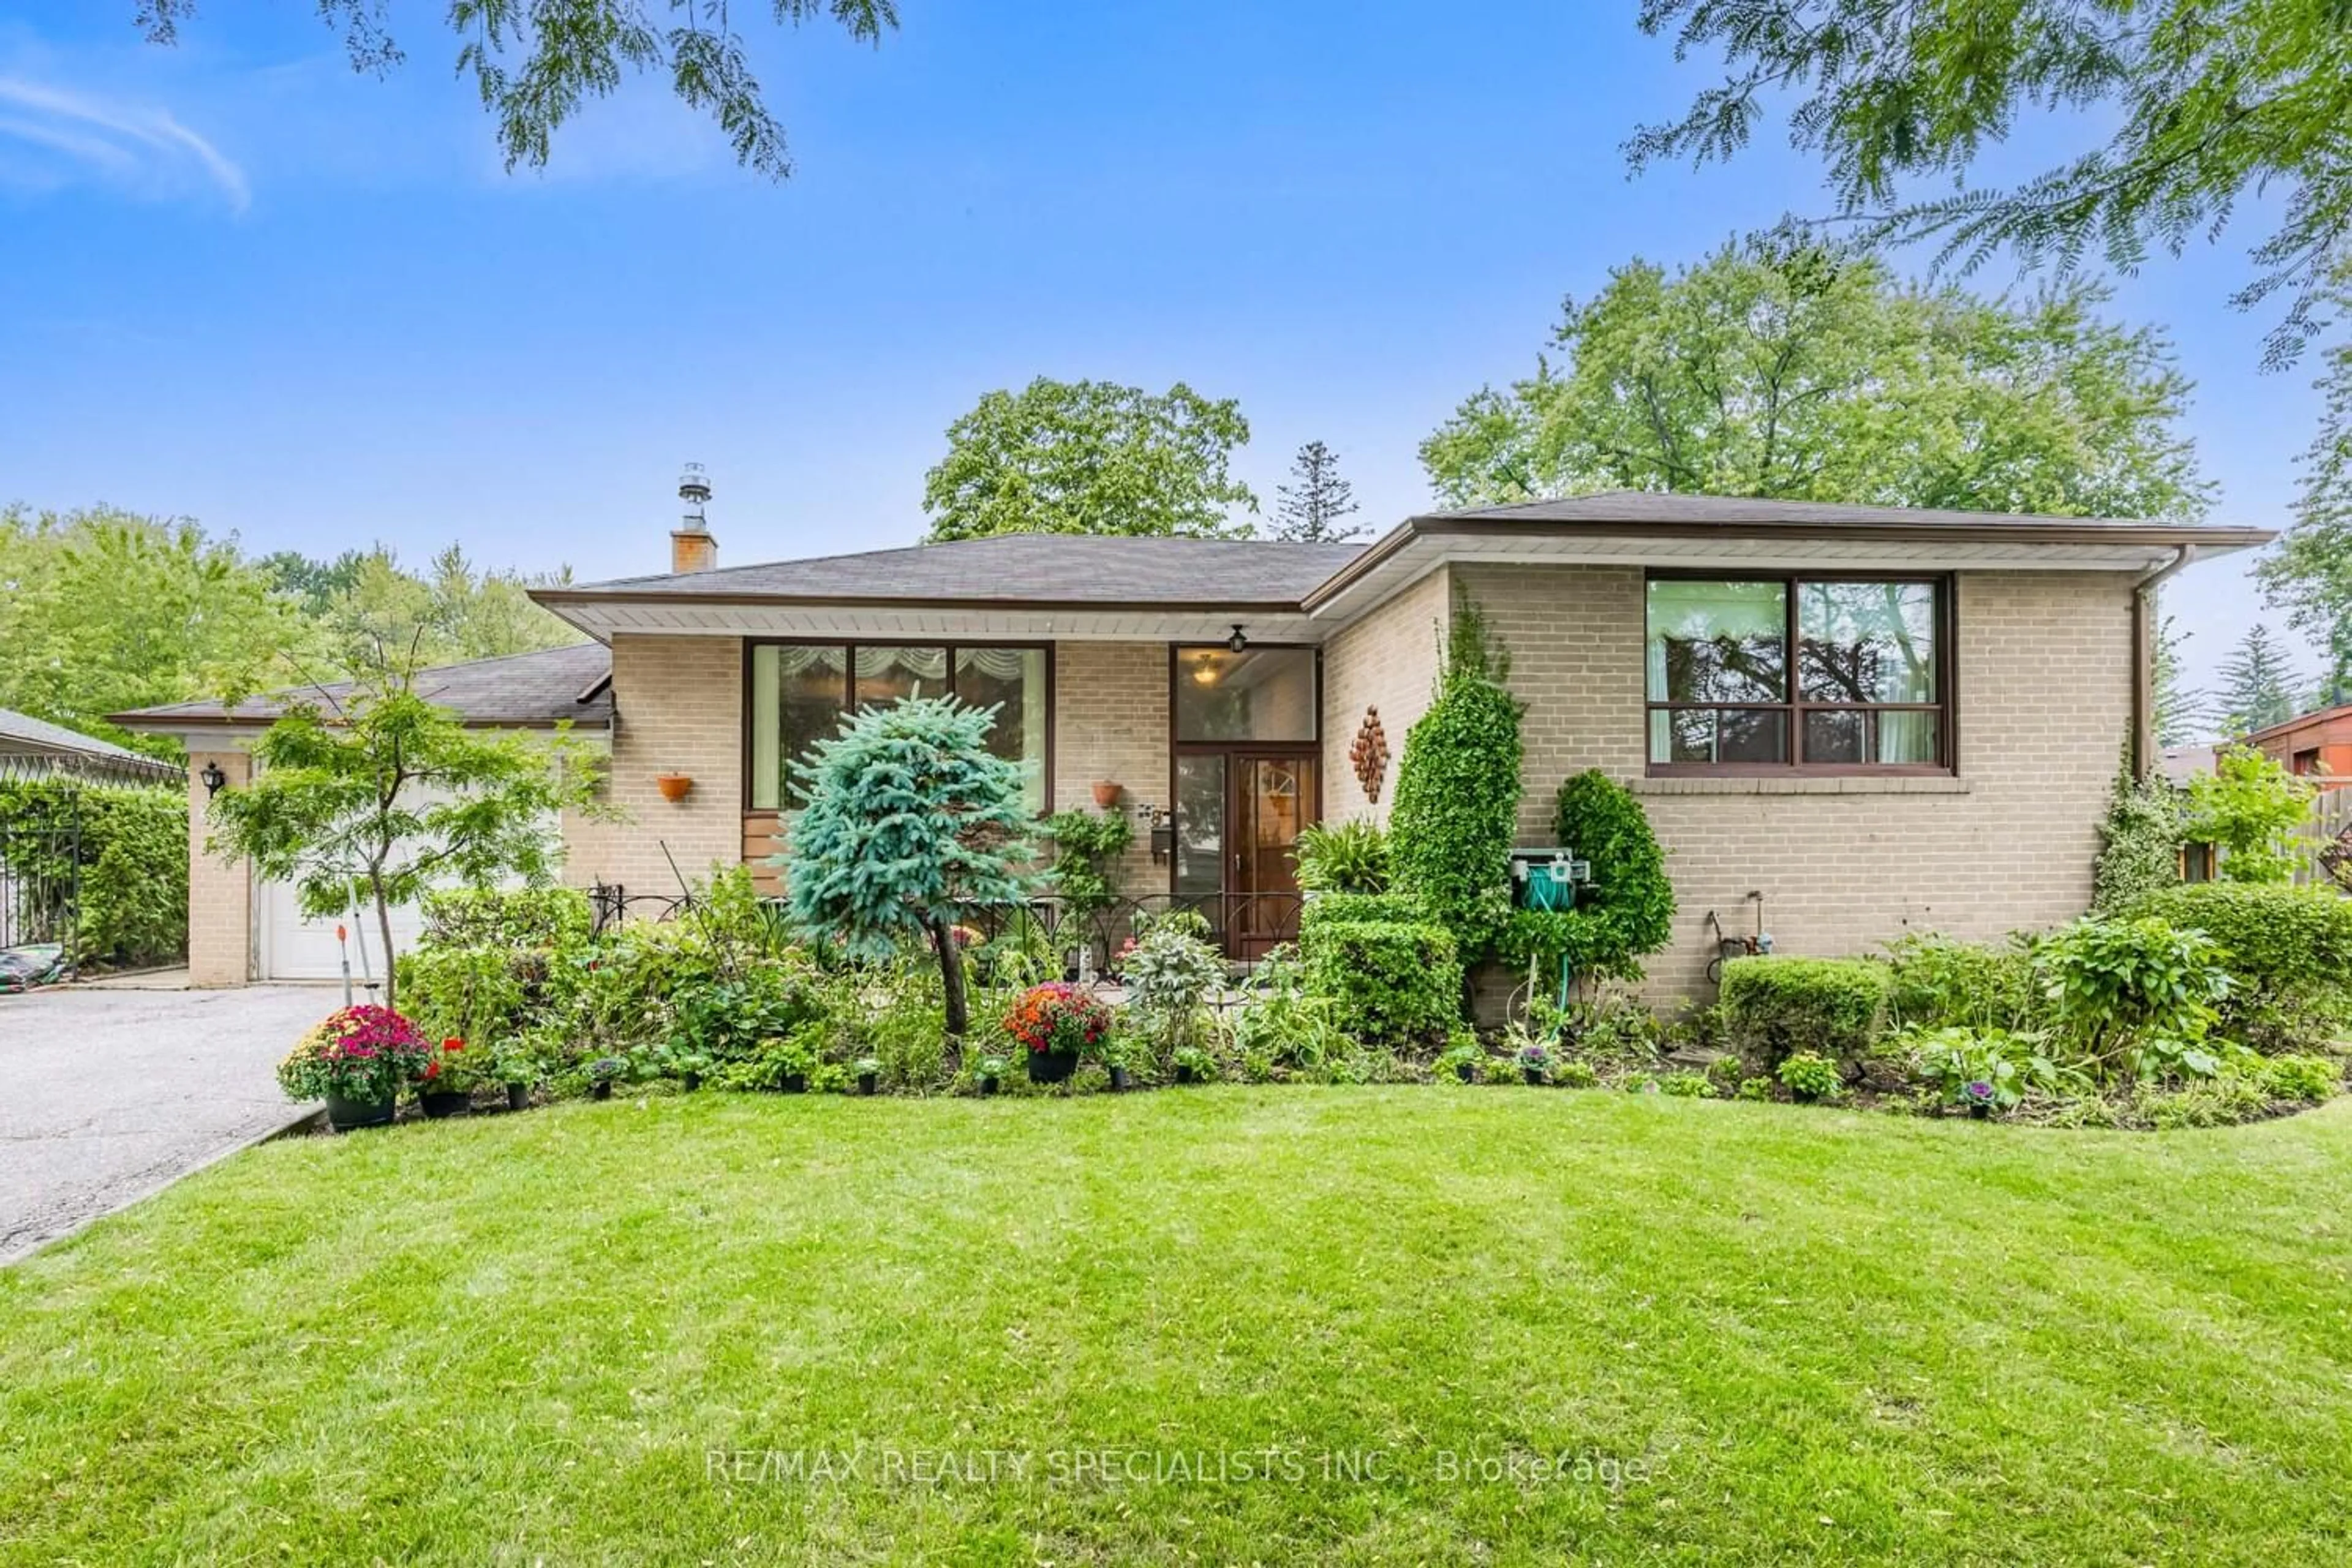
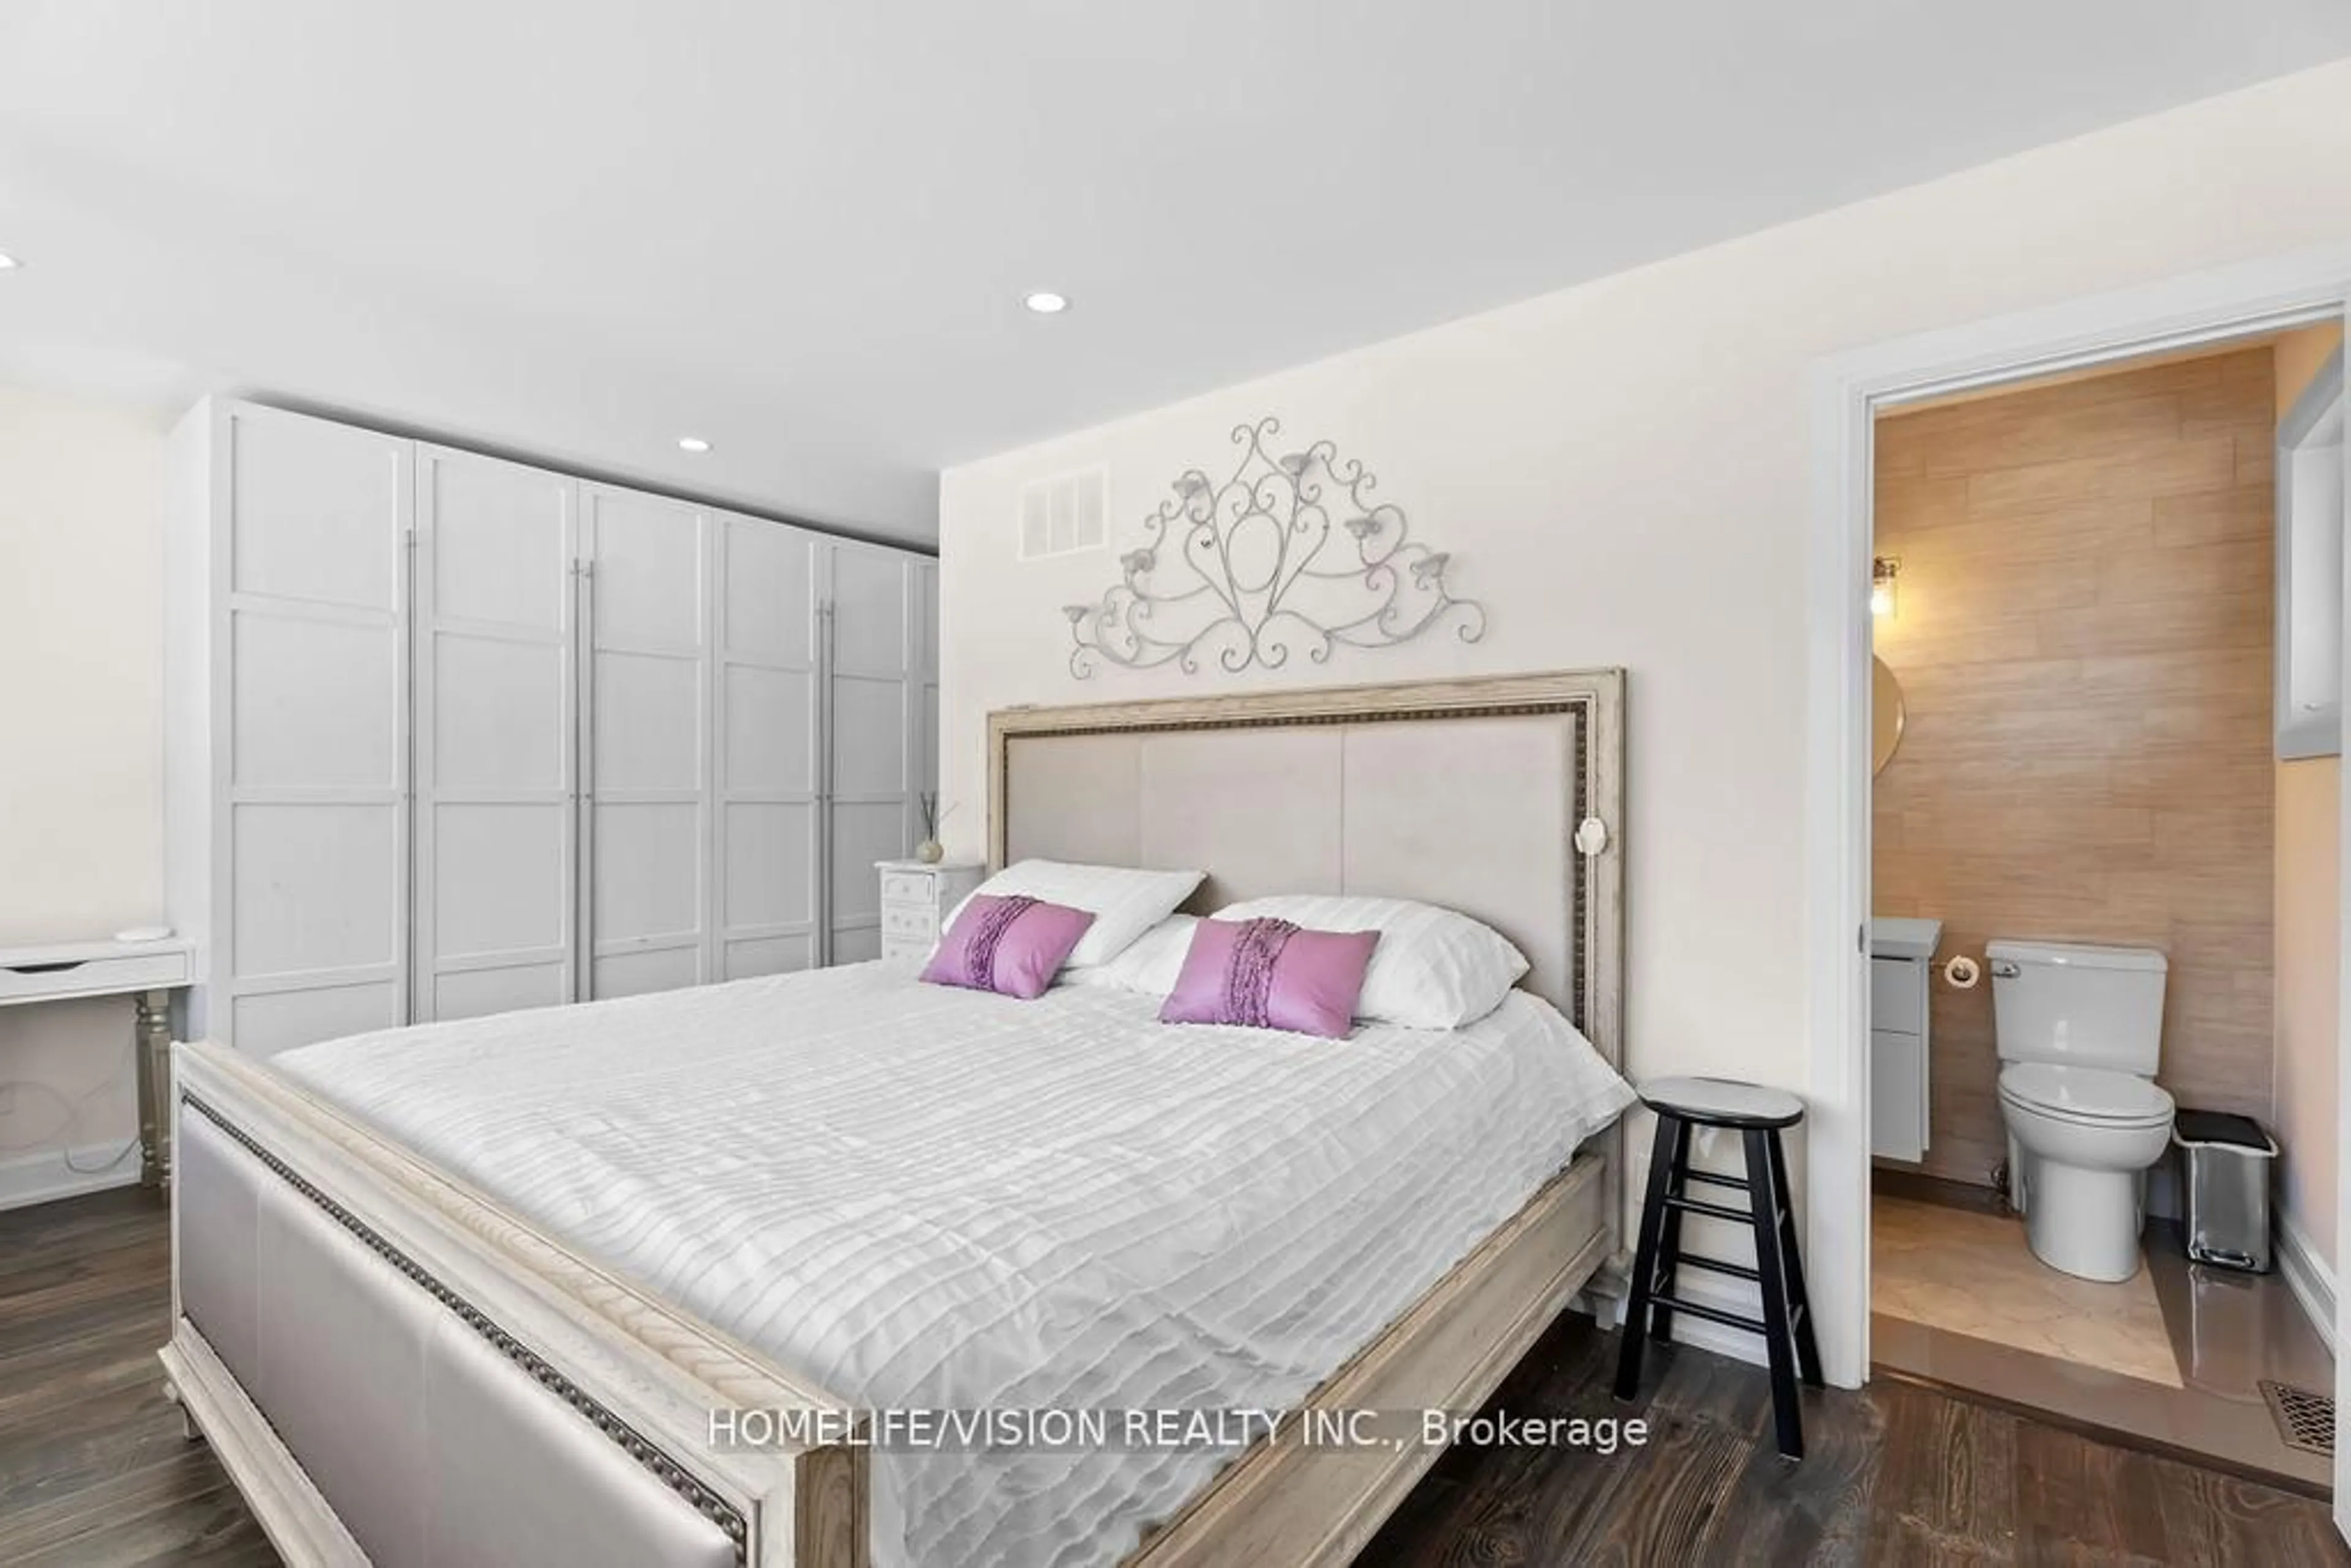
A pic from outside/outdoor area/front of a property/back of a property/a pic from drone, street for 35 Caswell Dr, Toronto Ontario M2M 3M2
3 days on Market

35 Caswell Dr, Toronto, Ontario M2M 3M2

Detached
3
2
~1100-1500 sqft
$1,850,000
Get pre-qualifiedPowered by nesto
Buy with Wahi to get
Up to
$18,500Cashback
Detached
3
2
~1100-1500 sqft

Contact us about this property

Call

Highlights

Property Estimate

Days on market3 days

Estimated valueNot available

Price/Sqft$1,457/sqft

Monthly cost

Open Calculator

CMA Subject Property

Curious about what homes are selling for in this area?

Get a report on comparable homes with helpful insights and trends.

+10

Properties sold*

$1.9M

Median sold price*

*Based on last 30 days

Description

Attention builders, renovators, investors, and self users. Well maintained 3 bedroom bungalow in a desirable location. Move in, renovate, or build your dream home on a 116.78 (front) x 135.16 x 57.91x 147.42 large lot. This is a prime development area surrounded by multi-million dollar custom homes. Minutes to public transit, schools, shopping, parks, and other amenities. Property being sold As Is/Where Is. All measurements are approximate.


Property Details

StyleBungalow
View-
Age of property-
SqFt~1100-1500 SqFt
Lot Size15,660 SqFt(135 x 116)
Parking Spaces2
MLS ®NumberC12291973
Community NameNewtonbrook
Data SourceTRREB
Listing byCENTURY 21 HERITAGE GROUP LTD.

Features

Heating: Forced Air
Cooling: Central Air
Basement: Finished

Main Floor

Kitchen

3.07 x 3.45

Family

5.3 x 3.3

Dining

2.77 x 3.44

Primary

4.2 x 3.3


Features

Lot size: 15,660 SqFt

Parking

Garage spaces 1

Garage type Attached

Other parking spaces 1

Total parking spaces 2


Property History

Jul 17, 2025
ListedActive
$1,850,000
3 days on market
history photo preview31
Listing by trreb®

Market Data - Newtonbrook

Geo Zone Map ThumbnailNewtonbrook

Strong Buyer's Market

View Market Data

Detached house - for the past 30 days

Buyer's market Seller's market

Avg. Days on Market

Past 30 days

30 days

Compared to

2024

21 days

2023

18 days

2022

28 days

New Listings

Past 30 days

48 listings

Compared to

2024

42 listings

2023

40 listings

2022

26 listings

Units sold

Past 30 days

6 units

Compared to

2024

10 units

2023

10 units

2022

11 units

Median Sold Price

Past 30 days

$1,337,500

Compared to

2024

$1,909,625

2023

$1,710,000

2022

$1,805,000


Population and Demographics

Overview

Total population 26506
Average household income $115,710

Age (%)

0 to 19
15%
20 to 34
22%
35 to 49
19%
50 to 64
21%
65 and plus
22%

Household composition (%)

Single family
62%
Single person
28%
Multi person
8%
Multi family
2%

Mother tongue (%)

English
34%
Iranian Persian
13%
Korean
9%
Mandarin
8%
Tagalog (Pilipino, Filipino)
8%
Russian
8%
Yue (Cantonese)
5%
Others
3%
Spanish
2%
Italian
2%

House tenancy (%)

Owners
53%
Renters
47%

What’s nearby?Essentials within 5 km

Local Logic

Transportation Scores

Estimated Budget